It started as a seemingly innocuous matter of curiosity in the NLP office – a pub quiz question, almost
[1]:
What share of the global economic output is produced in the world’s 10 richest countries?
Has this increased or decreased in the last 50 years?
Some guesses were made so we looked at the data to check if anyone was right (no one was, although this was blamed on the data being patchy).
For a moment, nothing happened. Then, after a second or so, nothing continued to happen
[2].
However, still thinking about interesting trends in the world’s 10 richest countries, while admittedly being influenced by the appointment of a new UK Prime Minister and one of the candidates in the upcoming US elections, another question came up in conversation:
How many of the world’s 10 richest countries have been governed by a female political leader?
Not many, we guessed. Then we thought that it would be nice, albeit depressing, to visualise just how many. Courtesy of our outstanding (and patient) Graphics team, the resulting infographic was used as NLP’s submission to the
2016 Information Is Beautiful Awards, where it was included in the
longlist. You can see it below.
It’s an A1 poster: you may want to click here to see a larger version.
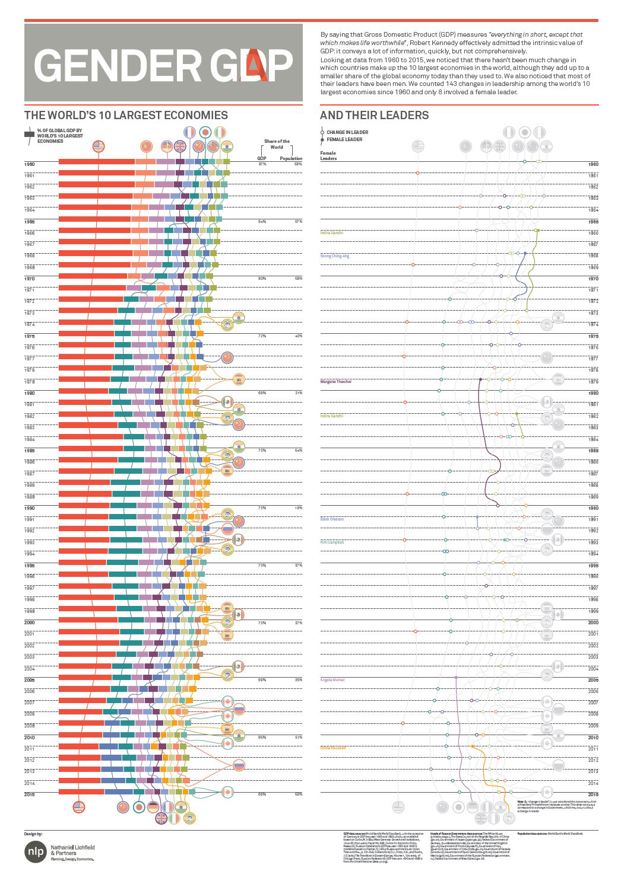
Some interesting findings on the left-hand side of the infographic, in no particular order:
- The share of the world’s economy produced in the 10 richest countries has decreased over the years – from 87% in 1960 to 66% in 2015. We found this was still a substantial figure, but an encouraging one.
- 9 out of the 10 richest countries in 1960 are still in the top 10 in 2015 – Russia (then, the USSR) lost its spot, Brazil entered – but there has been plenty of movement with the likes of Mexico and Spain making an appearance in the chart over the years.
- Comparing the share of the world’s GDP to the share of the world’s population in the group of the 10 richest countries leads to very inconsistent results. When China and India are in the group, the ratio seem fairly balanced (e.g. in 2015 the group accounts for 66% of the world’s GDP and 50% of the world’s population); when they aren’t, the concentration of global wealth in not-highly-populated countries appears stark (e.g. in 1990 73% of the world’s GDP was produced by 19% of the world’s population).
Some remarks on the right-hand side:
- The world’s richest economies have a very poor record of appointing female leaders. Out of the 143 changes in leadership[3] that happened in these countries between 1960 and 2015 (only when they were among the 10 richest in the world), just 8 involved a female leader.
- Over the 550 years of analysis, female leaders have governed for fewer than 47 years. This is a remarkably bad ratio of 8 years of female leadership for every 92 of male leaders for a world population, despite women having consistently made up around or slightly less than 50% of the world’s population since 1960[4].
- The number of changes in political leaders does not correlate with the number of female leaders – we were not expecting it would, but it was worth checking: whenever there is a change of leader, one would expect that the newly appointed one has the same chances of being male or female. However, the countries that change political leaders most often, Japan and Italy, have never had a female leader. Gender equality is down to many things, but chance is not one of them.
In conclusion, our analysis shows that the world is a relatively less unequal place in terms of wealth (although we appreciate we did not look into individuals’ wealth, but that of countries). And while there
have been improvements in gender equality for a great number of metrics in recent years, we thought it was important to show that we still have a long way to go.
[1] We do attend rather geeky pub quizzes, but aren’t all pub quizzes that are worth attending geeky?
[2] Well spotted, galactic hitchhikers.
[3] By “change in leader”, it was considered the instance in which a President/Prime Minister replaces another. This does not always correspond to a change in Government.
[4] World Bank, Databank, Gender Statistics. For reference, the world’s population female-to-male ratio was 49.5:50.5 in 2015 and 50:50 in 1960.