04 May 2022
As we mark 100 days since the launch of the Levelling Up White Paper and with local elections taking place in many parts of the country, Lichfields’ latest research reflects on how local areas can capitalise on one of the Government’s flagship policies. We explore the geography of socio-economic needs, opportunities for growth and local structures and resources, to assess where levelling up policy might make the biggest impact and what are the critical success factors for local areas to deliver these outcomes.
Introduction
More than two years after Boris Johnson promised to ‘level up’ across the UK in his first speech after the December 2019 election, the recent Levelling Up White Paper was one of the most anticipated policy documents seeking to address regional economic disparities that most can remember.
While the pandemic had delayed the progress of levelling up policy, in the interim, the political aspiration had been set. The Prime Minister had been referencing levelling up in a range of speeches and interviews, emphasising that it is not intended as merely an exercise in building new civic buildings, but a much broader set of cross-Whitehall priorities including reducing crime, increasing skills and restoring civic pride. By last September, even the re-named Department for Levelling Up, Housing and Communities (DLUHC) had been created.
Significantly the Chancellor’s Comprehensive Spending Review in October 2021 also set out the funding envelope. This included £1.7bn for the first round of the Levelling Up Fund (LUF) unveiled for all English regions and the devolved administrations with just under a half of the money going to the North East, North West, West Midlands and Yorkshire and Humber combined. Some £1.7 billion remains available to be allocated through the recently-launched LUF Round 2, which was accompanied by some
changes to the prioritisation of local areas.
So against this backdrop, it might have been less clear what was left for the White Paper? Launched in February, the
Levelling Up the United Kingdom White Paper contained a thorough analysis of the challenge, reflecting on 9,000 years of urban change across 332 pages, 6 capitals, 5 pillars, 4 objectives and 12 new ‘missions’. Few observers would disagree with the extremely thorough diagnosis and analysis of the challenges to be addressed.
The 12 missions are intended to provide consistency and clarity over levelling up policy objectives. These will serve as an anchor for policy across government, as well as catalysing innovation and action by the private and civil society sectors. However, these missions are largely a continuation of previous policies (e.g. the Industrial Strategy), and have no specific additional funding attached to them (for now at least) beyond what has already been announced.
Despite this, it is clear that the White Paper aims to effect meaningful change to the economic geography and prospects of the country, by setting out transformative systems and structures that target resources and priorities more effectively over the long term. Evaluated against these aims, the impact of the systems change could be significant – particularly its cross-Whitehall statutory remit – but inevitably implementation will take time and it may be even longer before enduring structural improvements start to materialise.
Identifying the routes to growth?
The geographical disparities in the UK economy are significant and longstanding. The levelling up agenda follows successive earlier eras of regional economic policy – from the Northern Powerhouse and Metro Mayors, the Regional Development Agencies, Regional Growth Funds and even some of the principles of the Social Exclusion Unit. Indeed, most of the areas now identified as in need of levelling up were the same areas supported by the Special Areas Act passed in 1934.
The White Paper sets out a new ‘Framework for Evaluating Geographical Disparities’ defined by six ‘capitals’: physical, intangible, human, financial, social and institutional. It goes on to state:
“For individual places, the balance between and quantity of these six capitals affects economic opportunities and social outcomes for the people living or working there.”
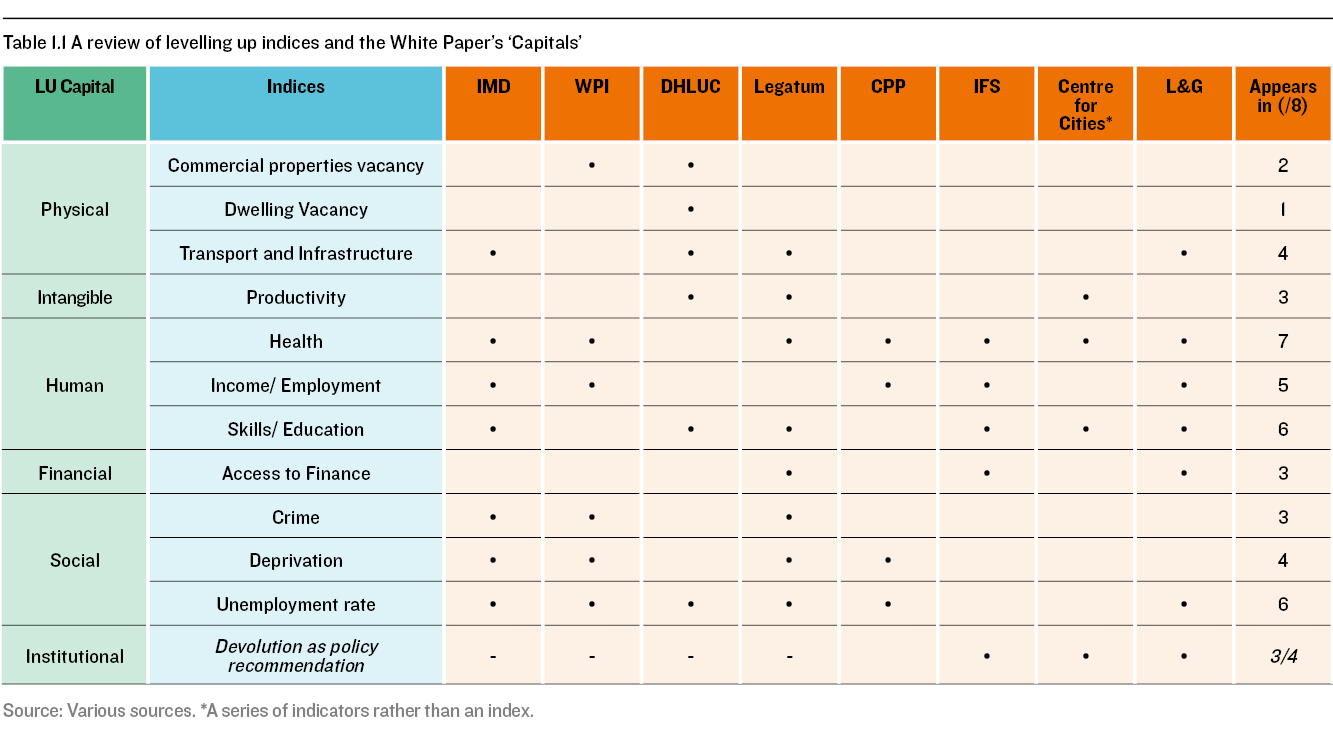
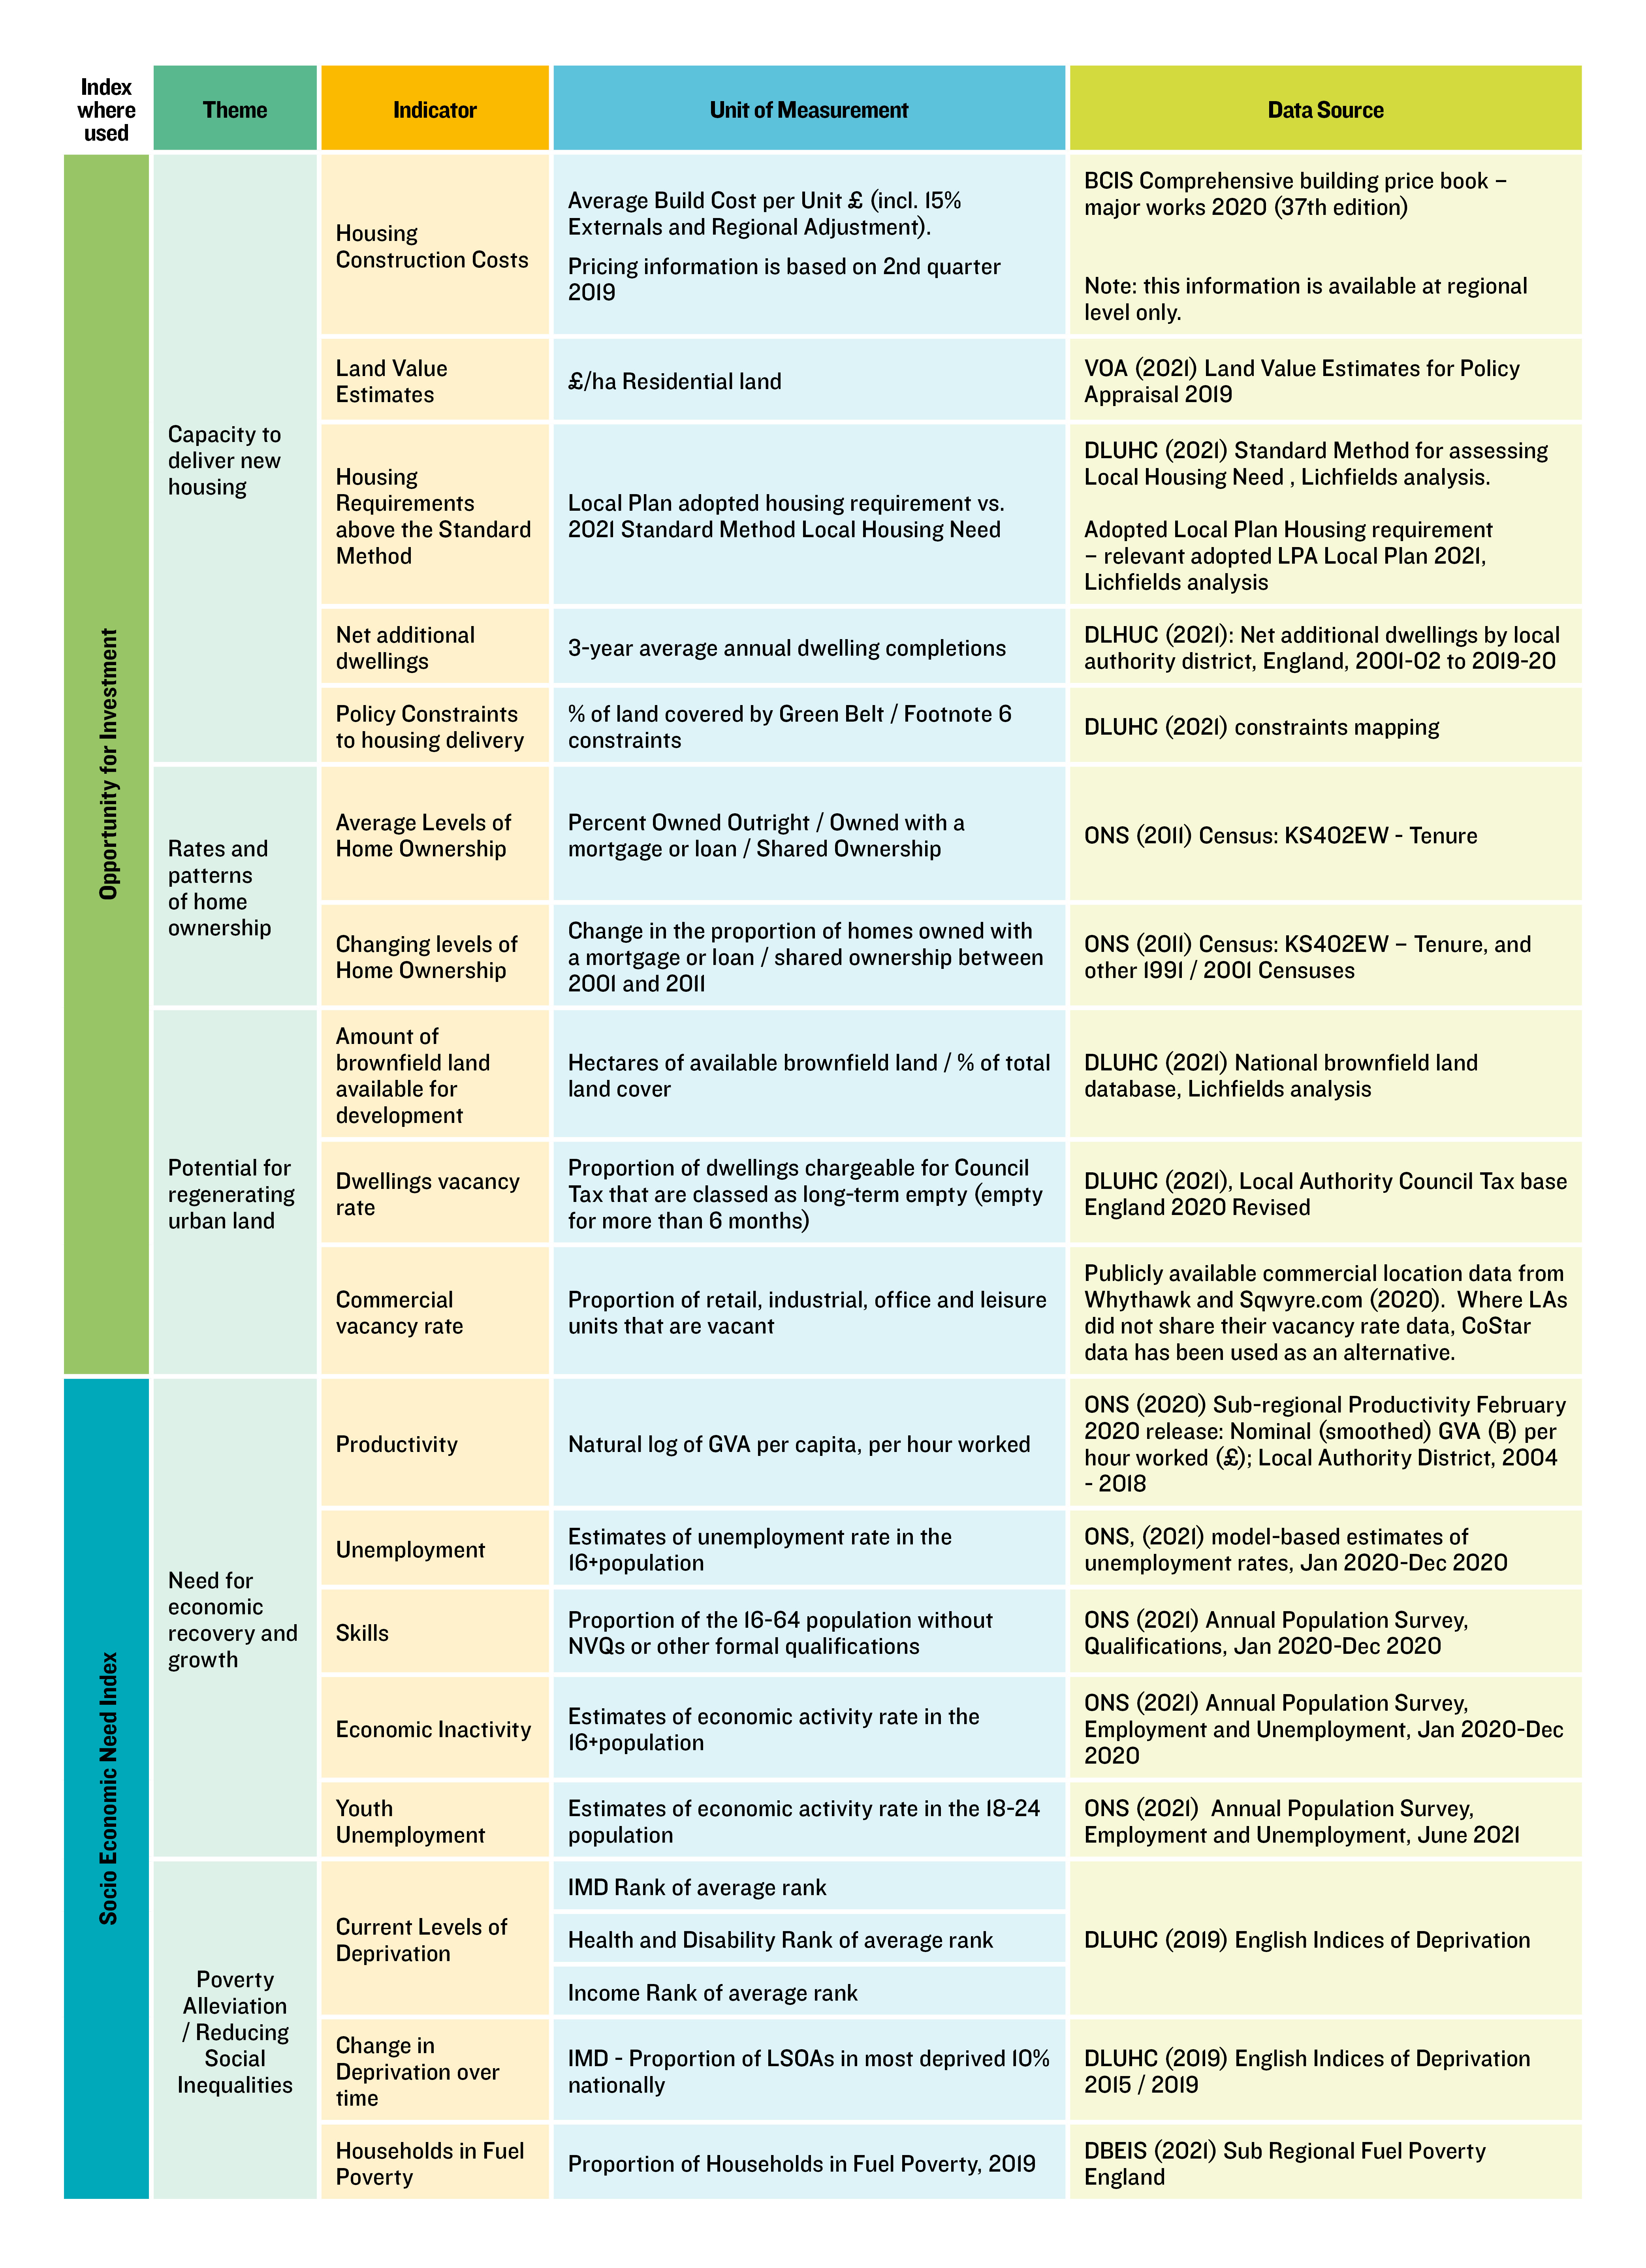
Lichfields has reviewed a number of the recent indices published on this topic from various organisations and research sources and finds these six capitals align closely to a relatively consistent set of indicators that are identified as a means of measuring the need for levelling up (Table 1).
Table 1 A review of levelling up indices and the White Paper’s ‘Capitals’
Source: Various sources.
*A series of indicators rather than an index.
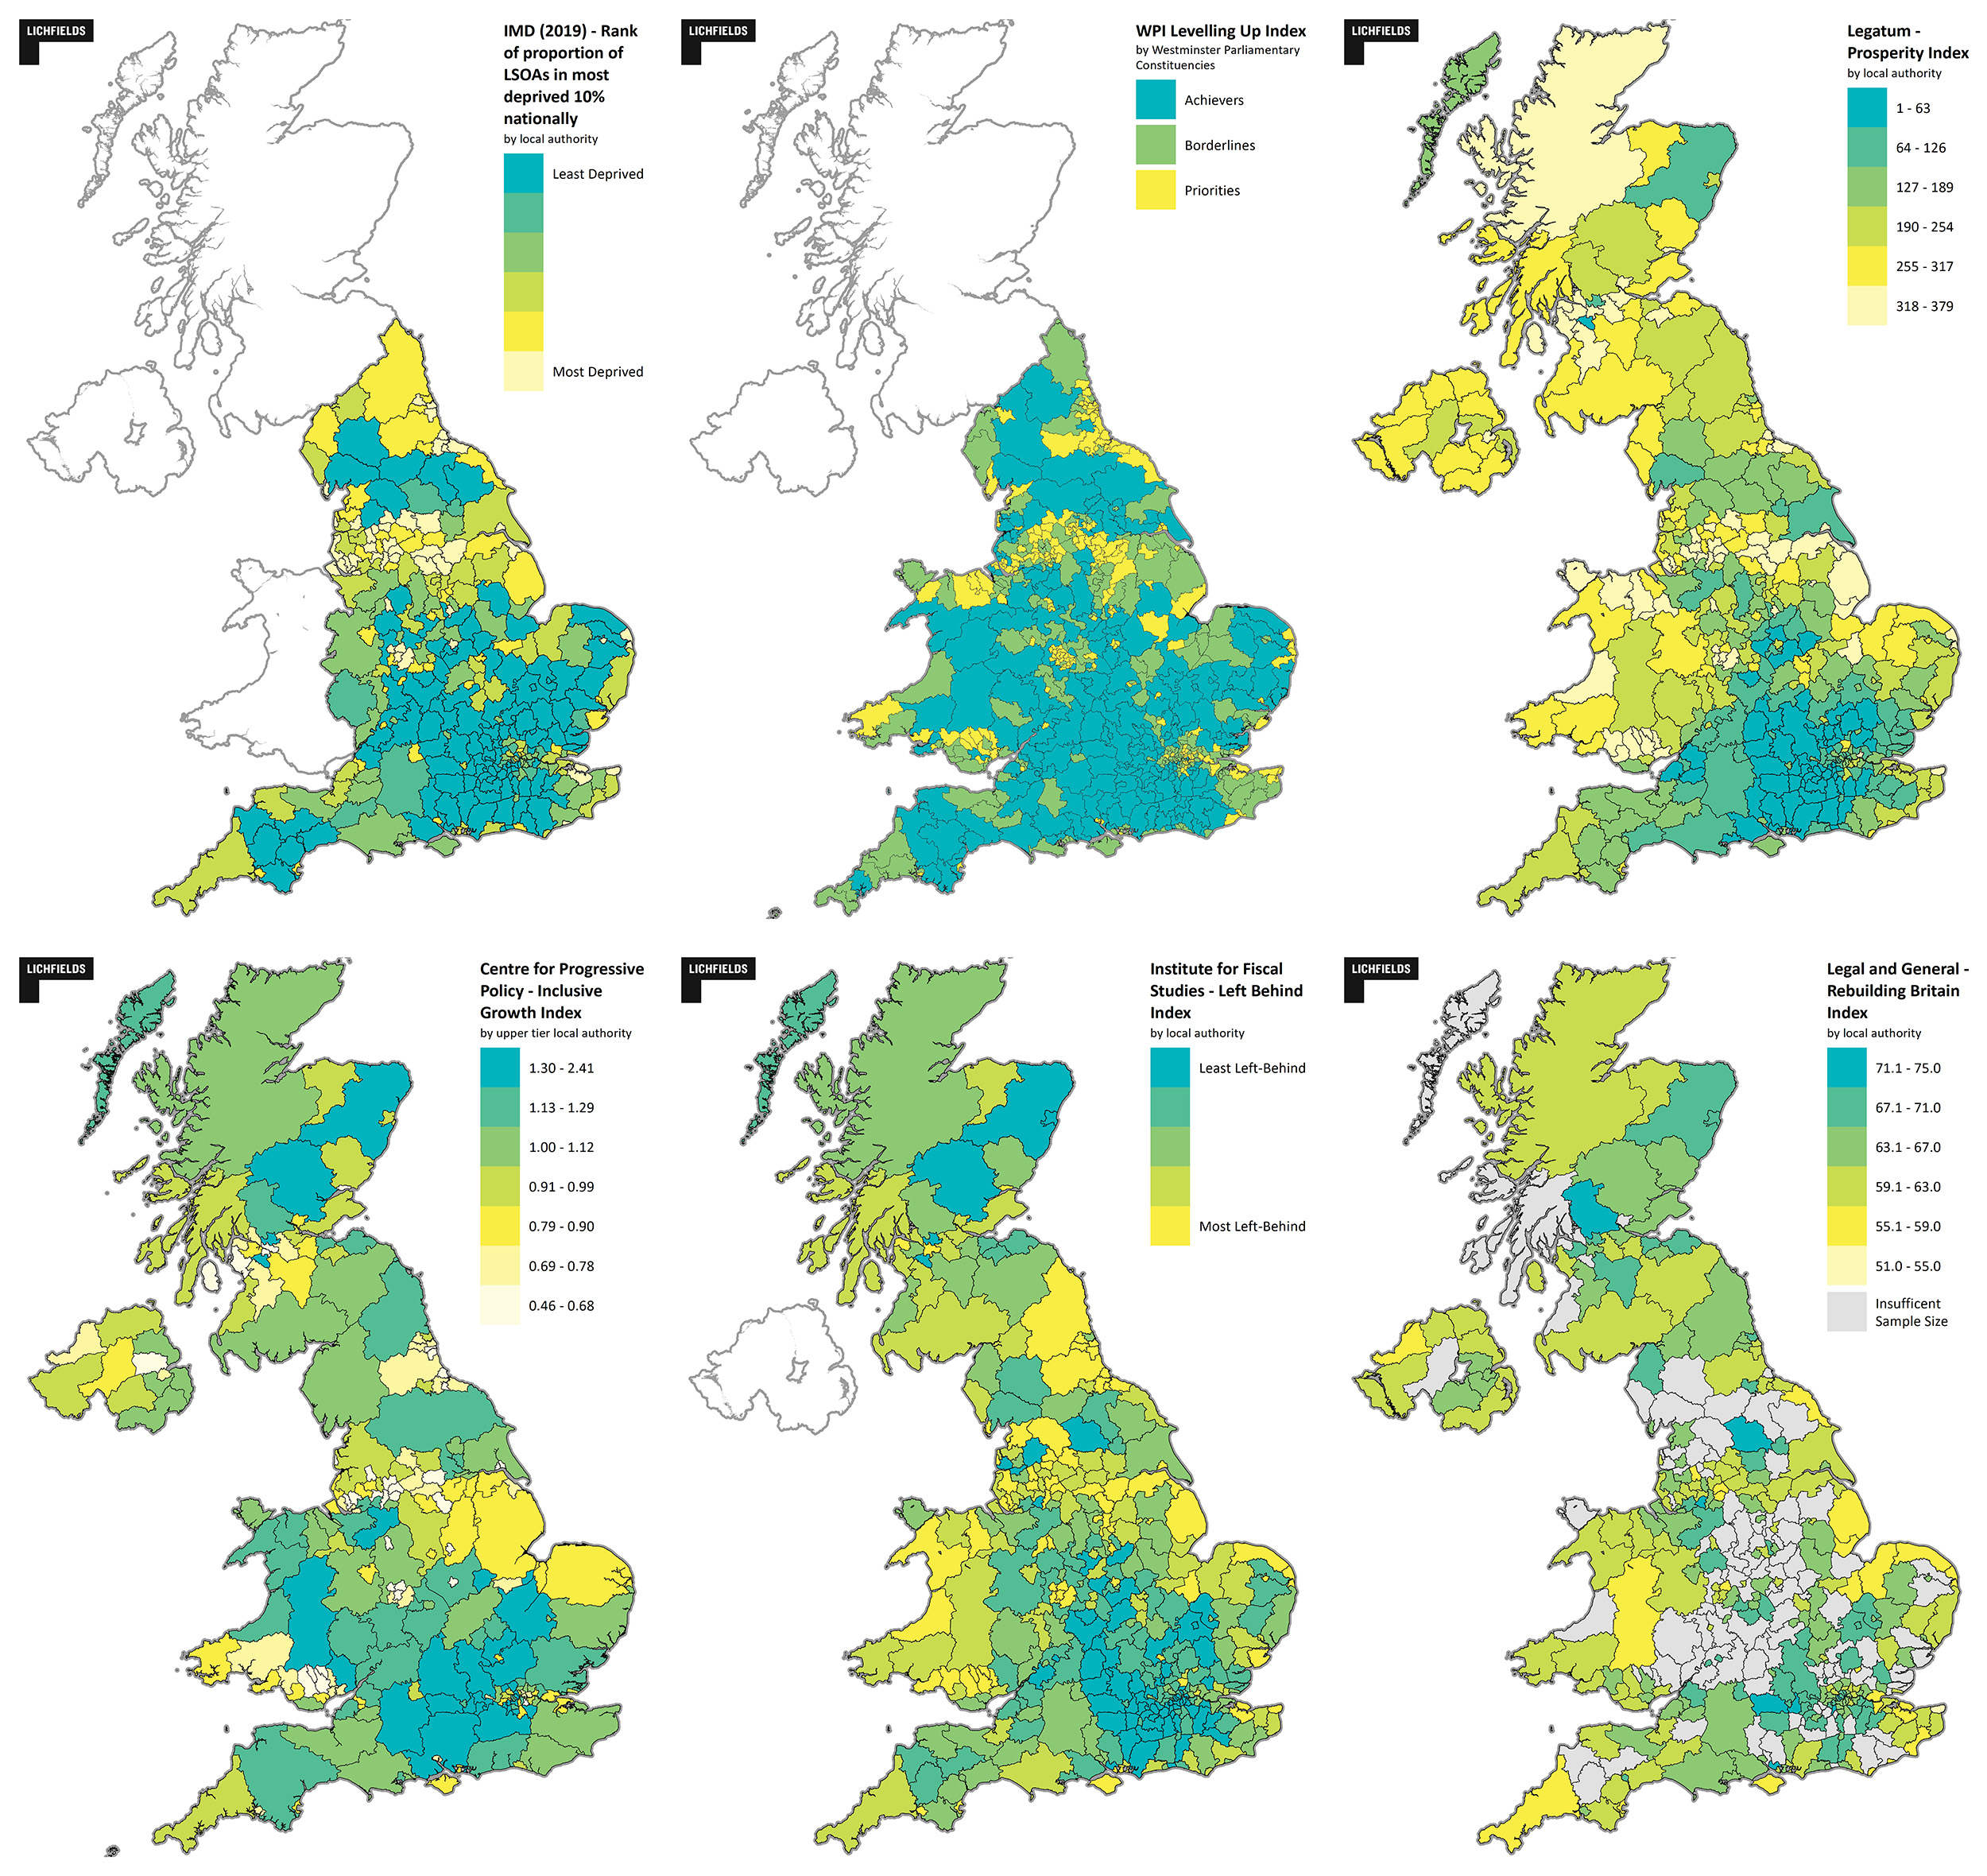
Similarly, these indices tend to show a recurring spatial pattern of areas in need of levelling up (Figure 1). Most show a clear north-south divide, but also to varying degrees with coastal and rural areas performing less well on aspects such as job creation or transport connectivity. From a baseline position at least, both the need for and geography of levelling up appears to be well understood and agreed upon.
Figure 1 Levelling Up Indices Maps
Source: Various sources
Where might levelling up make the greatest difference?
Analysing the baseline position is important, but only takes the levelling up analysis so far. To better understand which areas might benefit from levelling up policies, and in turn deliver significant changes for their communities, Lichfields has formulated a broader index which measures each local authority in terms of:
- Socio economic need;
- Opportunity for investment; and
- Resources to deliver change.
An area which has both significant socio economic needs and also has opportunities for investment might be viewed as a prime opportunity for levelling up, provided that such an area has the institutional resources to be able to support delivery of those opportunities. Our analysis identifies the corresponding spatial pattern for each of these three different aspects, before combining them to identify areas in which levelling up might be expected to generate the most positive results. These measures align closely with the ‘capitals’ identified by White Paper but are more focused on the opportunities of areas to deliver change.
1. Socio economic need
| |
|
|
| |
-
Need for economic recovery and growth
-
Alleviating poverty
-
Reducing social inequalities
|
|
| |
|
|
The government has been clear that increasing productivity and growing living standards in poorer performing places is fundamental to levelling up. Decisions on where will benefit from the latest round of levelling up fund investments will be made by measuring places’ need for investment within the scope of the LUF’s investment priorities as shown in Figure 2.
Figure 2 Levelling Up Fund (Round 2) Prioritisation of places index
Source: Levelling Up Fund Round 2 DLUHC, 2022
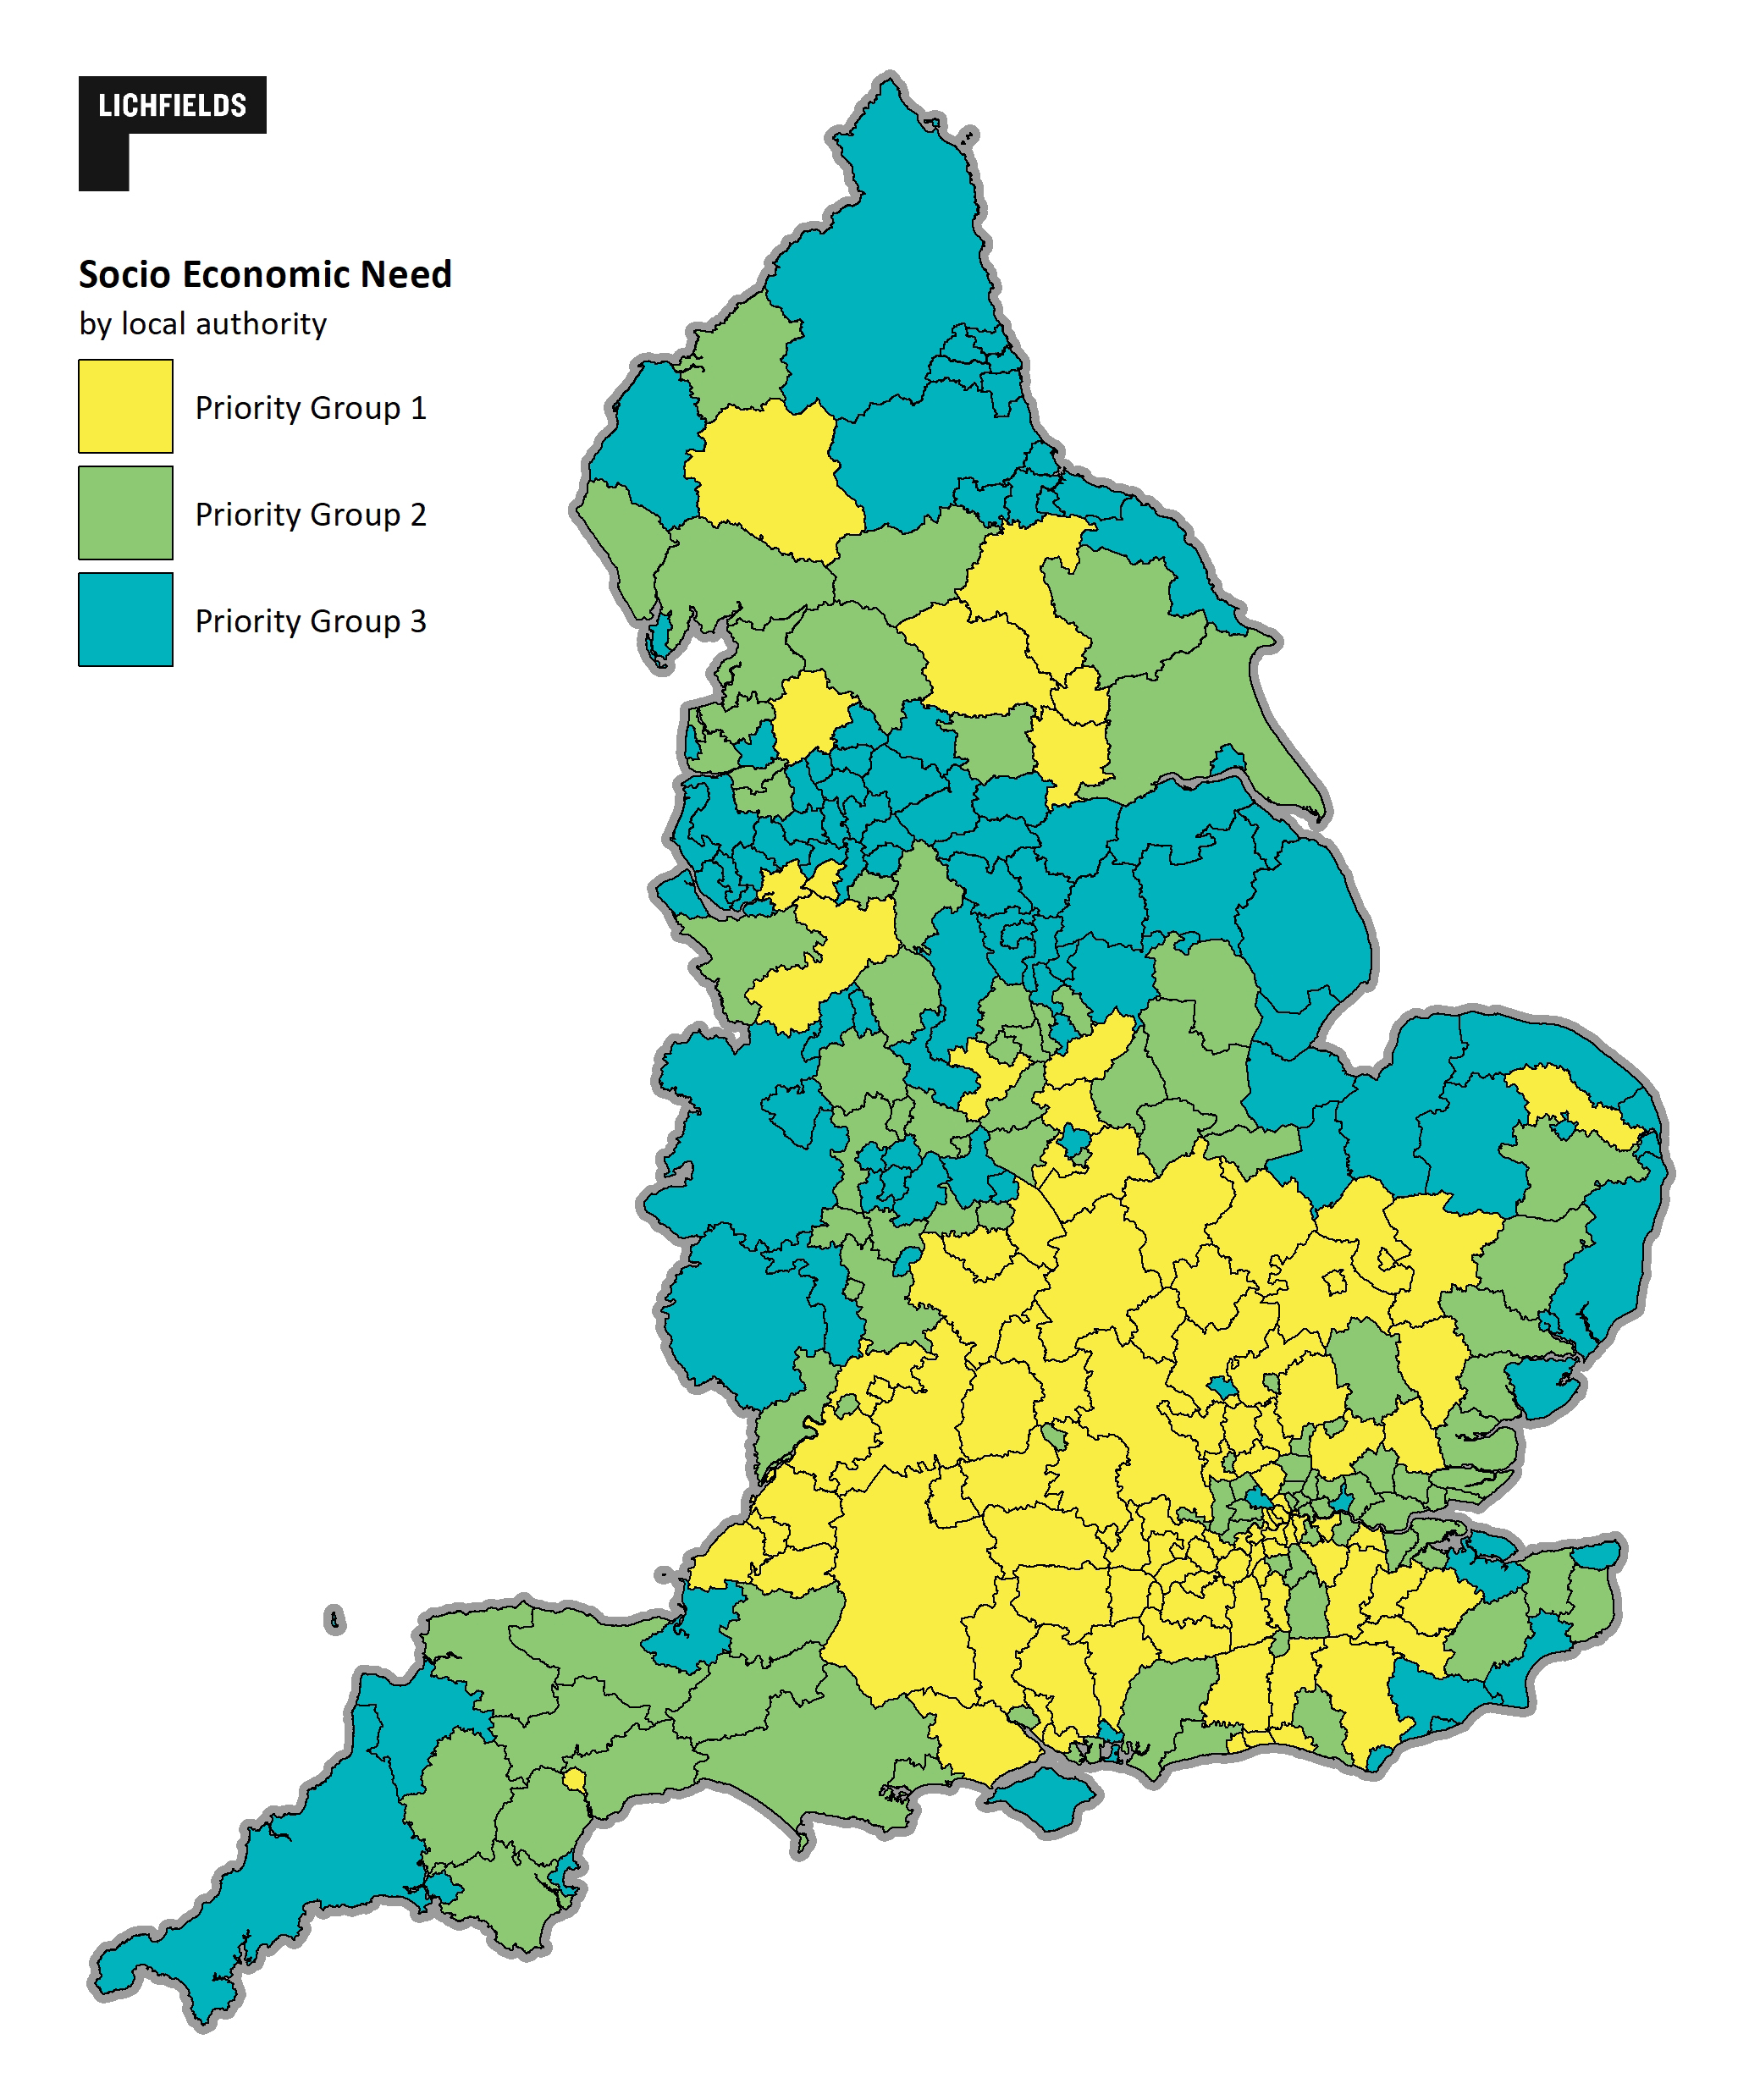
Our analysis (Figure 3) measures some of the headline priorities for levelling up: productivity, unemployment, skills, deprivation and economic activity. The performance and change in the areas of the country with the greatest socio-economic need (Priority Group 3) will be particularly important when it comes to evaluating the success of ‘levelling up’ over time.
The spatial pattern of socio-economic need across the country reflects a similar geography to the other indices shown previously (Figure 1). Broadly the North and Midlands, urban and coastal local authorities show up as areas of greatest priority for ‘levelling up’, however it is important to note that there are pockets of need across all regions.
Figure 3 Socio Economic Need Index (Blue areas are more in need)
Source: Lichfields analysis
2. Opportunity for investment
| |
|
|
| |
-
Capacity to deliver new housing
-
Rates and patterns of home ownership
-
Potential for regenerating urban land
|
|
| |
|
|
The second part of our analysis examines which local authorities may have the most opportunities for investment in physical regeneration. Many of the aspects of socio-economic need mapped previously will be best addressed through the welfare system, healthcare and education, whose funding is administered through departmental budgets across Whitehall. However, for some elements, ‘place’ matters more.
An emergent geography of levelling up priorities are already seen in the 20 towns and city centres receiving regeneration funding as well as the re-orientation of Homes England’s focus towards regeneration and town centre investment. The first round of LUF spending and the Brownfield Housing Fund announcements provide a clear indication of where we might expect future investment rounds.
Figure 4 Brownfield Housing Fund (L) Levelling Up Funding Round 1 (R)
Source: Lichfields analysis: DLUHC, 2022 Levelling up White Paper
Our ‘opportunity for investment’ indicator consider the quantum of brownfield land available for development in each local authority, as well as vacancy rates in commercial and residential sectors.
The Prime Minister and Secretary of State have both made clear that developing brownfield land is central to their house building and economic growth plans. Reflecting this opportunity, our measure of the capacity to deliver new housing shows local authorities ranked against their ability to attract and sustain development in this context. From a market perspective, areas with relatively lower construction costs and higher land values may provide greater incentives for new housing, while on the planning side, the identified level of local housing need, willingness of local authorities to exceed the minimum local housing need identified by the standard method, and relative degree of planning policy constraints in an area may influence deliverability.
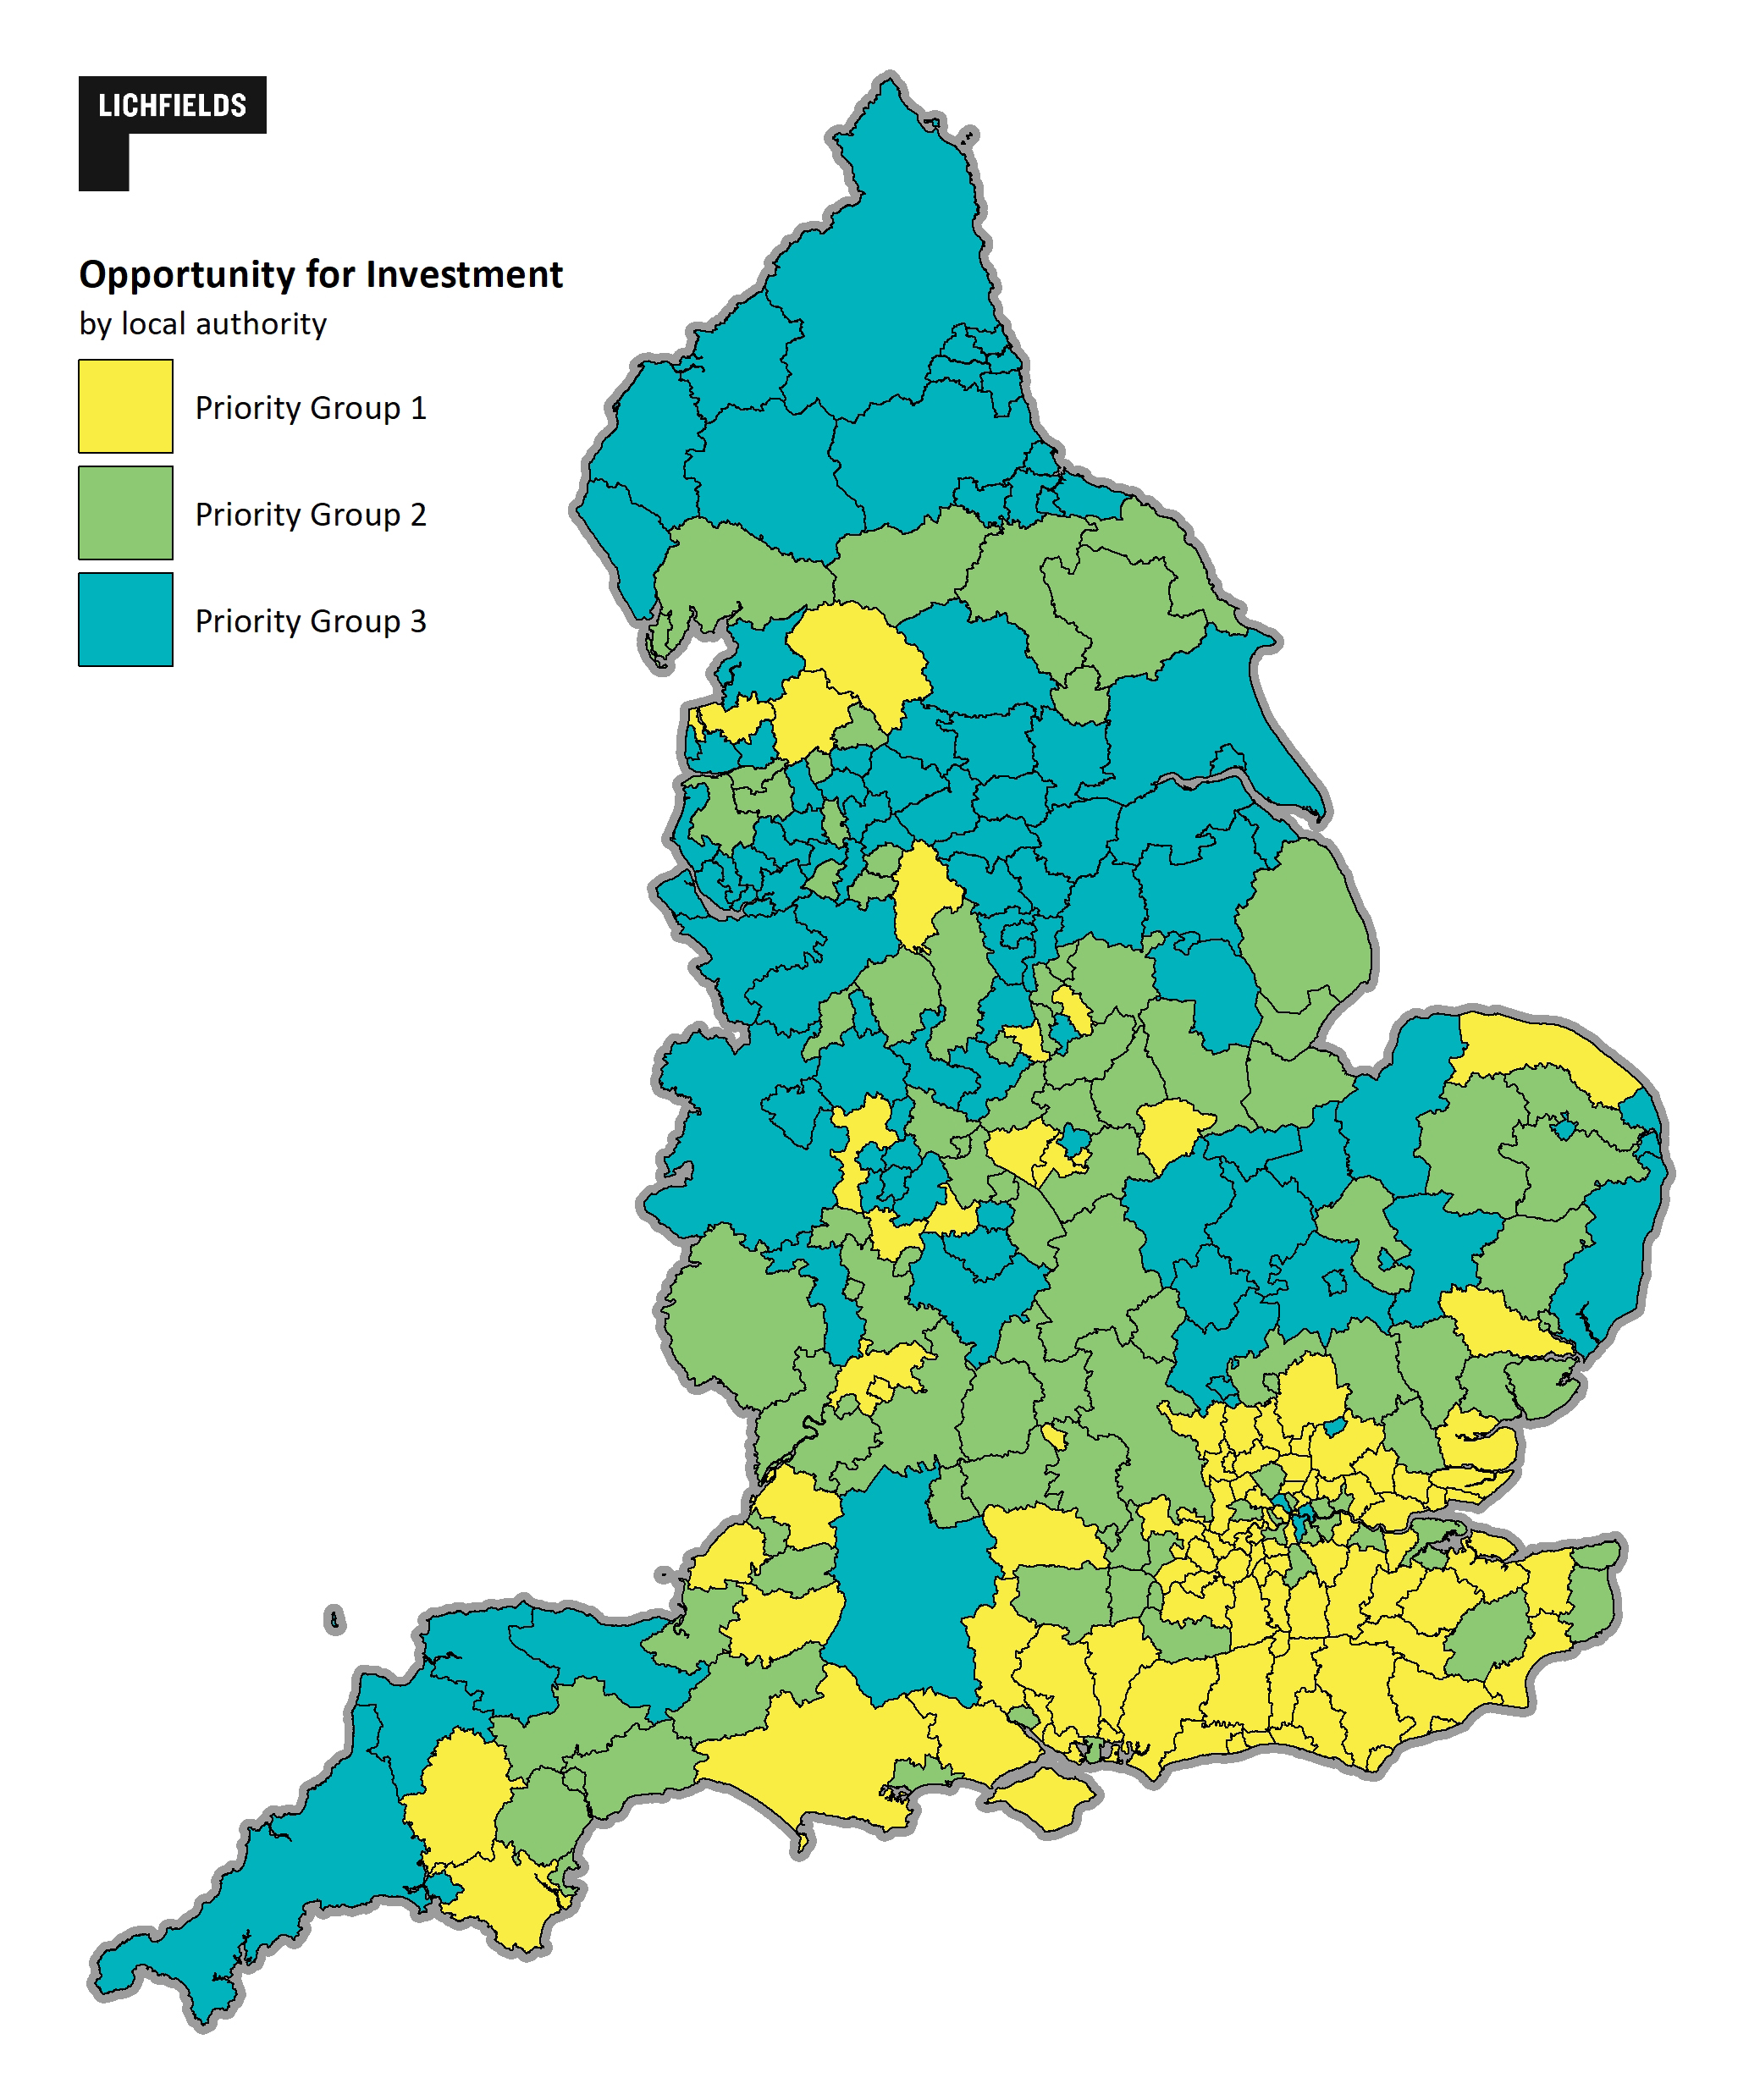
The spatial pattern for our ‘opportunity for investment’ index shows that two thirds of the areas with the highest need for levelling up (i.e. those falling within Priority Group 1 based in socio-economic needs) also have the highest opportunity for investment (Figure 5).
Figure 5 Opportunity for Investment (Blue areas have more opportunity for investment)
Source: Lichfields analysis
There are local authorities with significant opportunities for investment identified across all regions using this measure. Larger urban areas are all in the top priority group for investment opportunities, however there are also non-urban areas in the North, Midlands and South West that score well on this measure. These are local authorities which have the land that can accommodate growth and are areas that offer opportunities for investment in housing stock, infrastructure and regeneration spending (with higher level of vacancies in commercial and residential buildings).
[1]
3. Resources to deliver change
| |
|
|
| |
-
Current status of devolution
-
Next steps for proposed devolution deals
|
|
| |
|
|
While areas may have the socio-economic characteristics that point to needing levelling up, and have the investment opportunities to do so – ultimately – delivering that change requires some degree of local resources and powers to be in place, either now or in the future. Places with established institutions and leaders are those that are best placed to strategically deliver change for their local areas, and most likely to be able to action change in their areas using the funds and powers. For example, the White Paper is clear that future funding will be directed through elected mayors and governors, and the £2.6bn UK Shared Prosperity Fund will primarily operate over Mayoral Combined Authorities in the round to March 2025.
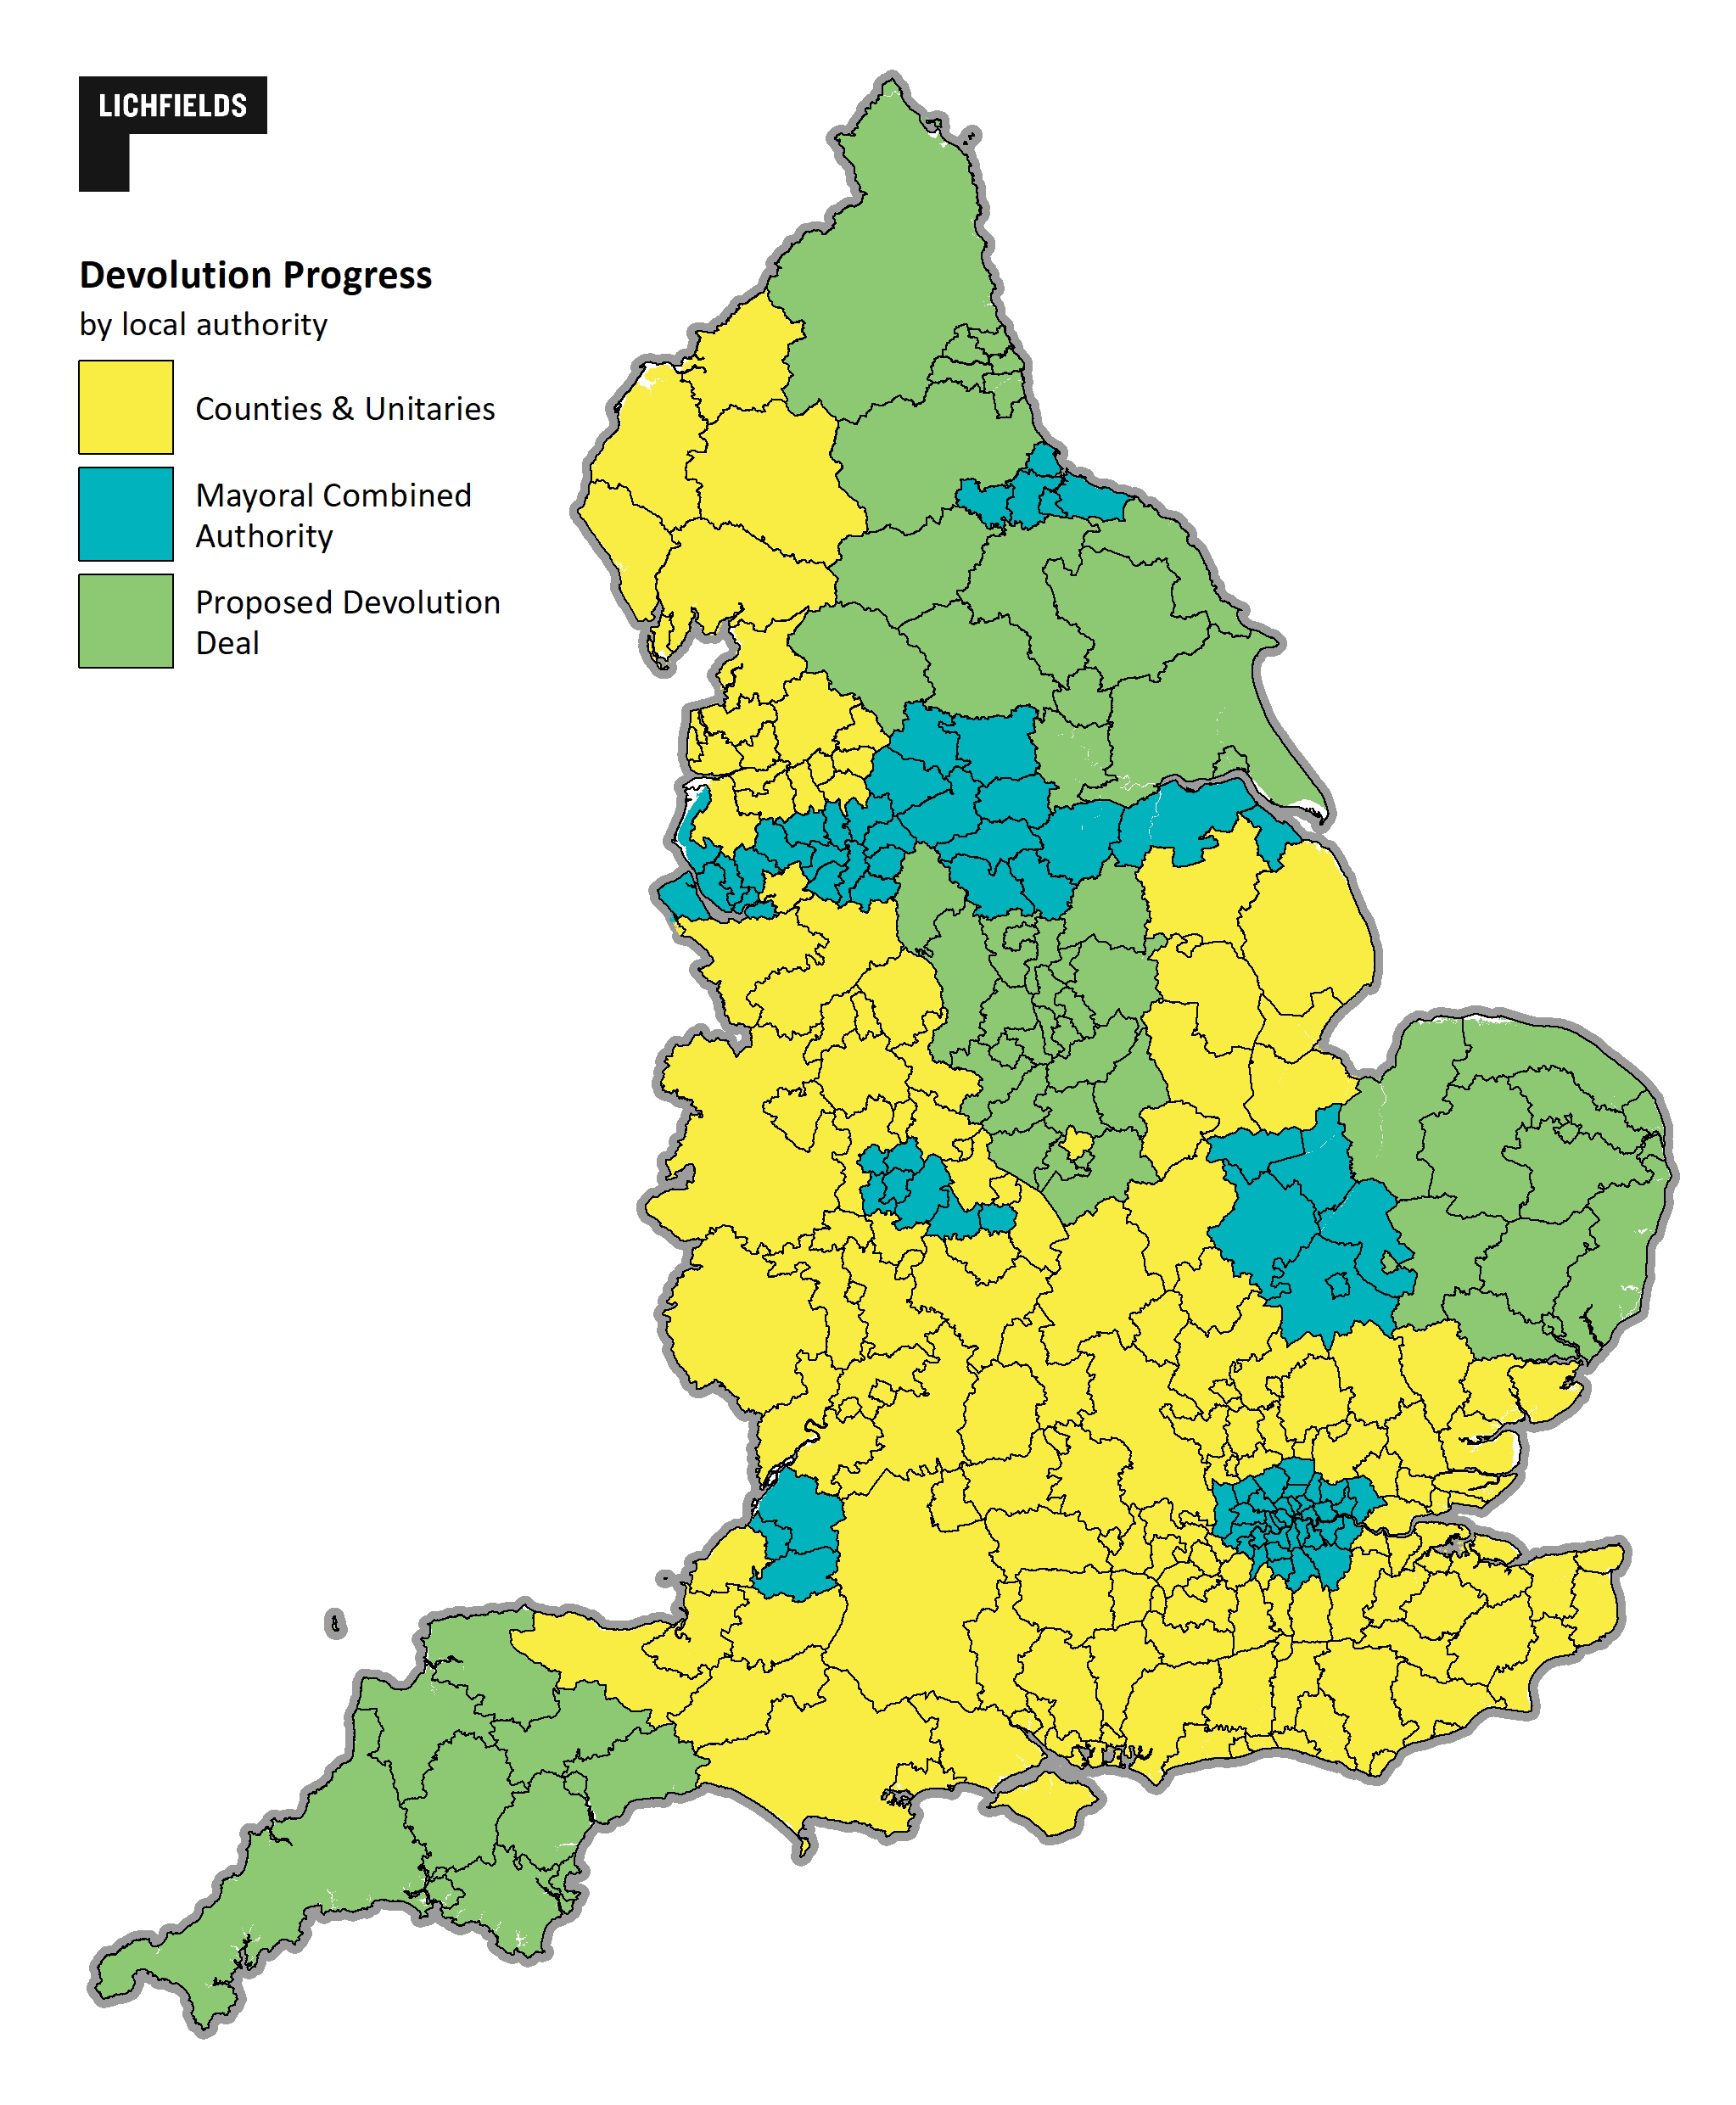
Our third measure classifies each local authority in terms of those currently in combined authorities and with metro mayors (group 1), those known to be progressing deals (group 2) and those areas that have potential to negotiate county deals based on reports in the media (group 3). These groupings are consistent with the devolution framework set out in the White Paper and are shown in Figure 6.
Figure 6 Index of Devolution Progress
Source: DHLUC 2022, Levelling Up White Paper.
The pattern of devolution clearly shows the (largely core city) established Combined Authorities. With access to relatively greater strategic powers and budgets, city regions could be best placed to administer change in their areas. This covers much of the urban North West, and North East – an echo of the Northern Powerhouse of a previous policy era – as well as the West Midlands, West of England, Greater London and Cambridgeshire and Peterborough.
Areas which have been identified as progressing with proposed devolution deals are potentially ‘next in line’ to benefit from greater local powers and freedoms. The devolution framework set out in the White Paper makes clear that, to capitalise on the benefits of devolution, a combined authority or County Council would need a directly elected mayor (DEM) with powers across a functional economic or whole county area. For much of the country, including mostly rural areas, county deals will form the future governance geographies and institutions and include leadership roles for county ‘governors’. To improve decision making between local and national government, the Government is also establishing nine regional levelling up directors.
The White Paper commits to ensuring all areas can negotiate devolution deals in keeping with this framework by 2030. Past experience shows that these deals can take some time to negotiate and agree between Whitehall and local stakeholders, and again to establish their roles and priorities. Thererfore areas which are already progressing their deals with government are more likely to benefit in the next round of devolution and within competitive funding bids.
Reflections – where is the levelling up agenda headed?
| |
|
|
| |
Change is most likely to be achieved in places where some degree of need, investment opportunity and the ability to deliver change coalesce.
|
|
| |
|
|
Established institutions are typically further along with strategic plan-making than newer institutions which also need to organise their economic geography, political structures, policy levers and priorities. With all else equal, established institutions might therefore be considered better placed to make decisions and allocate funding more efficiently, and therefore receiving backing from government.
Just one in five of the local authorities that are in the top priority groups on both the need and opportunity measures currently benefit from the preferred model of devolution set out in the White Paper, i.e. with a directly-elected leader covering a well-defined economic geography.
Additionally, almost half (44%) of authorities that are in the top priority groups for need and opportunity are progressing towards local deals. For these areas securing effective deals promptly will mean they will be better placed to administer and prioritise the funding and additional powers they secure.
| |
|
|
| |
Areas will need to create new structures and political arrangements if they want to maximise the potential for devolved funding and powers to be agreed locally.
|
|
| |
|
|
In keeping with one of the objectives in the White Paper to “empower local leaders” a devolution framework was set out for the first time with a clear menu of the types of powers and functions that could be devolved to local areas – in essence, greater powers are possible with more formalised structures and local political leadership. For example, powers over transport planning, access to investment funding, partnering with Homes England and brownfield funding will all require ‘level three’ devolution powers, which equate to a single institution and directly elected mayor or county governor. The Secretary of State and Prime Minister have also commented previously that they see combined authorities with elected mayors as being best placed to benefit from deeper and wider devolution deals to come, including business rates reform.
The United Kingdom Shared Prosperity Fund pre-launch guidance was also released alongside the White Paper. The guidance puts counties and combined authorities in place to lead the £2.6 billion fund to 2025. Instead of competitive bidding for the funds, it will be allocated to places, with lead authorities now developing Local Investment Plans to determine the priorities and outcomes for their local area. Details of allocations, the Multiply Programme and guidance for investment plans are expected soon.
Local authorities now have a clear incentive to negotiate with their neighbours and form effective governance structures in order to make the most of these funds and powers.
| |
|
|
| |
The opportunity for levelling up to create lasting structures that deliver change is significant. But this will demand long term political leadership and resources to meet this ambition.
|
|
| |
|
|
If new devolution deals lead to the creation of effective institutions that match the ambitions set out in the devolution framework, this could have the potential to be at least as significant as new funding streams to achieving levelling up in the longer term. However, devolving more powers to more places will also require a fundamental shift in Whitehall towards a consistent cross-departmental approach that can endure over multiple parliaments as well as an ideological shift that allows for less centralised control.
This makes the sections of the White Paper that set out new structures and systems particularly crucial to understanding what change can be achieved in the long term. The White Paper commits to all policy across Whitehall aligning with the levelling up agenda including a statutory obligation to measure spatial outcomes. This statutory obligation for all departments to include levelling up in their priorities offers long term certainty without the risks of being a ‘pet project’ of a department or minister.
As such, the Secretary of State has made clear his ambition to work with other departments – particularly the business, education and transport portfolios, as well as Homes England. Equally important must be HM Treasury and the Department for Work and Pensions. It will require this ‘whole system’ buy in to deliver change for the areas that need it most across the wide range of indicators that are set out to be monitored and evaluated.
| |
|
|
| |
Devolved powers and new structures don’t necessarily make tough decisions easier, and new institutions will take time to start delivering.
|
|
| |
|
|
The first wave of ‘metro mayors’ are arguably only now just starting to deliver with Andy Burnham, Steve Rotherham, Ben Houchen and Andy Street ‘making their
voices heard nationally’ drawing upon a strengthening local profile and support base
[2]. However, all had to overcome early struggles to form and establish their institutions.
Manchester which is often held up as the trailblazer of devolution beyond London offers a cautionary tale. The GMCA commenced the preparation of a spatial framework in 2014 to deliver the homes the city region needs across all ten authorities. The GMCA initially wanted to prepare a Strategic Development Strategy (SDS) similar to the London Plan but legislation wouldn’t allow the allocation of sites through an SDS. Instead, the joint plan that they are required to submit as a Mayoral Combined Authority is a Development Plan Document (DPD), meaning that specific sites can be allocated (as opposed to the Greater London Authority’s higher level strategic plan, which leaves site allocations to the 33 individual boroughs). This has led to significant delays and tough decisions, with the latest 9 authority iteration only just submitted to government and a long Examination process is anticipated. As well as losing one local authority from the original ten (Stockport), the latest plan accepts losing a potential £68m housing deal from central government in lieu of a lower overall housing target
[3] and has delayed the opportunity to strategically plan for housing over eight years. If the Plan successfully navigates Examination, there is a requirement for all 9 authorities to sign off the Plan again before it is adopted. In the event that the Inspector recommends changes including the introduction of new allocations through Main Modifications, there is a risk that one authority could bring the entire Plan down by voting not to adopt the Plan.
Similarly, the 2009 round of re-organisation to unitary authorities shows a close precedent to the type of political geography proposed for county deals. However, progress on new local plans in some areas has been slow within the new geographies. Durham County Council’s plan was only adopted in 2020, Central Bedfordshire in 2021 and Northumberland has not yet adopted an NPPF-compliant plan. However, in other areas plan-making was quicker, for example Wiltshire’s unitary plan was submitted in 2012 and adopted in 2015.
These examples show that the institutional re-organisation required for significant systems changes can lead to delays in delivery and take time to ‘bed in’. As such there can be a ‘hiatus effect’ which slows effective plan making and therefore the delivery of new homes.
| |
|
|
| |
A policy of using house building to level up areas is not an alternative to also delivering homes in high demand areas.
|
|
| |
|
|
The White Paper makes clear that the Government will direct housing investment towards the North and Midlands in order to address the economic imbalances across the country. The Secretary of State highlighted the current 80/20% split of housing funding in favour of the Greater South East – referring to specific Homes England enabling funds – that could be re-directed in support of levelling up. Alongside this there is an initial commitment that most of the £1.8bn in brownfield land funding will be spent in the North and Midlands, with 20 named cities benefiting from a new regeneration programme. Taken together, through levelling up there is a clear policy focus on new housing development outside of London and the South East.
However, it does not automatically follow that increasing house building in less productive areas means reducing development in currently more productive areas. Housing markets are not ‘zero sum’ nor fungible at the national level. One of the main priorities for government is to ease the cost of housing (particularly at a time of rising inflation generally) in high-demand areas, and building more homes is also essential to wider economic growth and labour market flexibility. It is therefore problematic that the White Paper suggests a national balancing act, “by extending opportunity across the UK we can relieve pressures on public services, housing and green fields in the South East”.
The current level of need in the Greater South East is such that there will remain an urgent and significant demand for new housing which is independent of future economic growth in other areas. The best way to sustain growth in the Greater South East is to ensure effective and up-to-date local plans are in place across the area, supplying the homes that are needed to meet the significant backlog of need in the region. Devolution and county deals should be regarded as an opportunity for a new era of strategic plans that can address this issue.
Relevant here, of course, is the wider planning reform agenda. The 2020
Planning for the Future consultation paper had suggested an appetite to overhaul a system that the government labelled as, “inefficient and opaque leading to poor outcomes
[4]”. But these proposals proved unpopular politically, and those planning proposals that do feature in the White Paper indicate a much more modest “tidying up” of the system is now envisaged. This could represent a significant opportunity cost in terms of delivering a more efficient and effective plan-led system, at the very time when new local government structures and devolution is coming forward.
Data sources
[1] The analysis does not take account of housing affordability; therefore many areas in the South East that have acute housing needs, are not highlighted as priority areas for levelling up.
[2] 74% of voters on average in the eight cities electing Mayors in 2021 were aware that their city had a metro-mayor, Centre for Cities and ComRes Polling April 2021.
[3] Planning matters blog, Diminishing returns - The GMSF - A housing perspective
[4] MHCLG 2020, Planning for the Future White Paper Consultation


 View data sources