28 Jun 2022
Introduction
Census results released on 28th June show that after a decade of under-delivery of housing, household sizes have increased across the country, and 600,000 potential households have been ‘lost’. In this Insight Focus we take an initial look at the data, and consider how geography, affordability, and housebuilding might offer an understanding of this imbalance and what it means for communities.
In terms of headline growth the Census shows:
- England’s population grew by 6.6% in the ten years to 2021 to 57.2m. This is lower than the 8.0% growth projected in the 2014-based population projections which underpin local plan-making and the standard methodology for calculating local housing need.
- The number of households also grew, by 1.4m to 23.4m – an increase of just 6.2% compared to 2011. This is also lower than growth projected in the 2014-based household projections which expected household growth to be 10.5% over the decade.
With plan-makers using the 2014-based household projections to plan for their communities and calculate local housing need, today’s results start to give us an indication of how communities across the country have changed over the last decade in comparison to their projections.
The 2014-based household projections estimated there would be 24.4m households in 2021, around 1m more than reported today. 400,000 out of this 1,000,000 shortfall in potential households is due to a lower rate of population growth. This had been expected by the ONS (which revised down its subsequent 2016-based and 2018-based projections) owing to a decrease in international migration, life expectancy and birth rates.
This leaves 600,000 households which have been ‘lost’ in the last decade – referred to as suppressed household formation. In the place of creating new households at the rate expected, that would meet a growing population’s needs, household size has increased (by 0.3%) over the same period rather than decreasing by -2.2% as projected. Although the increase might not appear significant, this reverses a near century-long trend of shrinking household sizes, and is at odds with the fact England continues to be an ageing country where there will be an increasing number of single older people, thus implying a reduced propensity to form households of younger adults.
Table 1 Projected (2014 based) and actual population and household growth, 2011 and 2021
Source: Lichfields analysis of Census
Although average household size has increased nationally, the picture is far from even across the country (Figure 1). London, the wider South East and most major towns and cities across the rest of the country have seen significant increases in their average household size. This is despite the Census being taken when there was thought to have been a temporary – but significant - outflux of residents from towns and cities as many younger people temporarily moved elsewhere during the pandemic. This would suggest that average household sizes today in towns and cities might have risen even more quickly than shown in the data, had the Census not been taken during the pandemic. By contrast, many rural areas (especially outside the wider South East) saw average household size continue to decline.
Figure 1 Change in Average Household Size by Local Authority
Source: Lichfields analysis of Census 2011 and 2021
The regional picture
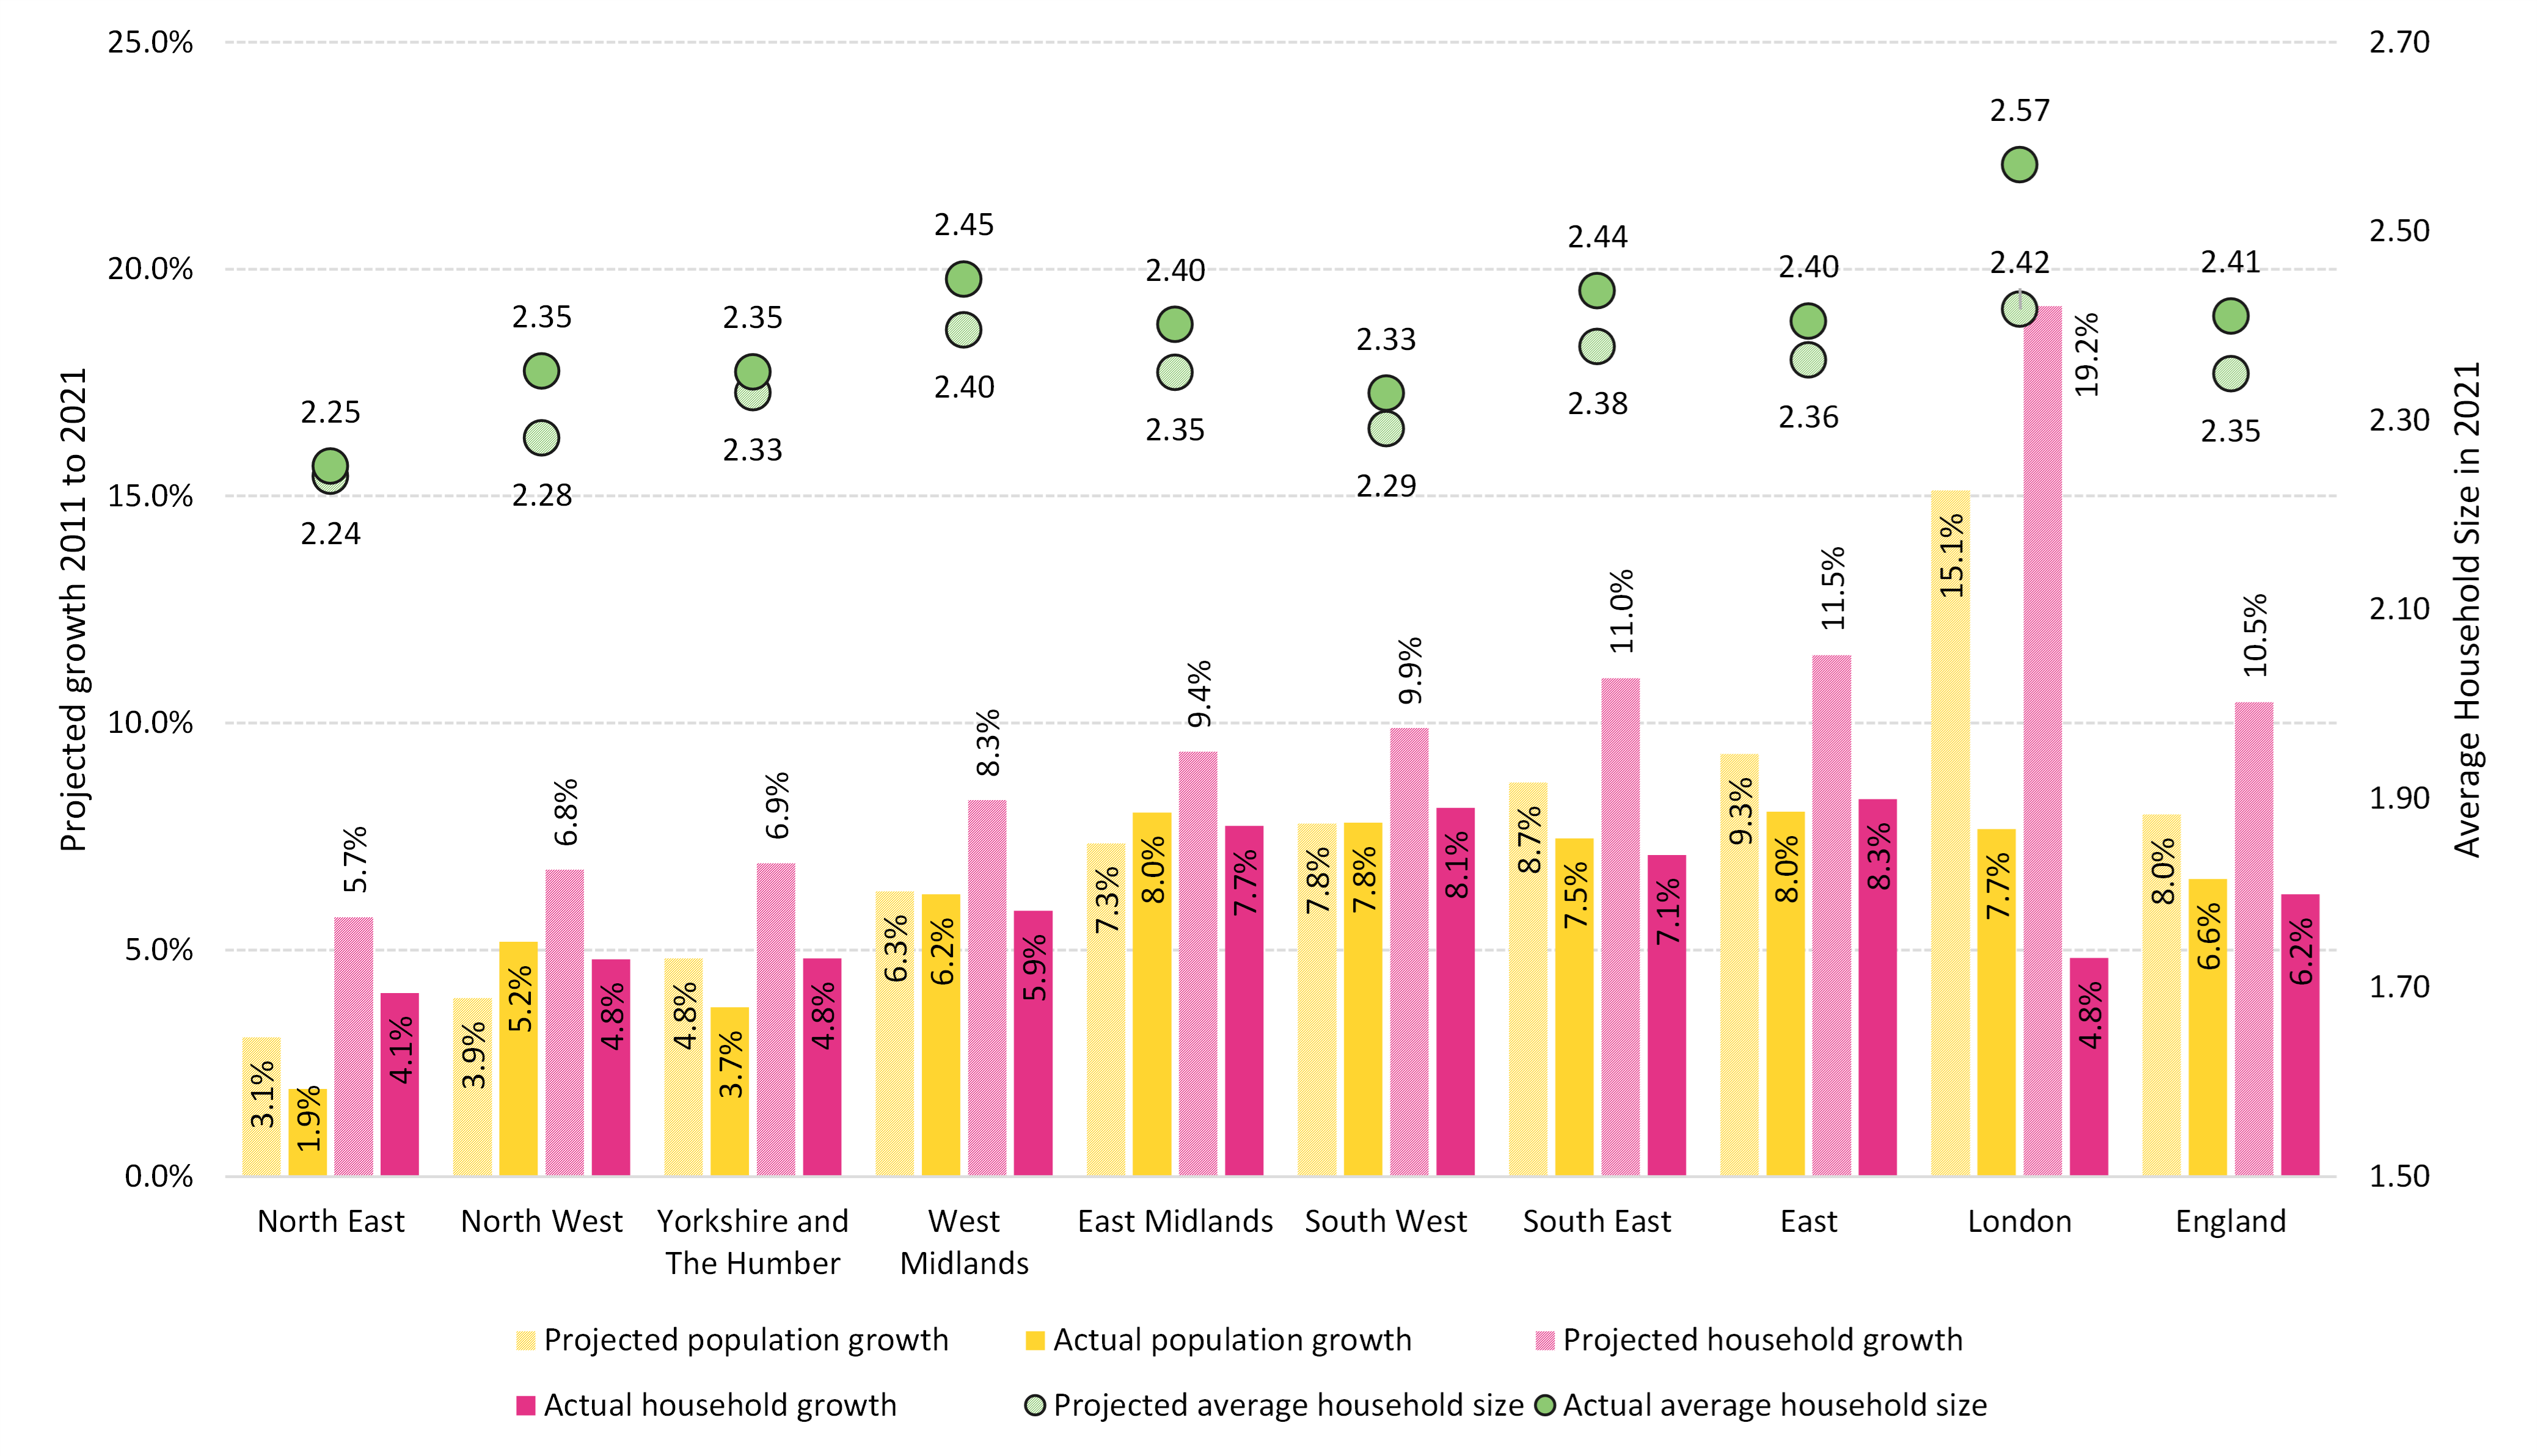
The Census shows that across all regions, household growth has been slower than projected (using the ONS 2014-based projections). Household growth in London was just one-quarter of that projected (5% compared to nearly 20%); the biggest difference of any region and a symptom of the low rate of housing growth relative to its population.
This lower rate of household growth is perhaps unsurprising if seen in the context of plan making. Housing numbers in local plans are supposed to be based on the 2014-based household projections using the standard methodology for calculating local housing need, but local plan making has not been keeping up to date, and it is therefore unsurprising that, across all regions, household growth was lower than the projected figure.
But the picture with population is less clear. In the North West and East Midlands population growth was actually higher than projected, and higher than actual household growth, compounding the increase in average household size in these regions. In the West Midlands and the South West population growth was very closely aligned with where ONS projected it to be in 2021, whilst all other regions saw much lower population growth than anticipated (Figure 2).
Figure 2 Projected vs. actual population and household growth by Region, 2011 and 2021.
Source: Lichfields analysis of Census and ONS 2014-based Population Projections
The link between housebuilding and population growth
Achieving housing delivery takes not only market demand and viable housing sites but also a supportive planning system that allocates sufficient land in local plans to meet need; in areas of high housing demand and where the planning system facilitates it, we would expect to see strong population growth associated with strong housing growth.
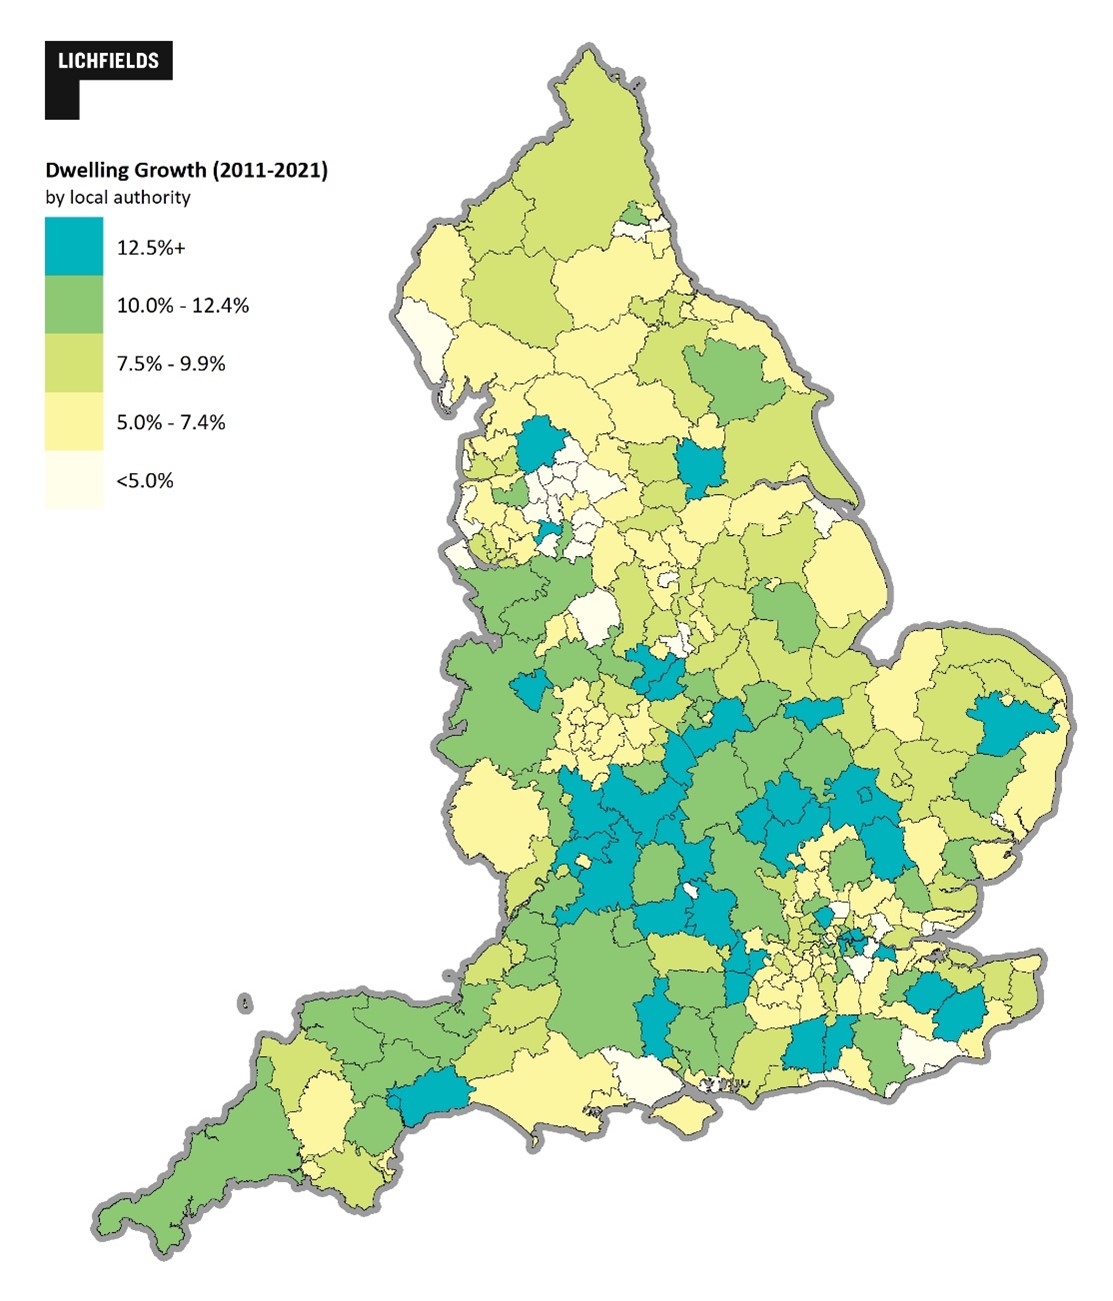
Figure 3 Dwelling Growth 2011 to 2021
Source: Lichfields analysis of DHLUC Live Tables
The Census results show there remains a clear correlation between housing growth and population growth across all housing market areas (HMAs) in all regions. This relationship is clearest in the South where all HMAs saw population growth and this was clearly linked to the rate of housing growth (Figure 4). This relationship does exist but is less strong in the North where slower housebuilding is associated with a wider range of population outcomes – for example both the Copeland and Burnley-Pendle housing market areas saw housing growth of around 4%, yet Copeland’s population declined by 5% whilst Burnley-Pendle’s grew by 8%. In these areas, housing growth is likely linked more closely with land availability and viability rather than in highly constrained, high demand areas in which the level of house building is aligned with the amount of land allocated in local plans based on local housing need.
Figure 4 Projected vs. actual population and household growth by Housing Market Area, 2011 and 2021
Source: Lichfields analysis of Census/MHCLG
Explaining the differences between actual and projected population growth
The Census has shown that, across most areas, the population in 2021 has been different – higher or lower – than it was projected to be. We have had an initial look - at a high level - at whether these differences can be explained by patterns of housing growth.
In almost all parts of the South where population growth exceeded (or was very close to) projections, this growth was supported by a rate of housing growth that was close to, or above, the national average. These authorities are typically areas less affected by planning constraints, with up-to-date local plans and located beyond the Metropolitan Green Belt – places like Bedford, Oxfordshire, North West Sussex, Milton Keynes and parts of Hampshire (Table 2).
The opposite is also true; areas where the population was lower than the projected figure are typically areas where housing growth has been below the national average. These market areas are typically subject to significant planning constraints (including those in the Metropolitan Green Belt) where plan-making, joint-working and housing delivery have often faced difficulties. These include significant parts of Sussex, Hertfordshire and Surrey, often areas already facing housing shortages, acute affordability problems and where affordability has continued to worsen faster than the national average.
This suggests that housing delivery – or a lack thereof - has had a real impact on population growth and household formation in these areas. It follows that planning constraints (both in terms of Green Belt land and out of date local plans) – through their effect on planned housing numbers – have also affected household formation and population growth in these areas relative to their projected outcomes.
Table 2 Top/Bottom 5 housing market areas in the South difference in actual vs. projected growth and rate of housing growth


Source: Lichfields analysis of Census / DHLUC
The picture is similar in the Midlands and North; many areas where the Census shows a higher population in 2021 compared with what was projected are those where housing growth was above the national average (Table 3). However, there are some areas in these regions exceeded their population growth projections despite seeing notably low rates of housing growth, illustrating the flexibility that can also exist between population and housing growth in less strong markets.
Table 3 Top/Bottom 5 housing market areas in the Midlands and North difference in actual vs. projected growth and rate of housing growth
Source: Lichfields analysis of Census / DHLUC
Plan-makers in some areas have awaited the Census results with anticipation, given what the results might imply for the assessment of housing need, especially in areas where the accuracy of ONS’s mid-year population estimates have been questioned. For example, as part of its local plan preparations in recent years Coventry Council has repeatedly raised issue with ONS regarding the accuracy of its population estimates and projections, which the Council consider as significantly over-estimating housing need in the city. The Census shows that despite Coventry having one of the highest rates of housing growth in the Midlands and North between 2011 and 2021 (10.5% - well above the national average of 8.3%) its population growth was actually lower than expected.
Whilst some commentators might conclude that this supports the idea that less housing is needed, it is notable that this higher level of housing supply relative to its population growth has coincided with Coventry seeing only a modest worsening of its affordability ratio in the last decade, with a much lower increase in its affordability ratio than most of its neighbours. It might be suggested that this is the kind of outcome envisaged by the concept underpinning the standard method, a relatively high level of housing supply at a local level relative to its growth in population has coincided with a moderation of house price growth, meaning that Coventry today remains a relatively more affordable housing market for those on typical incomes seeking market housing.
Maintaining vibrant communities
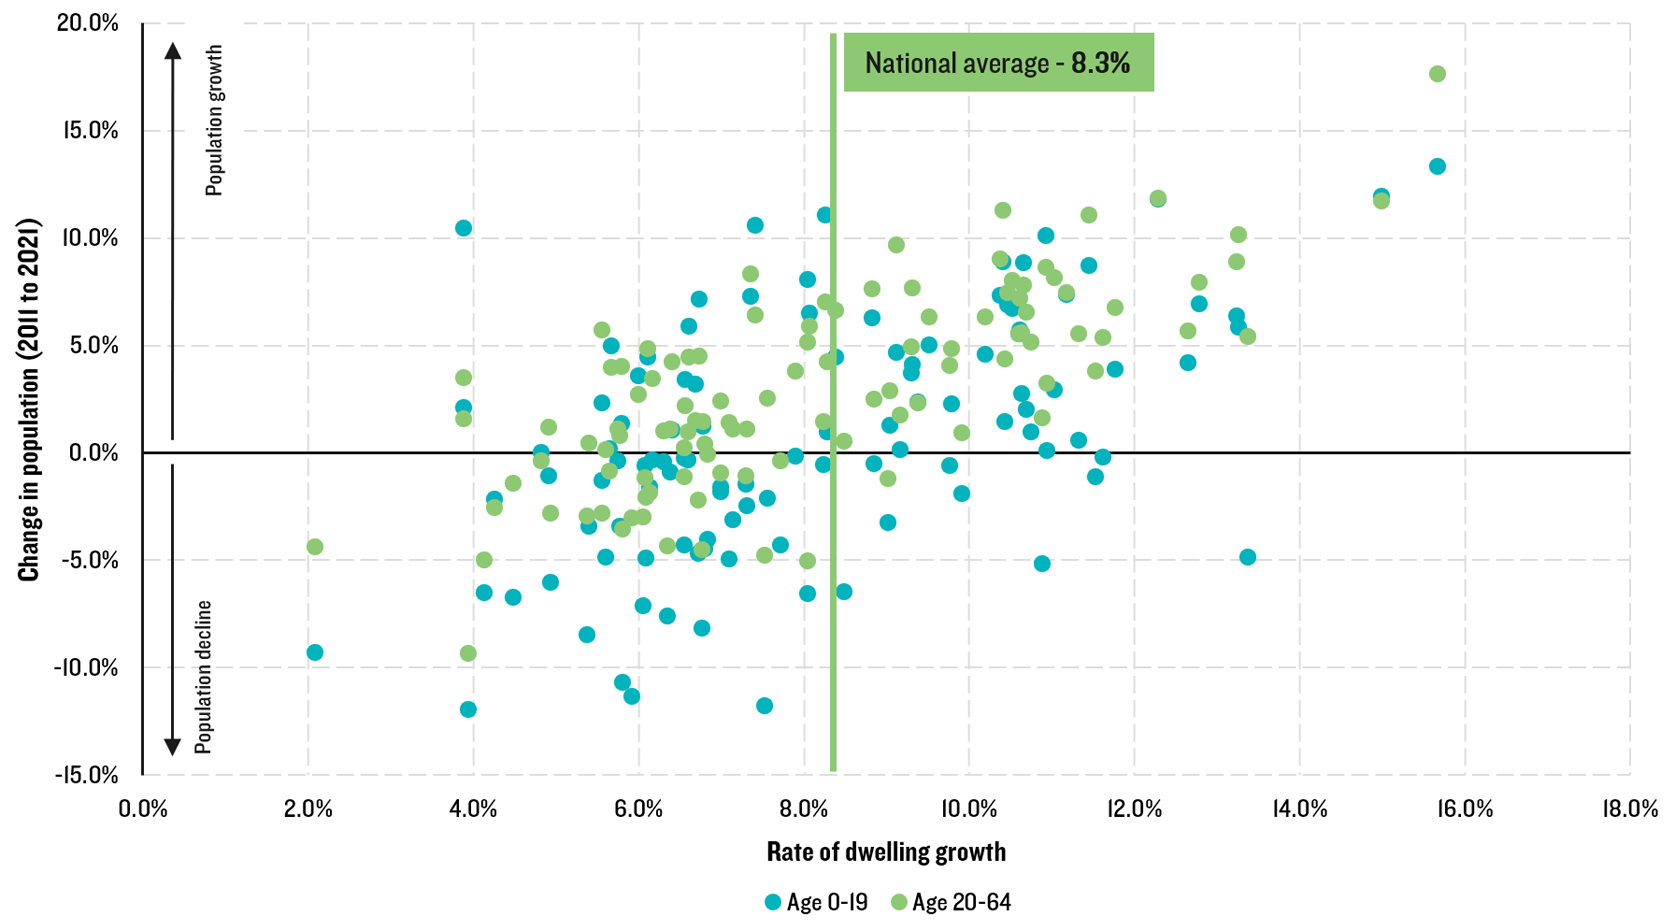
We have already highlighted the importance housing plays in supporting population growth, but this is even more so when supporting growth in the working age population and the number children. Sustaining or growing these groups of the population is a key component in maintaining vibrant communities (for example, in supplying local workers to provide health and other care service for the elderly population) and supporting its economy. The Census shows that all HMAs (bar one) which delivered housing growth at or above the national average saw their working age population grow over the last 10 years (Figure 5). This highlights the key role that housing growth plays in attracting and maintaining a workforce, which in turn also helps support local economies and sustainable commuting patterns. The vast majority of these areas also saw the number of children grow, demonstrating the key role new housing plays in attracting families and in turn ensuring that social infrastructure, notably schools, remain viable within individual towns and villages.
Figure 5 Change in Population 2011-2021 by age groupings: Working Age and Children
Source: Lichfields analysis of Census / DHLUC
Conversely, HMAs where the rate of housing growth was lower than the national average typically saw a decline in the number of children; this is logical given that the supply of additional housing stock (either for families, or for those looking to downsize and thereby free up existing family homes) is important to support household formation and/or for new families to move into an area. The English Housing Survey shows that older people are typically more satisfied with their homes and less likely to move, so new housing can be crucial in enabling churn in local markets and would allow new, younger residents (including families) to secure their own home. Without it, an existing market can enter a cycle of demographic decline. The potential of decline is compounded by affordability, which typically worsens where housing growth fails to meet demand, pricing out newly forming households and young families. Absent housing choices, people may move elsewhere within the HMA to a location where they can continue to commute to their place of work, they may move away entirely, or in some cases do not form new households or start or growth their families because they lack the space to bring up children.
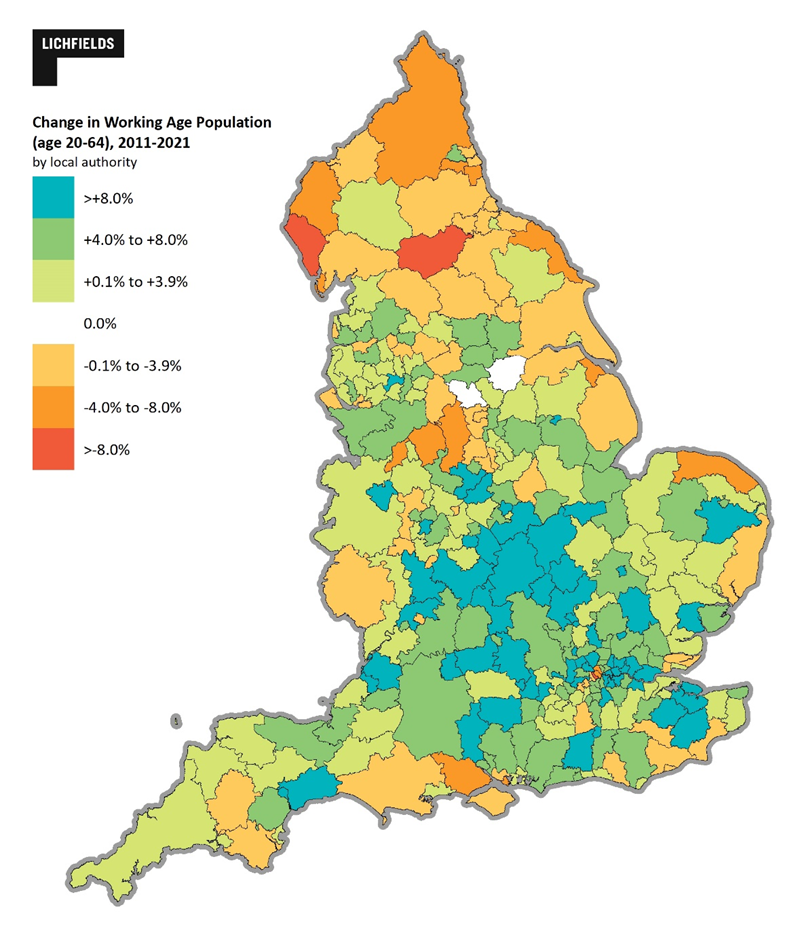
For working age residents, the picture for areas with slower housing growth is less clear. Around half of HMAs have been able to continue to grow their working age population despite relatively slow housing growth; albeit more slowly than areas of higher housing growth. A continued shortage of housing options is likely to see a more rapidly ageing workforce and these areas might soon see their working age population declining or at least the dependency ratio worsen (typically expressed as the proportion of those in the labour force vs those who are retired/children) which suggests pressure on the ability of local economies to sustain the education and care needs of their population alongside a sustainable wider economy. The remaining HMAs are already seeing their working age population decline; in some cases this will be for economic reasons - a lack of employment opportunities, for example; but in others it may be a lack of good or affordable housing options which make it more difficult (or less attractive) for people to move to or remain in the area. The geography of the changing working age population shows growth in areas with significant job opportunities or in areas where housing growth has been significant, and demand remains high (certain parts of the Midlands) this is shown in Figure 6.
Figure 6 Change in Working Age Population
Source: Lichfields analysis of Census
Concluding thoughts
Those with an interest in planning for housing have taken a keen interest in the latest Census results due to its potential implications for population estimates, household projections and housing need. There will be speculation as to what they mean in practice. We would caution against a simplistic interpretation of national-level figures (for example, comparing housing stock growth vs household growth at a national level) which will ignore the reality that England is a country of multiple HMAs with different economic and housing dynamics. For example, strong housing growth compared to population growth in Coventry (which may well be responsible for moderating affordability pressures on households in that city) does nothing to help young families secure market housing in Hertfordshire, where affordability has worsened considerably. Equally, the increase in the number of second homes in coastal or tourism areas (with lower consequential increase in households) tells us nothing about the ability of households to form in London. Correlation is not automatically causation, but nor should we pretend that the differential rates of housing delivery in different HMAs will not have impacted on access to housing and thus the rates of population and household change in those areas. Further, Census results should be treated with some care given they were measured during an unprecedented snapshot in time: a period of the Covid-19 pandemic when restrictions were in place.
Whilst lower population growth than anticipated nationally might suggest to some that the ambition for housing growth can be reduced, the Government has repeatedly signalled its intention to maintain ambitious 300K housing growth targets owing to its desire to address under-delivery of housing that now dates back decades. The economic affects of the national labour shortage are recognised, but we can also see the localised impacts as individual businesses and public sector organisations struggle to recruit key workers at all levels, including in the sectors responsible for educating children, caring for the sick and elderly, and sustaining other vital services. Local housing supply can be part of the solution to these problems. That has to be part of the matrix for local policy makers in deciding how to interpret these Census results.
We await the Government's proposals for the latest reform to its policy for housing, including what, if anything, is proposed for the Standard Method for local housing need and how Government expects local plans to address this need. The Census is clearly relevant to understanding the relationship between population growth and housing delivery, and the implications of this on the ability of households to form in different areas. The demographic data should rightly be part of policy-makers' thinking, but must sit alongside other factors, including market signals. It would be easy to adopt logical fallacies and draw the wrong conclusions from the Census; despite the political fervour following a succession of electoral defeats where planning has been a factor, our analysis suggests Government's interpretation should be smart, careful, and spatially attentive.
Data tables
[1] North East, North West and Yorkshire
[2] East Midlands, West Midlands and East
[3] London, South East and South West
Disclaimer
This publication has been written in general terms and cannot be relied on to cover specific situations. We recommend that you obtain professional advice before acting or refraining from acting on any of the contents of this publication. Lichfields accepts no duty of care or liability for any loss occasioned to any person acting or refraining from acting as a result of any material in this publication. Lichfields is the trading name of Nathaniel Lichfield & Partners Limited. Registered in England, no.2778116
Image credit: Mike B via Pexels