Delivery of affordable housing in Wales
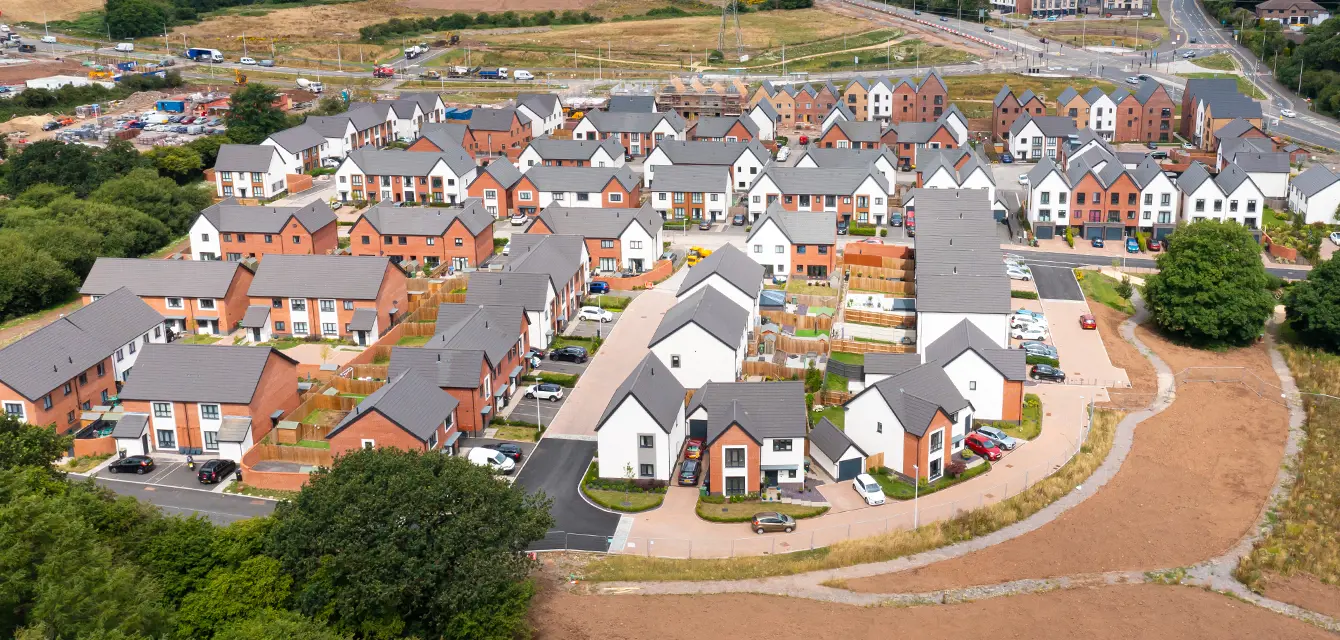
Housing delivery in Wales
The rate of housing delivery in Wales has slowed significantly over the last twenty years with the number of dwellings completed in 2023-24 being 42.7% lower than in 2003-04 (see Figure 3). Completion rates for affordable housing only extend back to 2008-09, but Figure 5 shows that the rate of affordable housing delivery has increased since this point in time (by 51.9%, whereas total housing delivery declined by 18.8% over the same period)
[5].
Figure 3 Total housing completions in Wales from 2000-01 to 2023-24
Source: StatsWales: New dwellings completed by period and tenure
StatsWales and Welsh Government publications presents affordable housing provided per annum as the total number of affordable houses that are delivered. However, analysing affordable housing provision by provider or S106 contributions reveals that over the period from 2020-2023, new builds have accounted for just 61.8% of net additional affordable housing, with the remaining 38.2% comprising acquisitions – this is shown in Figure 4. Whilst it is normal for acquisitions to comprise a form of affordable provision, the way that this data is presented by Welsh Government is somewhat misleading as publications indicate that affordable housing delivery accounts for almost half of all new build houses delivered, though in fact, these figures include acquisitions. This approach therefore changes the tenure of existing dwellings but does not contribute to increasing the overall housing stock.
Figure 4 Affordable housing provision and by acquisition
Source: StatsWales: New dwellings completed by period and tenure & Provision of affordable housing through planning obligations and on exception sites by authority, measure and planning type
Figure 5 shows the proportion that affordable housing (new build only) has accounted for completions. It shows that affordable housing increasingly accounts for a higher proportion of all completions, but that this remains below the 48% need established in Future Wales. The exception to this is in 2020-21 where affordable housing completions accounted for 46.3% of all completions – this change was driven by volume housebuilders being harder hit by the impacts of Covid-19.
Figure 5 Total and affordable housing completions from 2008-09 to 2022-23
Source: StatsWales: New dwellings completed by period and tenure & Provision of affordable housing through planning obligations and on exception sites by authority, measure and planning type
Considering these completion figures in the context of the need established in Future Wales (noting Lichfields’ concerns in the different approaches in identifying affordable and market housing need at paragraph 2.4), Figure 6 shows the extent to which affordable housing delivery levels remain below the identified need. Whilst the rate of affordable housing delivery has fluctuated, it has been relatively consistent and the average rate of delivery over the four years has been 54.6% lower than the need for 3,500 affordable homes per annum identified in Future Wales. By contrast, deducting affordable housing delivery from total indicates that market housing delivery rates have been 41.3% below the need identified in Future Wales over the four-year period.
This highlights the extent of the under-delivery of housing across tenures and raises questions surrounding the success of the policy approach introduced by Welsh Government to increase affordable housing delivery. In terms of delivery against their target for 20,000 low carbon social rent homes, 3,823 affordable homes were delivered from 2021-2023 – a shortfall of 61.8% to date (data confirming whether these were low carbon homes is not available).
Figure 6 Total and affordable need estimated by Central Estimates in Future Wales against actual delivery rates
Source: StatsWales New dwellings completed by period and tenure 2023 & Future Wales 2040
Figure 7 shows total housing delivery by provider. It shows that the number of dwellings delivered by LPAs from 2000-01 to 2022-23 has increased in line with overall delivery rates, but that they account for a very low proportion of this figure. Considering average delivery rates since 2008-09 (i.e., the earliest point that StatsWales provides data on affordable housing completion figures), our analysis shows that:
- Registered Social Landlord (RSLs) have delivered 56.5% of affordable houses;
- Private enterprises have delivered 41.4% of affordable houses; and,
- Local authorities have delivered 2.2% of all affordable houses.
This degree of variation shows that RSLs contribute the greatest level of affordable housing, but also underlines the contribution of private enterprises in delivering affordable housing. In the light of this and against the context of market constraints and lower values that are discussed later in this piece, it is evident that increasing the requirement of affordable housing delivery as proportion of overall housing would not necessarily address the shortage of affordable housing. In this context, increasing the rate of overall housing delivery rather than focusing on affordable housing as a proportion of market housing would:
-
Enable private enterprises to increase their delivery of affordable housing; and,
-
Address the key contributor to the housing crisis: a shortage of housing.
Figure 7 Housing delivery – total and by provider – from 2001-01 to 2022-23
Source: StatsWales: New dwellings completed by period and tenure & Provision of affordable housing through planning obligations and on exception sites by authority, measure and planning type
Comparing housing delivery across the UK
The above analysis shows that the rate of affordable housing delivery in Wales is lower than market housing and, than the need identified in Future Wales. To show the true extent the under-delivery of housing in Wales, we have sought to compare net additional delivery rates with those in England and Scotland.
This is a helpful exercise as comparisons cannot be drawn in respect of total delivery rates because of the very different size of the populations, and because of differences in how data is recorded. StatsWales data shows dwelling completions and demolitions, but it does not record change of uses or conversions whereas English Live Table data shows net additional dwellings and data from Scotland shows the total dwelling stock and total completions, enabling calculation of net additional dwellings. We note that data on demolitions was not recorded in Wales in 2019/20 due to Covid-19 and so completions are taken as a proxy for net additional in that year.
Figure 8 shows that housing delivery as a proportion of the existing housing stock has consistently been considerably lower in Wales than in England and Scotland. Whilst direct comparisons of the net additional affordable dwellings cannot be drawn because of how data is presented, it is clear that overall housing delivery (and therefore likely affordable housing delivery) has lagged behind that of other parts of the UK. This point is not made to draw direct comparisons, but to query whether the approach to tackling the housing crisis and increasing the delivery of all types of housing, is working effectively.
Figure 8 Recorded completions (Wales) and Net additional (England & Scotland) total dwellings as proportion of relevanthousing stocks between 2011-12 and 2021-22
Source: StatsWales: New dwellings completed by period and tenure, Live Tables 100 & 122 and ScotlandGovernment Housing statistics: Stock by tenure & Quarterly housing statistics June 2024