Local elections were held across the majority of England outside London on the 4
th of May. Much of the media coverage at the time centred on the momentum shift; indeed, of the 230 authorities that had an election, around a third (77) of councils changed overall control
[1]. A month on, we look at what the results mean for plan-making, specifically what were the changes in areas with out-of-date local plans, and in areas where local planning authorities that have paused or are at risk of pausing plan-making.
These local elections have come at a time where plan-making has slowed to a glacial pace, and more than half of authorities are without an up-to-date local plan. Moreover, with national housing policy back at the fore in the past months as the Conservatives put forward
proposed changes to the NPPF [2] and Labour pledged to re-instate mandatory housing targets
[3] if they win the next general election, it may well be that plan-making and housing become even more important battlegrounds for winning voters.
How did the local elections affect areas with no local plan?
151 (66%) of the 230 local authorities that had an election do not have an up-to-date local plan. Of these, just under a third (50) saw a change in overall control.
36% of authorities in South West and the South East experienced a change in overall control, which is only slightly higher than the national average.
For those with out-of-date local plans, however, the proportion is much higher. 50% of the authorities in the South West that had an election changed overall control, and 38% in the South East. In the East of England, it was 35%. It should be noted that these regions already play host to a disproportionately high number of the English authorities with no up-to-date local plan.

There has been some indication and speculation that this local political change is due to housing and planning policy
[4] [5] [6] specifically contentious local plans. In fact, of the 50 authorities without an up-to-date local plan and where there was a change in control, 46% (23 authorities) have significant constraints on their land availability
[7] - a likely signifier of contentious land supply decisions - compared to a national average of 34%
[8]. Of these 23, 14 (61%) are in either the South East, South West or East of England. This could be interpreted as supporting the housing and planning policy narrative, although as always, a plethora of issues might have influenced individual voter considerations.
What might be the implications for plan-making of a change in control?
The implications for plan making in areas where there has been a change in political control aren’t immediately apparent. In some authorities that are mid-way through the local plan process, we might expect there to be some disruption with new parties and leaders having different priorities. In others, new political figures might have been elected on housing and planning related platforms, and will therefore look to either press on, or hold back plan-making, depending on their electoral pledges.

Political instability and the shifting policies from Whitehall have contributed to a hiatus in plan-making. This has contributed to 53% of English local authorities (177) having not adopted a plan within the last five years. As well as this, over a third of English councils cannot show a five-year housing land supply
[9]. Lichfields estimate that policy uncertainty has led to 38 authorities pausing plan making (
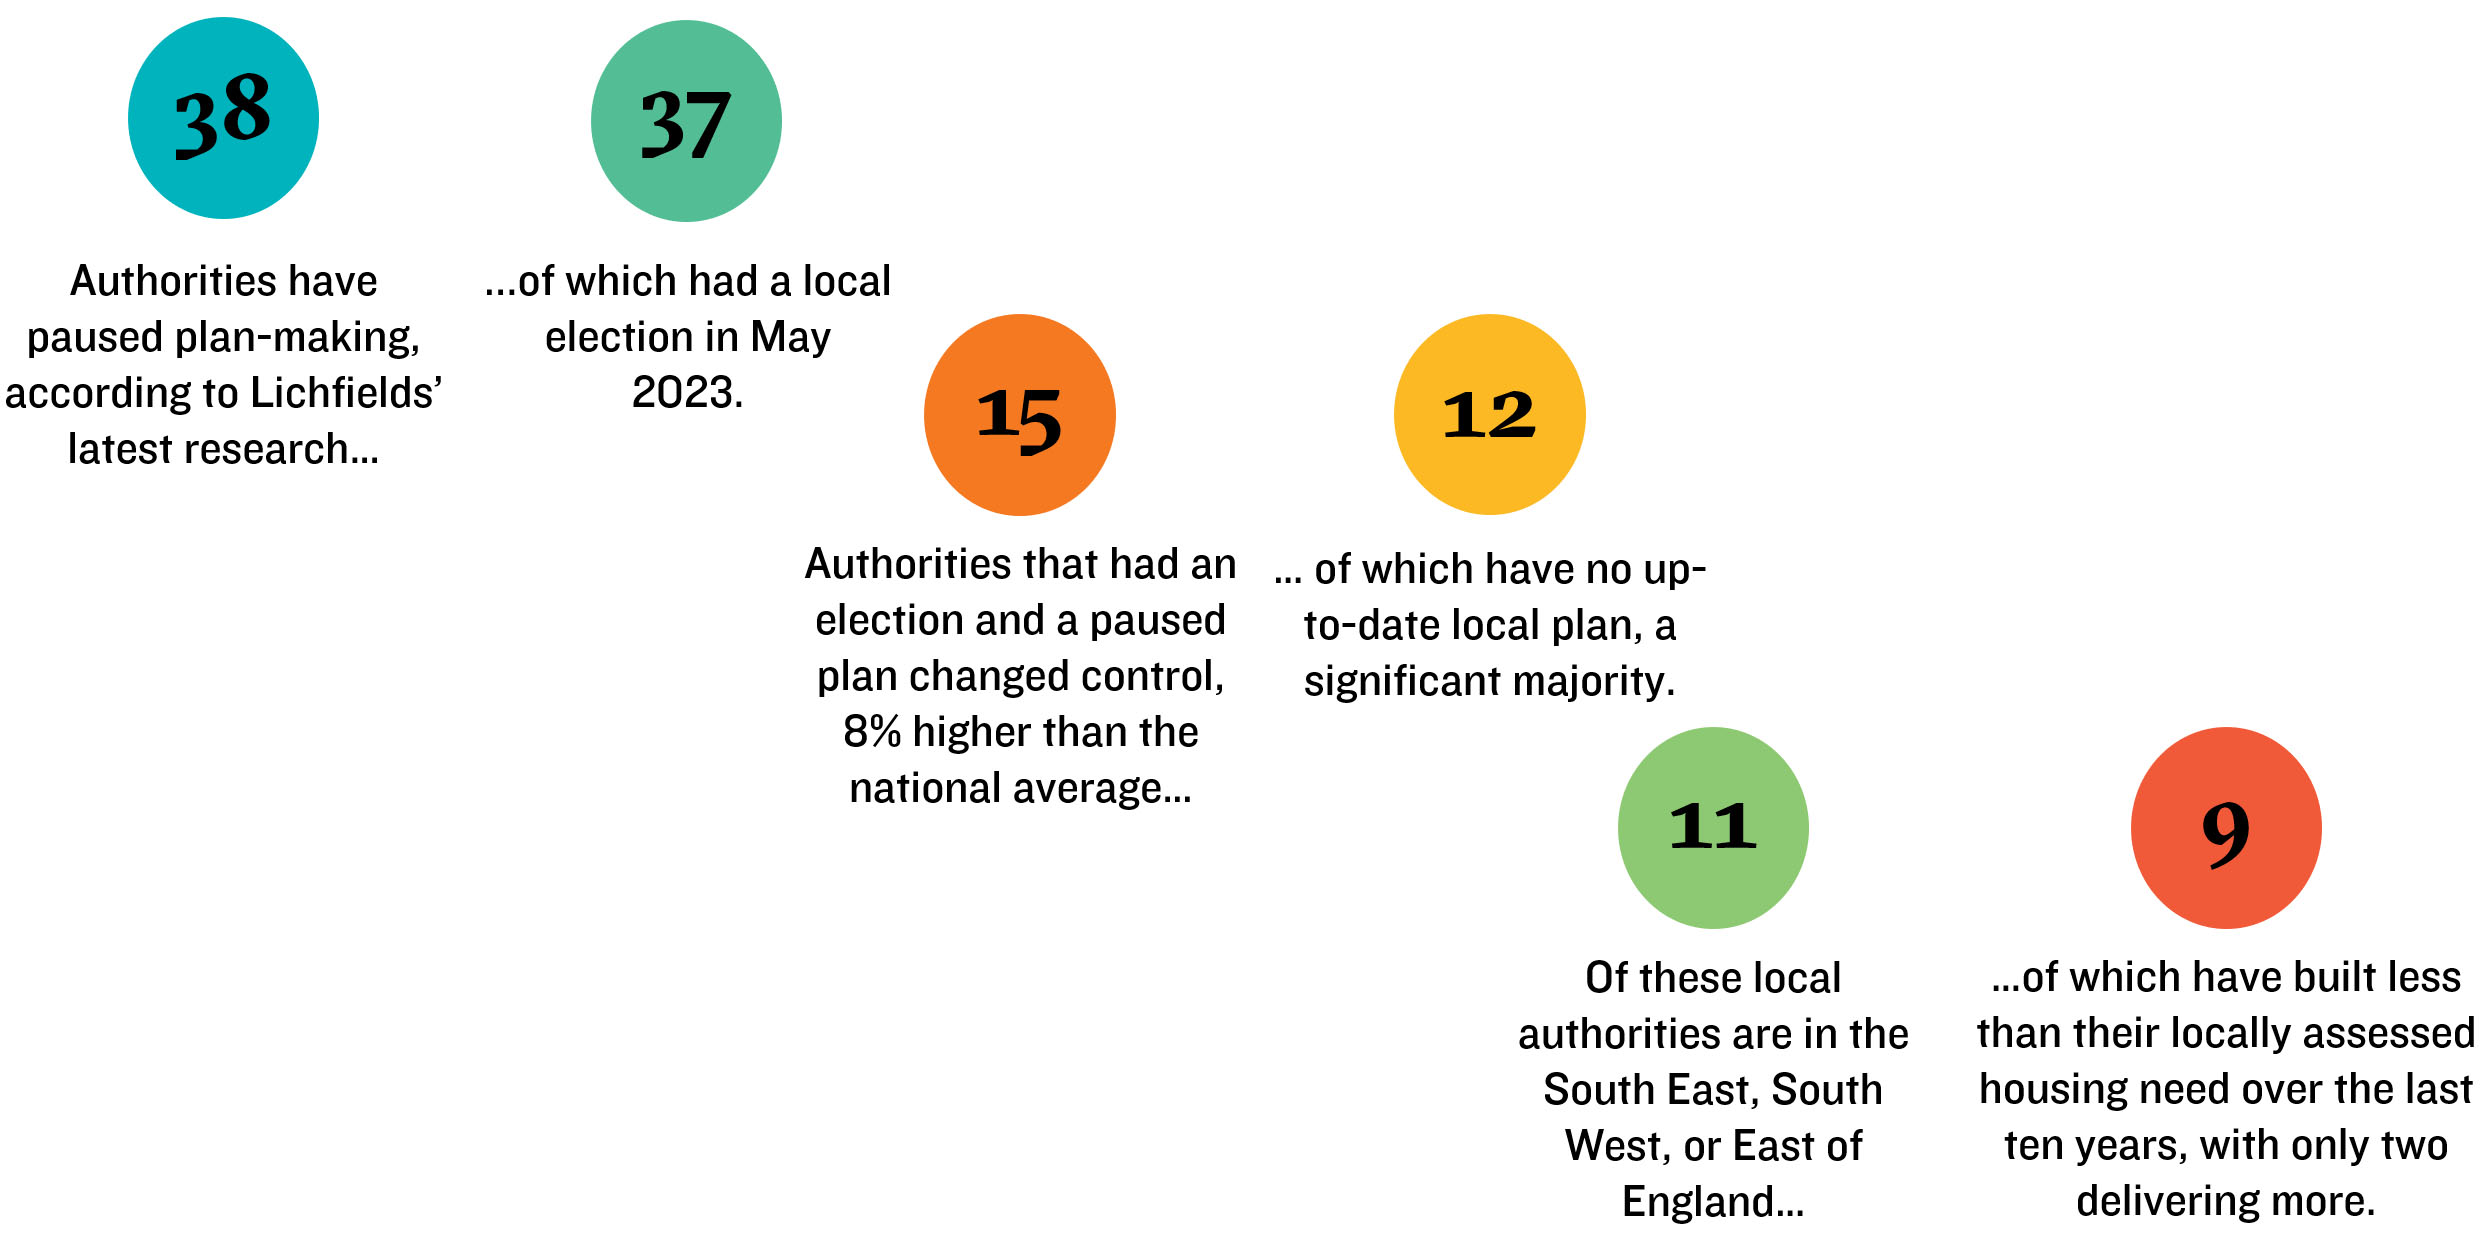
see our recent Blog on ‘The State of Local Plan-Making’), of which all but one had an election. 15 of these authorities changed control, all of which have higher than average land constraints.
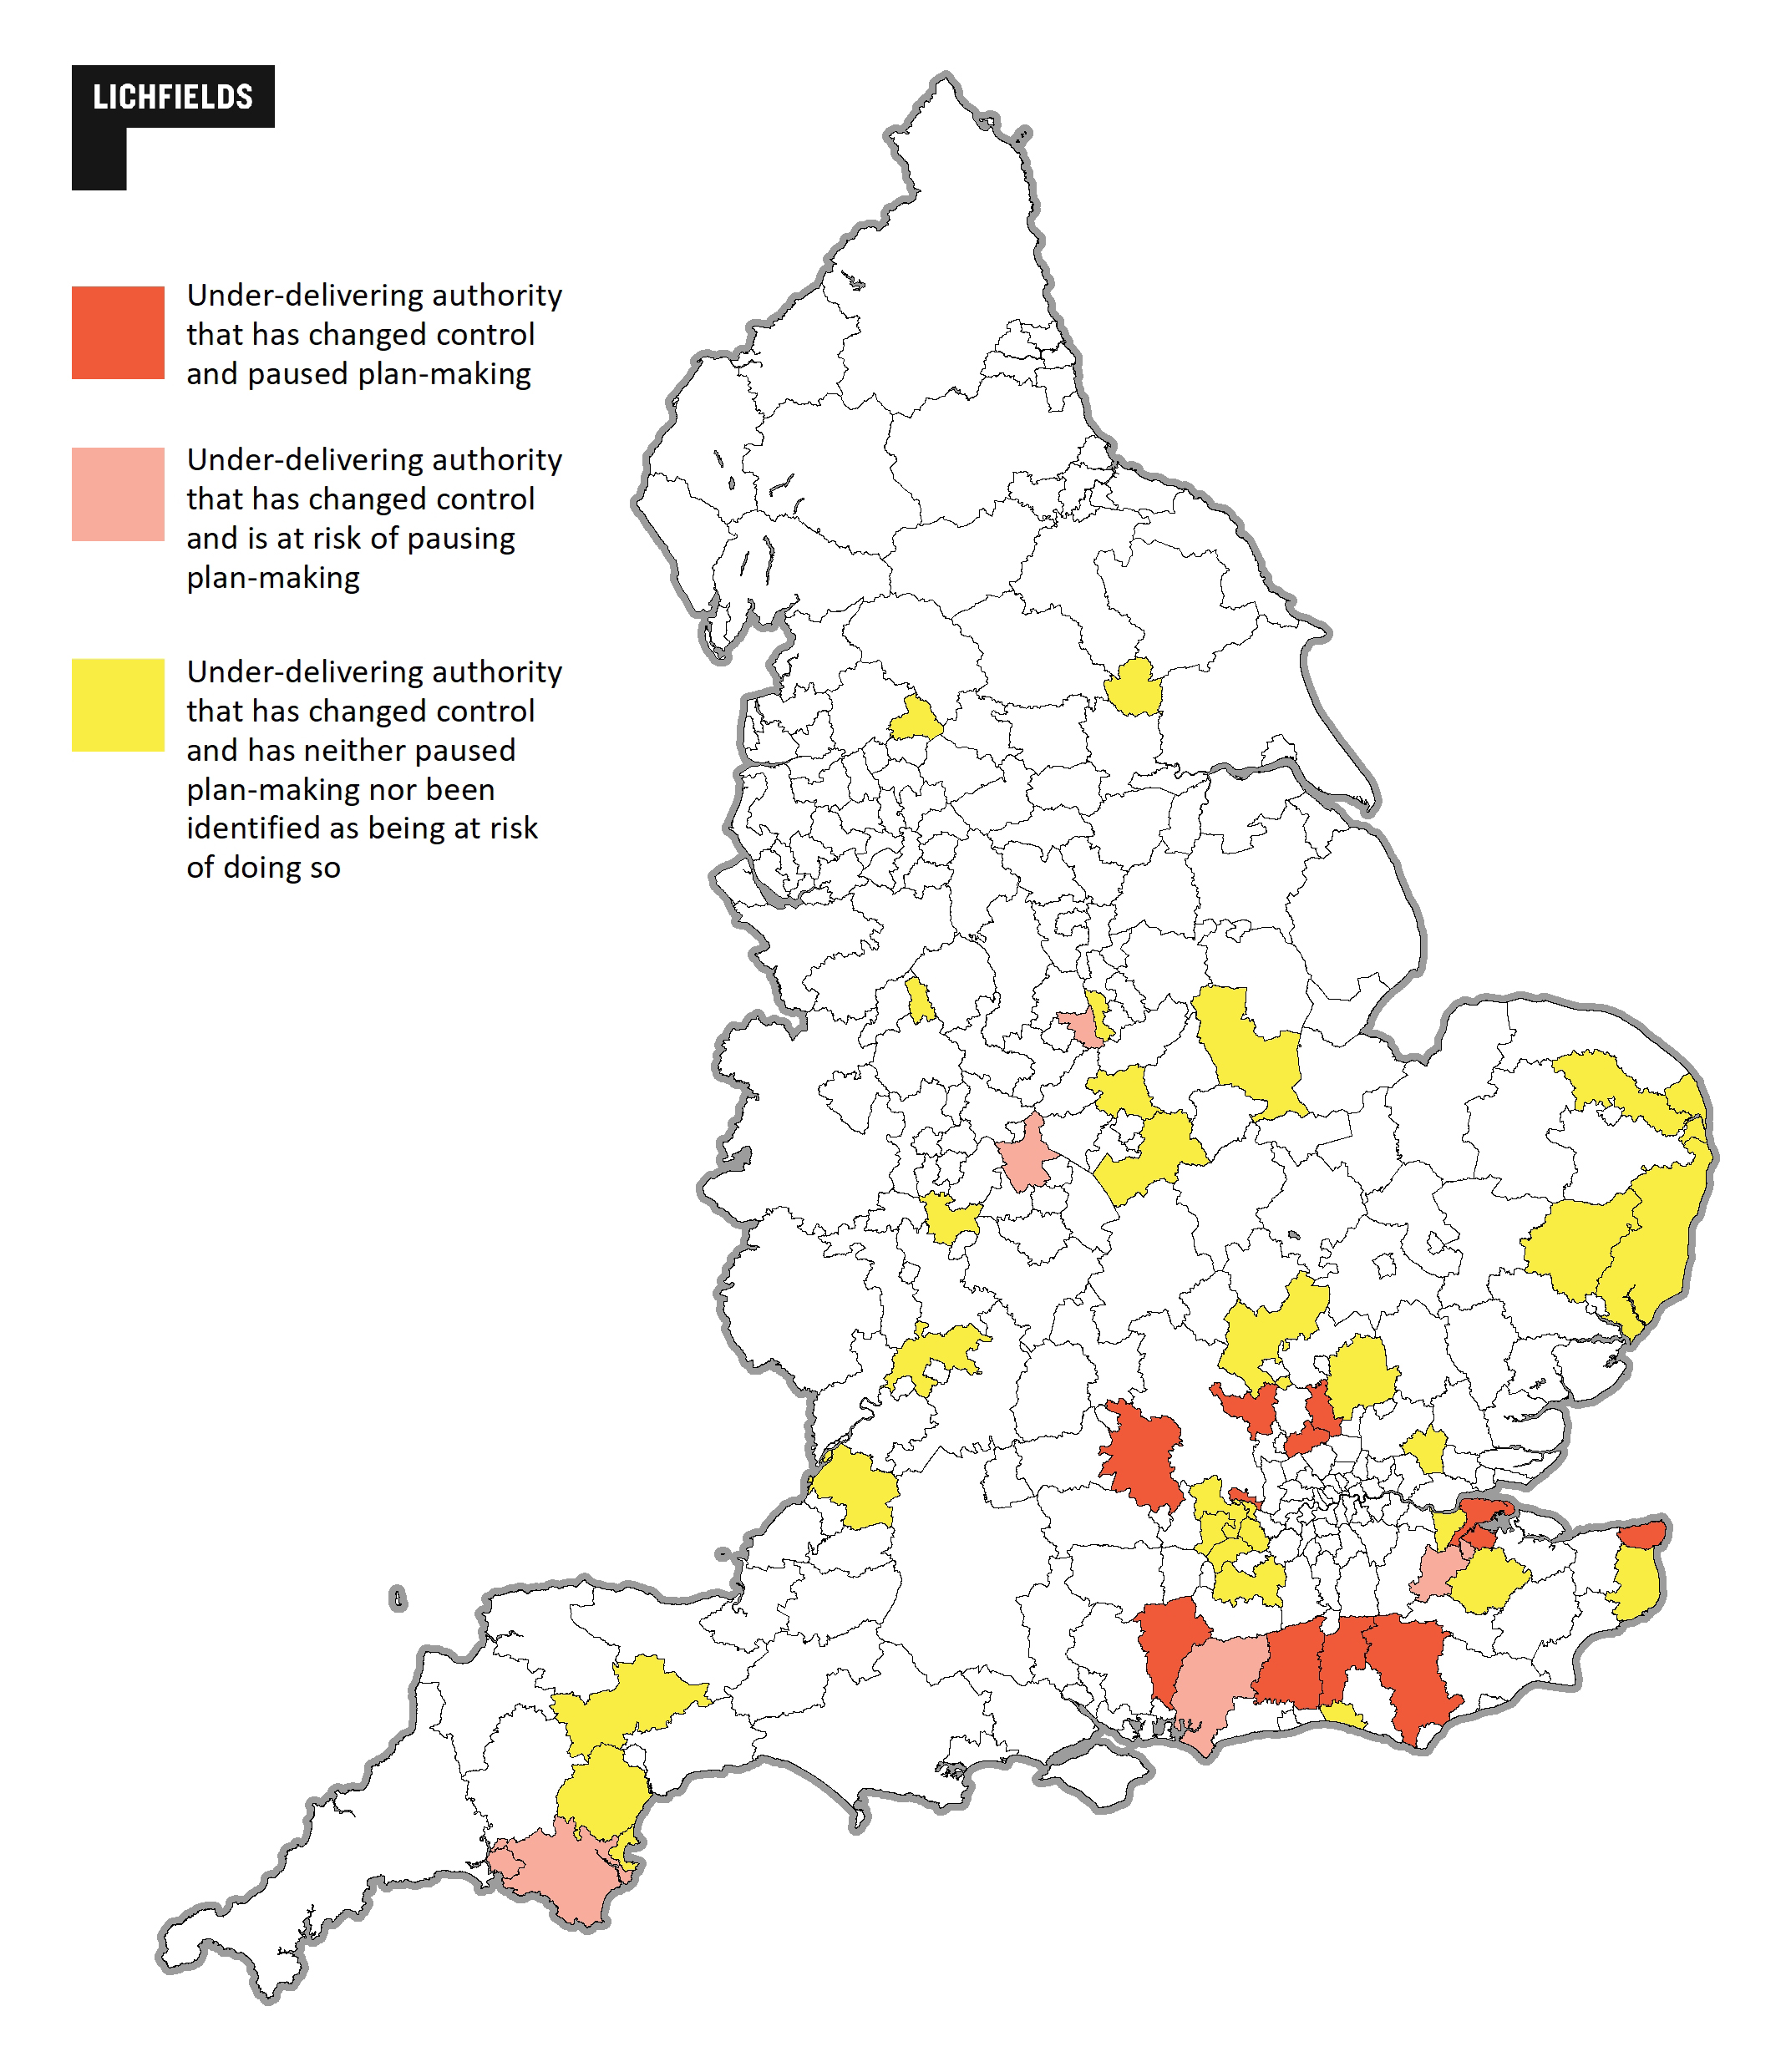
In addition to the 38 authorities that have paused plan-making, our research finds there are 52 more that are at risk of pausing plan-making at the moment. 63 of these 90 authorities that have paused plan-making or are at risk of doing so had elections, and 25 changed control. 16 of these have under-delivered on their housing need over the past 10 years.
Note: an under-delivering authority is one that has delivered, on average, less than their objectively assessed housing need over the past ten years.
Conclusion
In conclusion, for a plan led system to deliver the homes the country needs, we continue to require local authorities – whatever their political control – to provide to date local plans that meet local needs and priorities. The slow pace of local plan making, combined with political uncertainty has led to many areas pausing or pulling their emerging local plans. The recent local elections have shifted the political control in many areas, the extent to which this leads to more pro-active plan making, or conversely, where the stasis continues, is as yet unclear.
[1] A change in overall control in this article means that the party in overall control has changed, that a council previously under no overall control has come to be under overall control, or that a council previously under overall control has come to be under no overall control.
[2] See Jennie Baker’s Blog for a summary https://lichfields.uk/blog/2023/january/2/what-s-lurb-got-to-do-with-it-the-rebel-pleasing-nppf-consultation/
[3] https://www.thetimes.co.uk/article/starmers-growth-plan-is-built-on-houses-79jq7mz6r
[4] https://www.mirror.co.uk/news/politics/rishi-sunaks-housing-blunder-cost-29922376 /
[5] https://www.hertfordshiremercury.co.uk/news/hertfordshire-news/local-elections-2023-green-belt-8403321
[6] https://www.housingtoday.co.uk/news/senior-conservatives-turn-on-leadership-over-housing-after-election-drubbing/5123070.article
[7] Meaning above half of land constrained by green belt or footnote 7 constraints.
[8] DLUHC Land Use Data, 2022
1. Green belt statistics
2. National Planning Policy Framework
[9] https://www.gov.uk/government/statistical-data-sets/live-tables-on-house-building
[10] https://lichfields.uk/blog/2023/april/20/failing-to-plan-or-planning-to-fail-the-state-of-local-plan-making/


