Planning matters

Our award winning blog gives a fresh perspective on the latest trends in planning and development.

Making a bad situation worse? How a fall in housing supply due to NPPF changes will cause social harm and undermine levelling up
The Government is currently consulting on proposals to make changes to the NPPF[1], much of it focused on how Local Plans go about addressing housing needs and on the measures that apply to maintaining a supply of housing.
Recent rate of housing delivery has seen around 233k net additional homes provided in England annually. Although the Government has re-stated its commitment to increase this to 300,000 homes per annum, analysis prepared by Lichfields for the HBF and LPDF concludes that the NPPF changes are more likely to have the opposite effect, with a drop of 77k per annum taking supply down to around just half the Government’s target. This is before accounting for the restrictions on house building caused by water and nutrient neutrality ruling, which are currently holding up over 100,000 homes.
Our previous blog explains why the specific provisions in the draft policy will reduce the number of homes being planned for, make it more difficult for unmet need to be addressed elsewhere and remove or dilute the obligations on local authorities to maintain a five year housing land supply or respond to past under-delivery. It also explained how reduced housebuilding will hit the economy to the tune of £34bn of GVA and 386k jobs. There will be consequential reductions in tax revenue.
In this blog we explore some of the potential social impacts of the proposed changes, notably how the fall in supply compounds the symptoms and consequences of the current housing crisis.
We already have too few homes to house our current population; a conservative estimate is that there around 1.6m ‘concealed households’ that are pushed into sharing homes or are ‘sofa surfing’, unable to move in to a home of their own[2]. Vacancy rates in England are also low, with fewer empty properties than would be typically expected in a functioning housing market[3]. Looked at from that perspective, we are 2.1m homes short of what is needed to accommodate our current population. 
That England is ‘under-housed’ is readily apparent if one looks elsewhere in Europe. We would need to build 2.4 million extra homes to match the average number of homes per capita of the Netherlands, Germany, Denmark or Belgium[4]. Even after second homes and derelict stock are accounted for, we fall well over 2 million homes short of housing our current population, and this will be compounded if we do not build enough homes to match the projected growth in the number of households.
Since the Government set its ambition for 300,000 homes per annum, the rate of housing delivery has been undershooting by some margin, and if current rates were maintained, the shortfall would be 0.75m short by 2030.
The proposed NPPF amendments seem likely to make this bad situation even worse, leading to building just half the 300k the Government says are needed each year. Given the water and nutrient neutrality barriers to housing delivery already holding back housing delivery, the 77k drop in output is a best case; it is quite likely the cut will be deeper.
 

What impacts would a fall in housing supply have on society?

Lichfields has drawn upon existing research and datasets to model potential outcomes. One key input to the analysis is the OBR’s approach to forecasting house prices[5] and its assessment of house price elasticities drawn from the literature. This can be used to flex what might happen to house prices under different supply-based scenarios, taking into account demographics, mortgage rates and credit conditions derived from other parts of the OBR forecasts, as produced in its Economic and Fiscal outlook in November 2022. This model shows us that building 330,000 homes per annum would peg average prices to 2021 levels by 2030 at the same time as incomes are forecast, thereby gradually improving affordability. These prices forecasts enables us to identify financial implications for different members of society of different levels of supply by 2030. We can also use the literature and official datasets to identify the implications for their lives.
For First Time Buyers. The average homeowner already spends 22% of their income on mortgages (the EU average is 15%) and renters spend even more, 33% (the EU average is 20%)[6]. This means they have less money to spend on other things.
Lichfield’s analysis finds that by 2030 the changes would add £18,400 to the average house price compared to maintaining current levels of supply, equivalent to the entire take home pay for a £22,000 job such as a nursery practitioner or Education Support Assistant.
For Renters. More people are renting their homes (more than one in five), almost all of whom are frustrated potential homeowners (89% want to buy). Our assessment is that a cut in housing supply of 77K per year, will act to reduce opportunities for ownership even further.
Each renter will face an additional £208 extra cost each year (on top of the sky high £1,900 p.a. rent increase forecasted under current trends). This means wages will need to increase 25% just for people to buy a home at the historically unaffordable levels they are now.
Because England has amongst the lowest vacancy rates in the developed world, building fewer homes immediately acts to supress household formation. We estimate 580,000 extra concealed households and sofa surfers will be unable to form a household by 2030 – equivalent to the population of Liverpool – just due to the proposed changes.
For Families. Research has found that house prices directly affect the ability for families to form and has a direct impact on the birth rate[7]. Our assessment is that the reduced supply of homes would mean 11,500 fewer births by 2030 that would be expected under current (already declining) trends, adding almost the equivalent of a Wembley Arena of empty seats to the emerging fertility crisis[8].
A cut in supply will also hit the poorest in society hardest. We estimate it means 13,400 more people expected to be made homeless - equivalent to the capacity of Wimbledon’s Centre Court, and 137,000 added to the social housing waiting list – equivalent to a city the size of Cambridge. This is in part due to 17,500 fewer affordable homes that would be built each year, compared to current rates.
The housing crisis is already having a significant adverse effect on the lives of many – typically younger - people, and the problem is growing. Many of these adverse outcomes are directly related to the Government’s Levelling Up Missions set out in the White Paper[9]. For example, the mission for housing includes:
“By 2030, renters will have a secure path to ownership with the number of frst-time buyers increasing in all areas. “
Other Levelling Up Missions focus on boosting productivity, pay, jobs and living standards all influenced by the availability of housing, whilst other proposals for education, health and wellbeing are likely to be undermined if areas are unable to recruit and retain key public sector workers.
The Government identifies 300,000 as a national estimation of the minimum requirement to meet housing need; even the current under-shooting of this target means fewer homes, more expensive homes and significant knock-on societal impacts. But the proposed changes to planning policy announced in December seem set compound this shortage, cutting the supply of new housing to just half the minimum level of need. On top of the current barriers to supply arising from the nutrient and water neutrality restrictions, the NPPF changes risk making a bad situation even worse.


[1]  The NPPF consultation is available here

[2] As found by the 2018 English Survey – a summary of which is here. This found 541,000 (2%) households reporting that they had someone living with them in the last 12 months who would otherwise be homeless, whilst there were 1.6 million households containing an adult who would prefer to buy or rent their own accommodation but cannot afford to do so, with 2 million adults living in these circumstances. 1.6m for both groups is therefore a very conservative figure.

[3] The position of vacancy rates is explained by Centre for Cities here

[4] Based on analysis using OECD / Census 2021. Base Date 2021.

[5] More information on the OBR’s approach to house price forecasting is here

[6] DLUHC, 2022 English Housing Survey, OECD, Housing Costs over income, 2020.

[7] See for example, this 2017 research – Children of When - by the Adam Smith Institute here

[8] As reported in the Guardian here

[9] The Levelling Up White Paper Executive Summary is here

CONTINUE READING

Making a bad situation worse? The impact of the proposed NPPF changes on housing supply
The proposed changes to the NPPF[1] will have a significant impact on house building. The Government accompanied its launch of the consultation in December with the statement that:
“The government remains committed to delivering 300,000 homes a year by the mid-2020s and many of the immediate changes focus on how we plan to deliver the homes our communities need. We know that the best way to secure more high-quality homes in the right places is through the adoption of local plans". 
The Government contends that the proposals will support housebuilding because it will encourage local plans to be prepared[2]. However, analysis by Lichfields for the HBF and LPDF finds that the policy proposals on their own could suppress the rate of net additional homes to just 156k per annum. Even before one factors in issues like the economic downturn or water and nutrient neutrality barriers to house building[3], this would mean building around half of the Government’s assessment of minimum housing need and 77k less than recent rates of delivery.
This is the first of two blogs exploring the implications of the draft NPPF for housing supply and the consequences flowing from that. This first blog explains why the proposals are likely to have such a negative effect on housebuilding and what this would mean for the economy. The second blog looks at the societal consequences
 

Why will the NPPF proposals act to reduce housing supply?

The planning system typically rations the amount of land (brownfield or greenfield) allocated for new homes in each area based on what is considered necessary to meet the local housing requirement (or target) set by strategic and local plans. Local targets are set with reference to the number of homes estimated by the Government’s standard method for housing need plus any unmet housing need from neighbouring areas.
Areas can moderate their target based on constraints (e.g. environmental) in their area, where consistent with national policy. They can also increase their target if they wish – such as in response to Growth deals – but this is not widespread, and seemingly declining[4].
National policy provides a ‘stick’ to try and correct for any under-supply by enabling developers to bring forward proposals not in accordance with the Local Plan and have them determined against the presumption in favour of sustainable development (the so-called ‘tilted balance’) in circumstances where a local plan is out of date, a planning authority cannot demonstrate a five year land supply and/or if it fails the housing delivery test.
Combined, this means the number of homes built in each area will be heavily influenced by:
a.  Its local housing need figure based on the standard method;
 
b.  how far the local plan housing target meets the local housing need plus any unmet housing need from neighbouring areas; and
 
c.  how far the ‘stick’ mechanisms enable new supply to come forward if a local plan is absent or if a local plan’s strategy for housing turns out not to be effective.
Progress towards the national 300k ambition therefore depends on an aggregation of what happens in each area – with different land use circumstances – in response to its local housing need and the planning ‘rules’ set by national policy. This is not new: the benchmark rate of housing required used in the Housing Delivery Test reflects how the system has responded to the 2012 and 2018 iterations of the NPPF and it adds up to about 230-240k per annum over recent years, well short of the 300K required, but very similar to the amount of housing that has actually been supplied (albeit with some areas doing more, and some doing less). Yes, the market cycle has an effect and there are ups and downs, but ultimately house builder land pipelines have to respond to the anticipated run rate at which new sites are expected to become available via planning, as research found in 2021.     
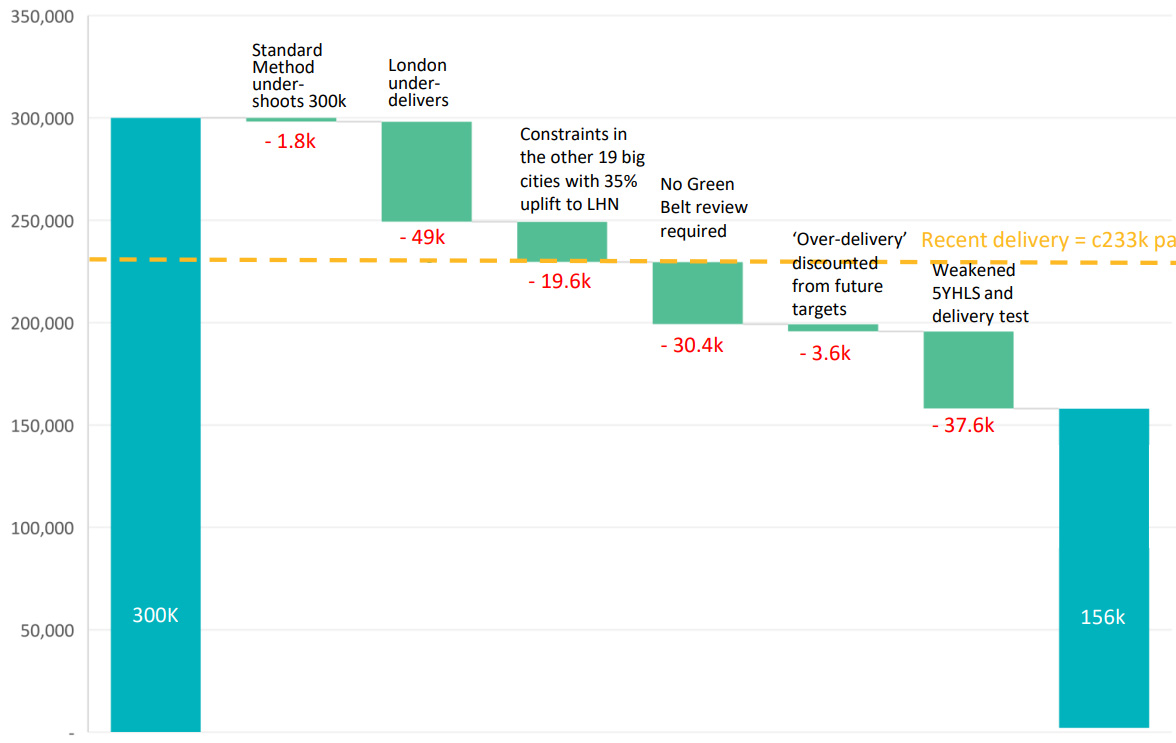
The Government’s proposed changes to national policy have not changed the estimate of housing need (albeit the combined local housing need outputs add up to ever so slightly under 300k), but they would change the planning rules. Our assessment identifies five core factors that will lead to the 77k reduction in housing supply, as illustrated below:
Each reduction is explained below:
  1. London’s housing need under the standard method is 86k homes per annum. The adopted London Plan sets a target of 52k based on evidence that realistic supply of land is limited in the capital[5]. The high point of housing delivery in the capital was 41k in 2019/20 but the recent average is 37.4k. The proposed changes to the NPPF now specifically resist building at densities significantly out of character with the existing area[6], which will limit many forms of development that have driven higher output; supply is unlikely to exceed the recent average, let alone increase to drive supply up towards the London Plan target of 52k, with zero prospect of meeting need at 86k[7].
     
  2. The 19 other large urban centres are subject to the 35% uplift in the standard method and the NPPF proposals indicate this should be accommodated within those cities themselves[8] with removal of the expectation that unmet need should be accommodated in neighbouring areas[9]. There is widespread recognition[10] that these cities do not have sufficient brownfield capacity, many are surrounded by Green Belt or administratively tightly bounded, and the NPPF proposals on character will – as in London – limit densification proposals, particularly in suburbs. Many have been building out existing housing allocations (including on previous Green Belt releases) that are now unlikely to be replaced. We conclude these areas will undershoot their housing need by 19.6k.
     
  3. There are 108 local authority areas where the amount of land constrained by urban footprint, Green Belt and other designations under Footnote 7 of the NPPF acts to limit the availability of land for development. Since 2012, plan makers interpreted national policy as requiring them to review the Green Belt to see if some of it can be released for development to address housing needs[11]; such areas have also tried to optimise density on previously developed sites and, if there was unmet need, to try and ensure any unmet need is addressed in neighbouring areas. All three of these policy obligations are removed or diluted by the NPPF proposals. This means there is no realistic prospect of housing need being met in these areas; in fact, rates of housebuilding are likely to reduce as readily deliverable brownfield capacity is exhausted, densities are lowered for character reasons, and Green Belt releases are built out and not replaced. We conclude these areas will under-shoot their housing need by 30.4k.
     
  4. Some areas have built more than their adopted housing targets, so called ‘over-delivery’. Although the NPPF says that the standard method is a ‘minimum number’, the proposed amendment (Para 11 b) iii.) says that ‘over-delivery’ may be deducted from the provision required in the plan. Precisely how this will apply awaits guidance, but it will obviously have some effect in those areas that have been successful in housebuilding. We conservatively suggest they will under-shoot their housing need by 3.6k. This clause also means that areas that do more than their targets in future will be able to offset it against future need.
     
  5. Finally, the NPPF proposes to reduce the expectations for maintaining a five-year land supply and operation of the Housing Delivery Test (HDT)[12]. This flows from the removal of the buffer; from those with a Reg 18 plan only needing a four-year supply; from those with an adopted plan not needing to maintain a five-year supply at all until the plan is out of date; from Neighbourhood Plans conferring 'protection' for five years instead of two; and from there being little consequence of failing the HDT. The combined impacts on supply are uncertain, but it will inevitably reduce significantly the circumstances whereby permissions for housing are granted in order to mitigate existing or future shortfalls in housing land supply.
     
    Last year, some 26,813 homes were granted approval at appeal[13], and many more will have been approved directly by local authorities because they conclude they do not have – or might in future not have – a five-year land supply. A January 2023 survey by Planning Magazine (available here [£]), found that 38% of local authorities report they do not have a five year housing land supply, with scores of LPAs in the band of reporting 4-6 years supply, who may now find themselves 'protected'. Further, planning appeal decisions routinely find that the five-year land supply positions of local authorities turn out to be lower than originally estimated. Research on the accuracy of five-year land supply trajectories showed that the average over-estimation of housing output by London Boroughs in year 1 of their trajectory was 20%, with accuracy then deteriorating further for subsequent years[14]. Discount rates of 10% are routinely applied in five-year land supply assessments, and evidence in Milton Keynes found that an optimism bias that over-estimated supply in the order of 10-25%[15]. In future, with no requirement to demonstrate a five-year land supply once a local plan is adopted, and reduced consequences of failing the HDT, there will be less pressure on local authorities to exercise their role as enablers of housing delivery[16]. This will inevitably increase the level of optimism bias on site output[17]. We conclude a reduced output of 38k (broadly equivalent to c.20% of the residual housing delivery after the other deductions) to reflect a reduction in the housing granted at appeal, less pressure on Councils to grant applications in order to protect their land supply position, and increased optimism bias in five-year land supply trajectories.   
     
The above comes on top of the immediate effects on supply of the economic and housing market downturn, and of course the significant number of homes (estimated at over 100,000) being held up by water and nutrient neutrality barriers across 75 local authority areas.
We do not find measures in the proposed NPPF changes that would suggest housing output will increase or counter the prevailing downward pressures. Even if the Government is correct that more local plans will be prepared, fewer of them are likely to have targets that meet their local housing need or address unmet need from neighbours, and there will be fewer measures to address the inevitable shortfalls in housing delivery that follow. Future LURB proposals – e.g. on street votes – are some way off and even if they deliver on their promise, they are unlikely to move the dial on actual delivery in the short to medium term.


What are the implications of reduced housebuilding?

Housing has an obvious role in providing people with accommodation to buy and rent. Our analysis suggests the downward pressure will be in areas where this is most needed: more than half of the shortfall against the 300k ambition will be in the least affordable third of local authorities. We will address some of the societal implications of this in our next blog. Here we focus on the cost to the economy.
 

Direct economic implications

The house-building industry is a major driver of economic growth and supports sustainable local communities[18]. The introduction to the Barker Review[19] found that: A weak supply of housing contributes to macroeconomic instability and hinders labour market flexibility, constraining economic growth”
While the latest economic figures show that the UK is not technically in recession, the cost of living crisis and slow growth rates have put sharp focus on the levers available to Government to help stimulate an economy so that it that provides well paid jobs and boosts tax revenue to pay for stretched public services.


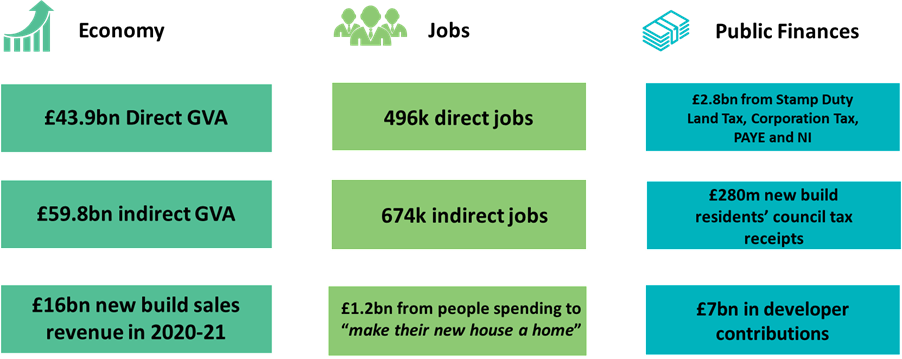
Source: Lichfields analysis drawing on HBF (2018) The Economic Footprint of Housebuilding. Applied to 2021 total housing supply. New build revenue from latest UKHPI. Council Tax from VOA data in 2021-22. First occupation expenditure uses average estimated amount in OnePoll in 2014. Tax Value is prorated from survey of housebuilders in 2016-17 for HBF report. Developer contributions figure from 2020 MHLGC commissioned research.

Our estimate is that – directly and indirectly - housebuilding contributes £104bn to the economy each year, supporting 1.2m jobs and generating £3.1bn of tax income. Additionally, house builders make £7bn in extra contributions (through Section 106 and Community Infrastructure payments) to help fund infrastructure, social housing and open spaces.
However, if the proposed changes to the NPPF are implemented and the number of new homes added each year is reduced to 156k, the cost to the economy will be significant. £70bn rather than £104bn of GVA, and 784k jobs rather than 1.2m jobs. To put it another way, compared to now, the proposed changes could cost £34bn of GVA and 386k jobs. There will be consequential reductions in tax revenue.
In reality, in combination with the impact of water and nitrate neutrality restrictions, the economic footprint could decline even further.
Of course, the opposite is also true, a set of NPPF policy measures that supported the meeting of housing need at 300k per annum would almost double the footprint from that likely to arise from the proposed changes, to around £134bn of GVA and 1.5m jobs.

The indirect economic impact of under delivery

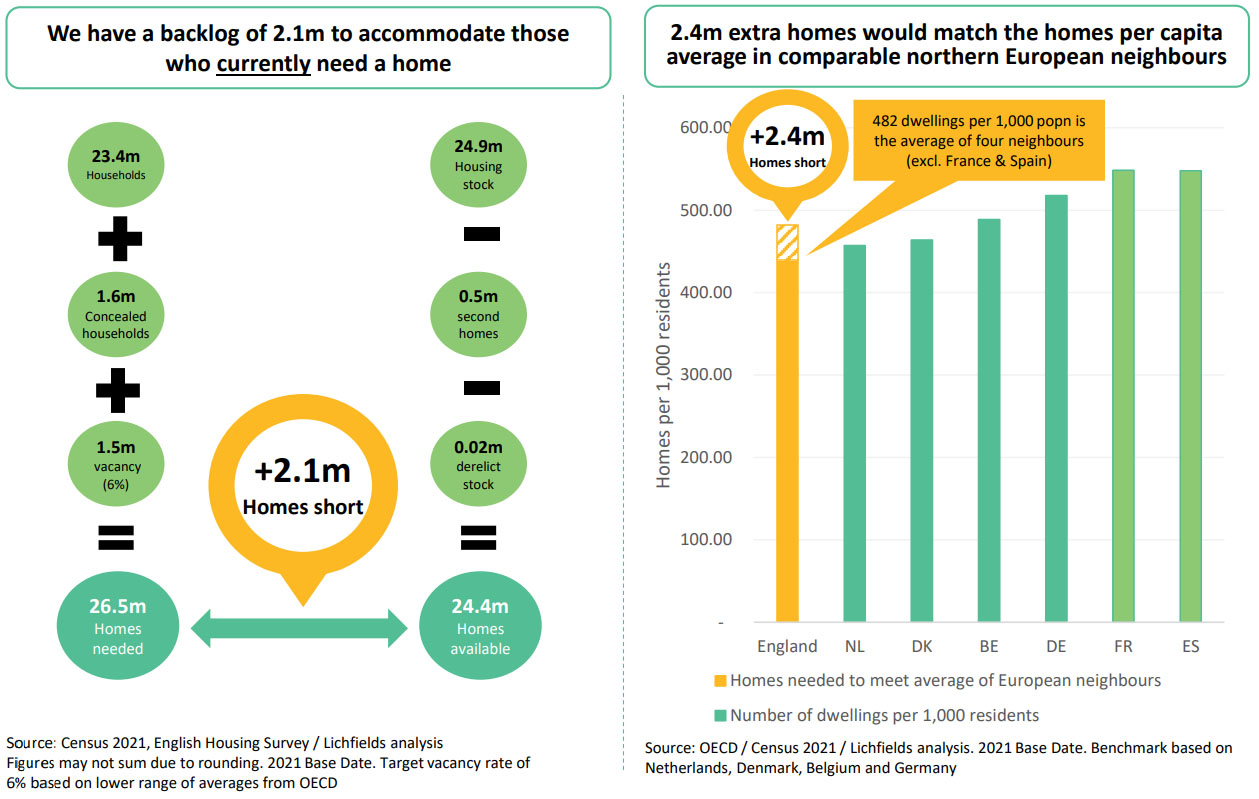
Boosting supply over the long term helps make homes more affordable[20]. Analysis by Lichfields of affordability, rates of house building, and population change 2011-2021 shows a positive correlation in the least affordable housing markets between building more (relative to population growth) and relative improvements in rates of affordability.

In the least affordable areas, when housebuilding exceeds population growth, relative affordability improves between 2011-2021

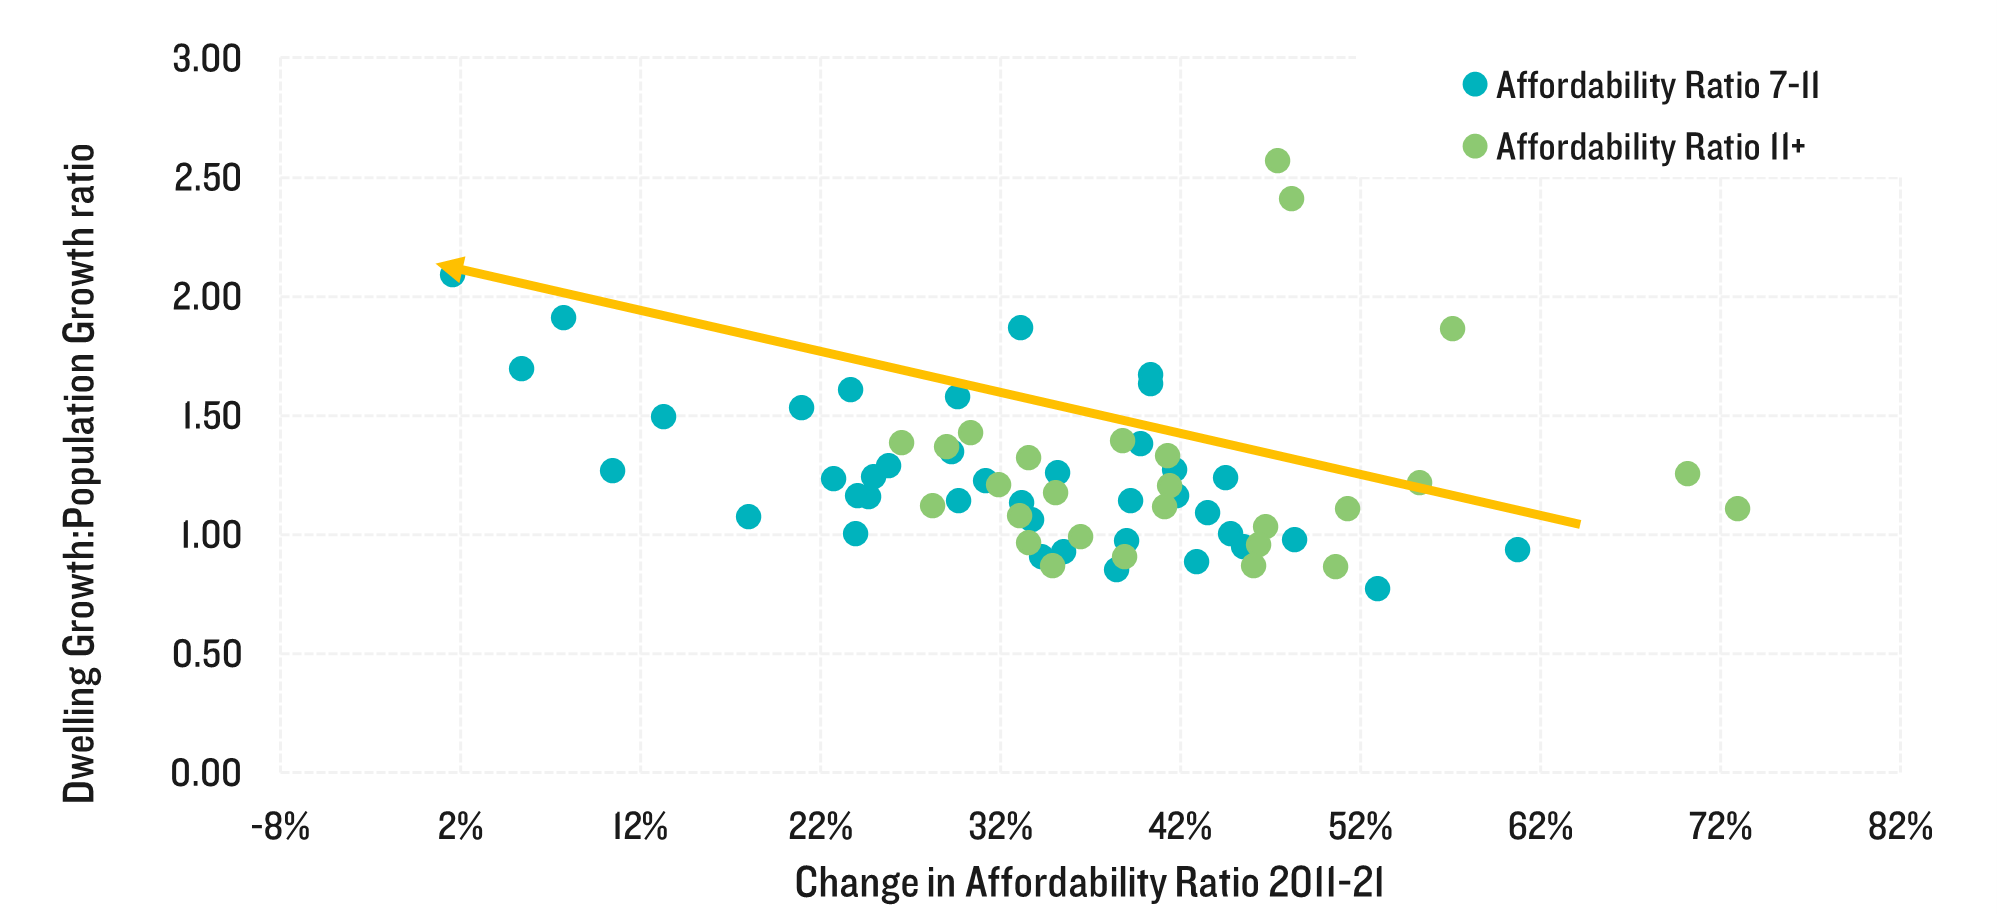
In the absence of building sufficient homes, prices will instead continue to rise. The lack of homes in England’s most economically successful areas, such as Oxford, Cambridge and London, already locks people out of opportunities in the most productive places, undermining both social mobility and the potential agglomeration gains to key industries of co-location. Knowledge-based workers with the ability to secure high quality jobs anywhere in the world will be more likely to vote with their feet in search of places where their money goes further. And with access to skilled labour a more valuable commodity in the knowledge economy, globally mobile firms will be more likely to direct investment overseas. The macro effect will undermine Levelling Up missions for productivity.
The lack of house building, and restricted land supply is harming productivity. The Economist recently reported[21] that land went from taking up 39% of the value of non financial assets in 1995 to 56% in 2020 in Britain. This means land - and housing - soaks up investment, ‘crowding out’ more economically productive alternatives to which banks can lend and for investors to see returns. In 2022. Those who cannot afford to own a home miss out, and spend more income on ever-rising rents. Recent Lichfields research for Barratt found those renting in northern and midland Core City regions who could reasonably expect to buy but for high deposits will lose out a total of £945m in lost savings and equity over the next ten years.
These high and rising house prices also exclude key workers from our most economically successful places, harming not only these individuals but the sustainability, vitality and resilience of whole areas. Those such as nurses, teachers, NHS cleaners, and community support officers are being priced out of areas that need them most. 2018 research by Unison found that key public sector workers need to save between 5% and 7% of gross pay for more than 30 years just to afford the average deposit. Recruitment is a key barrier to Levelling Up missions for education, health and crime[24].
In addition, businesses are struggling to find the space to grow. The 20 cities that have had their local housing need figures boosted by the 35% urban centres uplift account for 40% of England’s productivity (GVA). The increased pressure the proposed changes to the NPPF places on meeting this need within those local authorities and without impacting on the prevailing character of existing residential areas will increase pressure on local authorities to re-allocate land away from industrial space[25]; many cities are also losing their much-needed employment space to housing and this will worsen under the proposals. Since 2000 London lost a quarter (24%) Greater Manchester 20% and the West Midlands 19% of industrial floorspace to housing.[26]

Conclusion

England suffers from unaffordable housing due in large part to a lack of sufficient house building over a sustained period. The 300k ambition was a policy drive aimed at reversing this structural problem. Unfortunately, our assessment is that the latest proposed NPPF reforms threaten to make what is a bad situation even worse, taking supply down by 77k to just 156k. This is before one considers the consequences of water and nutrient neutrality restrictions or the housing market downturn. The impact of this is not just felt in those who are deprived of a home, or an alternative to sky high rents and house prices, but to the economy more broadly. At a time when there is a renewed focus from Government on trying to secure growth amidst a relatively stagnant economic landscape, the draft NPPF proposals – if implemented following the consultation – would seem likely to act against that objective.

[1] The Consultation is available here

[2] The Government consultation explains this its analysis is that areas without an up-to-date Local Plan would have 14% higher housing supply if their housing supply (as a proportion of existing housing stock) were as much as those with an up-to-date plan. Unfortunate, this analysis does not address the point that many of the areas without an up-to-date plan are in Green Belt and other restricted areas where the Government’s proposed policy is likely to restrict housing requirements.
[3] The HBF estimates based on a survey of local authorities in the areas affected is that 120,000 homes are currently stalled by restrictions linked to nutrient neutrality, and that this could manifest itself as around 41,000 homes per annum once one takes into account the future flow of allocations and permissions that are affected. 

[4] For example, the Oxfordshire Growth Deal was based on a higher target than that set by the Standard Method, but indications are that its constituent members will now revert to a lower number – see here 

[5] The London Plan SHMA from 2018 identified need of 66k p.a. The Inspector Panel examining the Plan concluded that adopted target should be 52k p.a. saying, inter alia, that: “the question of supply is based on capacity and given that this would be maximised as far as realistically possible it is difficult to see how the number of deliverable housing units could be increased without consideration being given to a review of the Green Belt or further exploration of potential with local authorities within the wider South East.”

[6] This is the amendment proposed to NPPF para 11 b) ii)

[7] Further, there is no mechanism in place to address the cross b0undary relationship between London and its surrounding local authorities, as demonstrated by the Panel Reports into successive London Plans.

[8] As set out in NPPF proposed changes at para 62 of the consultation draft

[9] As set out in NPPF proposed changes at Para 35 a) which removes that requirement from the “Positively prepared” part of the soundness test that applies to Local Plans. In due course, the LURB proposes to remove the Duty to Cooperate and replace it with a “policy alignment” test

[10] See for example this review of how planners are responding here (£).

[11] There was no obligation to release Green Belt to meet need in full, but many plan makers reviewed the Green Belt and found ‘exceptional circumstances’ for amending its boundaries did exist: see DLUHC Monitoring of Green Belt change here

[12] The provisions on five year housing land supply and their broad consequences are explained here. The provisions on the Housing Delivery Test are explained here

[13] Based on annual PINS data

[14] The research – Mind the Gap – can be found here

[15] See for example, the Land at Castlethorpe Road appeal here

[16] A role defined by the Elphicke-House report (see here) which gave lie to the idea of LPAs as passive players in housing supply

[17] Indeed, in Milton Keynes, the Castlethorpe Road planning inspector concluded that the level of optimism bias would reduce in response to the Government’s then increasing pressure on housing delivery; a more relaxed regime will obviously have the opposite effect. 

[18] See the Economic Footprint of House Building in England and Wales here

[19] The Barker Review Final Report – Recommendations is here

[20] Whilst the role of extra supply in improving affordability is disputed in some commentary, there is in fact a widespread consensus (including from the Office for Budget Responsibility) that prices are influenced by supply and that, over time, increased supply acts to moderate house price growth relative to growth in incomes. Professor Glen Bramley of Heriot Watt University found that: “Increased housing supply is part of the solution to the manifest housing problems, not just because of the gradual moderation in price levels it can achieve but also … because it enables much more of other more direct solutions, notably the building of more social and intermediate affordable housing in mixed developments funded by land value capture”. The Redfern Review found: “Long-term increases in supply, sustained over 20+ years will be needed to reduce overall housing market pressure, increasing the ‘size of the cake’ and resulting in a ’positive sum’ gain. Government’s primary role is in guiding the long-term environment that will support its objectives”

[21] See Economist article here (£) 

[22] Average House prices for England from ONS House Price Index Q3 2022 to Q3 2023 (£58,000 Median household disposable income (UK) of £32,300 for financial year ending 2022. (after Income Tax, National Insurance and Council Tax).

[23] Unison, 2018. Priced Out: Home ownership and public service workers is here

[24] The Levelling Up White Paper Executive Summary is here

[25] This trend was identified even before the 35% urban uplift was proposed to be enshrined in the NPPF – see Financial Times report here (£)

[26] Centre for London 2022, Making Space available here


CONTINUE READING

Greater Manchester’s Student Squeeze

Greater Manchester’s Student Squeeze

Max Kidd-Rossiter 09 Feb 2023
There has been an unprecedented demand for student accommodation in Greater Manchester since the Covid-19 pandemic, which culminated in students being unable to secure accommodation for the 2021/22 and 2022/23 academic years. This was well documented in the local press, with some students being asked to commute to their Manchester universities from Liverpool or Huddersfield[1]. In another instance, a university offered students a financial incentive to hand-back their university managed accommodation so that it could be offered to other students[2].
So, what has caused the imbalance of student accommodation in Greater Manchester?

Demand

Regionally, as well as nationally, there are more students enrolled at higher education [HE] providers than ever before[3]. Greater Manchester is home to the largest student population in the UK, outside of London. Between the 2014/15 and 2019/20 academic years, there was a gradual year-on-year increase of students attending the eight HE providers in the Greater Manchester region[4].  Over this five-year period, there was a growth of 8,885 students[5], from 96,300 in 2014/15 to 105,145 in 2019/20 (see Figure 1 below).  Then, in the 2020/21 academic year, there was a sharp increase of 11,520 students enrolled at HE providers in Greater Manchester – more growth than the previous five-years put together.  The data for the 2021/22 academic year was published in January 2023 and shows that student enrolments in Greater Manchester continued to climb at a higher rate than pre-pandemic levels.  
This growth meant that at the start of the 2021/22 academic year, there were 121,305 students enrolled at Greater Manchester’s HE providers. The city region’s four universities make up 99% of the enrolments (119,800). The University of Manchester has the most students enrolled (46,410), followed by Manchester Metropolitan University (36,980), The University of Salford (25,415), and The University of Bolton (10,995).
Figure 1 Students Enrolled at Greater Manchester HE Providers 2014/15 - 2021/22

Source: Lichfields analysis using HESA data (2015-2022)

The majority of HE students move into a term-time residence. Nationally, 52% of students live in university maintained property, private-sector halls, or other rented term-time accommodation. This increases to 55% for students attending HE providers in the North West of England[6]. This means that the growth of student enrolments for the 2020/21 academic year alone generated a demand for circa. 6,300 additional student bedspaces in Greater Manchester[7]. Across the 2020/21 and 2021/22 academic years together, enrolment growth generated a demand for approximately 9,000 additional student bedspaces.

Supply

It is clear from the measures employed by Greater Manchester’s HE providers to offer students accommodation for the 2021/22 academic year, that the supply of purpose built student accommodation [PBSA] has not managed to keep pace with the sharp rise in demand.
PBSA, whether university maintained or private, is typically the preferred accommodation choice for students because of its additional security, tailored facilities, social living spaces, and simplified letting arrangements. However, the lack of PBSA in Greater Manchester has left many students with no other option but to enter the mainstream rental market. There is now intense competition between working households and students for rental accommodation in Greater Manchester.  This is one of a number of a number of factors that has led to a ‘perfect storm’ for Greater Manchester’s rental market – with rents reported to have increased between 20%-40% across the city region over the past year. 
Despite the lack of supply, the emerging Places for Everyone Joint Development Plan [PfE] for nine of the Greater Manchester districts does not identify any specific allocations for PBSA. PfE acknowledges that Greater Manchester has one of the largest student concentrations in Europe, and supports the continued growth of the university sector (draft Policy JP-P 5). However, PfE draft Policy JP-H3 states that housing provision to accommodate specific groups, including students, will be dealt with through district local plans. 
The continued growth of the universities, in line with PfE draft Policy JP-P 5, will drive additional demand for student bedspaces in Greater Manchester. This could create a greater imbalance of student bedspaces in the short-to-medium-term, until the Districts’ Local Plans address student accommodation provision. In the interim, there is evidence of a need for PBSA development to address the imbalance.  Additional PBSA development can also help to free-up private rental stock by accommodating students that would otherwise be forced into the mainstream rental market.
Most Local Planning Authorities now require developers to demonstrate the need for PBSA. This is particularly pertinent to locations, such as Manchester, where several PBSA developments have recently been consented, or are currently under construction.


Bedspace: A robust evidence-led argument to support new PBSA

Lichfields’ product Bedspace[8] is an evidence-based solution to demonstrate the need for PBSA. By undertaking a quantitative analysis of current and past trends in student growth, and analysing it against the current supply pipeline and growth strategies of HE providers, Bedspace can identify the capacity for further PBSA in any defined location.
How Bedspace can help stakeholders address Greater Manchester’s student squeeze:
  • PBSA Developers – Bedspace can provide a robust evidence-led argument to support new PBSA development in a given university location in Greater Manchester. It can also be used as a tool to inform early investment decisions.
  • Local Planning Authorities – Bedspace can understand the student accommodation needs of the Greater Manchester districts and provide robust evidence to support policies and allocations in emerging development plans.
  • HE Providers – Bedspace can inform the expansion of the HE provider’s existing accommodation offer by understanding the mix of student accommodation in the area.
Please get in touch if you want to discuss Bedspace further.

[1] Manchester Met students offered £100 a week to live in Liverpool and Huddersfield as university hit by accommodation crisis

[2] Manchester University offer students £2,500 to live off campus after 'unprecedented' accommodation demands

[3] HESA Data (2022)

[4] The University of Manchester, Manchester Metropolitan University, The University of Salford, The University of Bolton, Royal Northern College of Music, Futureworks, Nazarene Theological College, and Luther King House Educational Trust

[5] Lichfields analysis based on HESA data 2014-2021

[6] HESA Data (2021)

[7] Lichfields analysis based on HESA data (2021)

[8] https://lichfields.uk/content/products/bedspace

CONTINUE READING

 From Mags to Riches: The impact of footballing takeovers on urban development

Improved football, increased tourism and inward investment. The potential impacts that Newcastle United FC’s 2021 takeover could have are endless.

Just over one year on since the takeover of Newcastle United and step one of the short-term project has already been completed – secure premier league survival for the 2022-23 season. A trip to Wembley (coincidently a Lichfields flagship project) now awaits, as the football club looks to secure its first piece of domestic silverware since 1955 at the Carabao Cup Final on February 26th.
The new owners, fronted by PCP Capital Partners CEO Amanda Staveley, have already funded mammoth levels of investment into improving the playing squad and training facilities, injecting a reported £450m since the completion of the takeover in October 2021[1]. Whilst this notable level of investment has already yielded benefits on the pitch, it is the economic spill-over effect of footballing success and wider positivity of the people which may yet deliver the longer-term benefits for Newcastle as a city. Indeed, there is no doubt that Newcastle United is embedded into the fabric of the city, and thus when the football club prospers, so does the city’s economy.

Pre-match

The takeover of Newcastle United bears resemblance to that of the Manchester City takeover by Sheikh Mansour in 2008. In those 14-years since, the city of Manchester has flourished in both a footballing and economic sense: Manchester City now have 6 premier league titles to their name; and the city of Manchester has experienced an increase in employment of 18.2% between 2015 and 2021[2] (representing three and a half times the national growth rate of 5.3% and within the top 3% of all Great Britain local authorities). Manchester City Council states “This is testament to the construction boom delivering high-quality office workspaces, reflecting the development momentum of the past ten years.”[3]
Manchester City Council further forecast that:
  • An additional 40,000 people will live in the city centre by 2026, increasing the population to 100,000; and
  • An additional 65,000 jobs will be created in the city centre, increasing employment to 315,000 by 2040.
Given the extraordinary scale of difference in wealth between the two football clubs, with Newcastle United’s owners now worth an estimated £320 billion in comparison to Manchester City’s £22.9 billion, the potential economic impact across the North East may be greater still.
In order to understand what impacts could potentially arise for the city of Newcastle and the wider North East region, it is first important to understand how Manchester has been impacted upon following the Manchester City takeover and what the key lessons are. The bullet points below summarise the major impacts that have been demonstrated over the last 15 years:
Boosting the Greater Manchester economy by contributing towards the £1.1bn worth of Gross Value Added (‘GVA’) generated solely by Manchester’s Premier League clubs in 2019/20[4]. This total represents 2.2% of the total 2019 GVA of Greater Manchester[5] (a value dampened by the impact of Covid-19 towards the end of the season). By way of comparison, the second largest employing industrial group (retail trades) generates only 6.3% of Greater Manchester’s GVA, despite having over 100,000 more people employed in the sector;
Infrastructure investment into the club’s assets. The construction of a new football academy was estimated to have a total public value in the order of £206m including: £89m from permanent job creation; £89m from improved educational outcomes and health benefits; and £28m from visitor spending; and
Supporting an increased number of jobs created, in part, from the ever growing (and increasingly globalised) fan base of the club due to the recent success.
Increasing demand for local commercial and office space. Data obtained using CoStar indicates that vacancy rates for retail and office space currently stand at almost 0% in the 1-mile radius from the Etihad Stadium. This represents a decline of 94% since the takeover materialised (Q3 2008 – Q4 2022). As a benchmark – despite broadly similar vacancy rates at the time of the takeover – vacancy rates have decreased at a lower rate across Manchester local authority area (-52%) and Greater Manchester (-17%) over the same period.
Retail and office vacancy rates in Manchester (2008 – 2022)

Source: CoStar / Lichfields analysis


Kick off

So, what can be taken from the above impacts with regards to the Newcastle takeover? Firstly, success on the pitch will be the primary driving factor in which the football club impacts the local economy. It is a simple mechanism – the better the results, the higher the matchday attendance – which will naturally lead to greater expenditure in local pubs, bars and restaurants as fans socialise before and after matches. Indeed, the tourism and leisure sectors benefit greatly from football, particularly as the sport provides a level of consistency and certainty during months where tourism and leisure activity would otherwise be low.
Hotel occupancy rates in Newcastle soar on a match-day, but currently that only occurs around 20 times a year with the football club competing in domestic competitions only. Notwithstanding this, a considerable proportion of away fans generally travel to the North East on a matchday from elsewhere in Britain, with Newcastle United offering a generous 3,000 away seat allocation at their St. James’ Park Stadium.
So, how can Newcastle as a city further reap the benefits from the success of its football club? The answer – European football.
If Newcastle achieve their aspirations of continental football, there will be more match-days with the added element of visiting foreign fans. Attracting foreign fans to the city is beneficial - data from VisitBritain suggests that foreign tourists spend up to 3-times more than domestic tourists; with a far larger proportion of overseas fans requiring a hotel for match-days. Indeed, Newcastle as a city appears to be in good stead to accommodate prospective increased foreign tourism in the future, with three recent planning approvals for multi-million-pound hotels in the city centre. This includes land at Newcastle Gateshead Quays, whereby Lichfields secured full planning permission for the development of a dual-branded hotel comprising of 327 guest bedrooms, forming part of a wider mixed-use leisure proposal.
Refreshingly, the new owners are showing long term commitment to invest in the city’s tourism sector, with Taras Properties (owned by the Reuben Brothers who now own a 10% share of the football club) recently securing planning permission for the refurbishment of the Grade II Listed Fire Station on Pilgrim Street into a new luxury hotel, along with a restaurant, bar and pavement café. Not only will this development help secure the built infrastructure required to promote Newcastle as a ‘tourist location’, but it also exemplifies the confidence the new owners have in investing in the city’s built environment, generating developer confidence to invest in the North East.
Figure 1: Former Pilgrim Street Fire Station which is set to be refurbished into a new luxury hotel

Source: Ryder Architecture


Second half

Since the takeover gained premier league approval, the new owners of Newcastle United have obtained planning permission for the much-needed redevelopment of the club’s ageing training ground, Darsley Park. It is however likely that this is only a short-term fix of a longer-term solution - whilst redevelopment of Darsley Park will improve the overall facilities and catch up on the lack of investment in recent years, the new owners have previously spoken about developing a new training ground in a different location. Indeed, both the redevelopment of Darsley Park alongside the development of a new training ground will support a number of construction jobs and generate uplifts in economic output through inward investment. In addition, this longer-term plan presents the opportunity to develop a state-of-the-art facility that can act as a statement piece to attract new, world-class players, which in turn will assist with the globalisation of the football club.
Newcastle United has also recently taken up the opportunity to replicate Manchester City by investing in community facilities within the city, improving the educational and health profile of the local community. In March 2022, the Newcastle United Foundation moved into their new £8 million city centre home known as NUCASTLE, which provides community space located within the backdrop of St James’ Park. The new hub has been designed to support thousands of lives through a range of educational, sport, personal development and wellbeing programmes, reinforcing the strong link between the football club and the local community. Of course, the community goals of a football club in the modern era goes beyond just winning matches on the pitch – they now have an important role in giving back to society.
This relationship between Newcastle United and the local community has been fully embraced by the new owners, who themselves have shown commitment to support important charitable work and promote diversification throughout the football club through investing in the women’s team and grassroots football. Indeed, the community feel of a football club is imperative in order to sustain a ‘feel-good factor’ amongst supporters, which in turn will stimulate economic uplift.
The upgrade and possible expansion of St. James’ Park is also likely to be on the agenda for improving the club’s assets and attracting larger attendances. The football ground is rather unique in the sense that it is one of very few football stadia situated within a highly accessible city centre location, supported by a wealth of nearby restaurants, bars and hotels. Indeed, St James’ Park is well-renowned as a ‘fan’s favourite away day’ due to its location and prominence, with the venue commonly selected for other major sporting events which in the past has included Olympic Football, Rugby Union and Rugby League competitions. In this context, the club’s new owners have publicly expressed their desire to invest in the stadium in order to secure its long-term future. This does not come without considerable planning challenges however, given the existing Grade-I listed heritage status of Leazes Terrace to the east of the stadium; and the impending plans to develop land beyond the Gallowgate Stand to the south for a mixture of commercial and residential uses.

Full Time

Football can have a huge impact on the local area, even benefiting those that don’t have an interest in the sport. In this context, it’s an exciting time to be a stakeholder in Newcastle – met by a lot of anticipation. We at Lichfields are well-placed to provide effective planning and consultancy services to maximise the benefits that any investment in developments across the city and wider North East region could have.

[1] SportsPro Media

[2] Business Register and Employment Survey (2021)

[3] https://www.manchester.gov.uk/info/500002/council_policies_and_strategies/8296/future_manchester_an_economy_built_on_people_place_and_prosperity

[4] EY: Premier League – Economic and social impact

[5] ONS Regional Gross Value Added by industry

CONTINUE READING