Planning matters

Our award winning blog gives a fresh perspective on the latest trends in planning and development.

The High Street isn’t dead, long live the high street #5 - the Post-COVID “new norm”?
The Government’s latest retail sales figures show encouraging signs of recovery since lockdown, but what do the figures tell us about the future and the most likely “new norm”?
In the past consumer expenditure has grown consistently in real terms (over and above inflation) over the long term. This growth has fuelled the demand for new retail floorspace. Average retail expenditure per person in the UK grew by about 16% between 2009 to 2018 (Experian), despite the impact of the last recession i.e. 1.8% decline between 2009 and 2012. However, beyond this headline growth, home shopping accounts for much of this growth rather than in-store shopping. Expenditure growth per person attracted to traditional bricks and mortar retail was only 5% between 2009 to 2018, as a result demand for new retail floorspace has been sluggish during the last decade.
The short-term impact of the COVID-19 crisis is becoming clearer but the longer term structural implications are harder to predict. In the short term, operators have faced cash flow issues and increased costs arising from a slump in consumer demand and disruption to supply chains. Non-essential products, hospitality and leisure services have been hardest hit. Some retailers able to fulfil on-line orders/home delivery are benefiting at least in the short term from enforced changes in habits. There is likely to be a longer term structural shift to on-line shopping, reducing the demand for physical space within town centres. Following the COVID-19 furlough arrangements there is likely to be a spike in vacancies and some centres may struggle to fully recover. Some centres will need to explore opportunities beyond retail.
Office of National Statistic (ONS) monthly sales volume information for Great Britain indicates total retail sales volumes had recovered to previous levels of growth but the proportion of retail sales spent on-line is likely to represent a higher proportion of total sales, which will have an impact of traditional bricks and mortar retailing.
Retail sales volume fell by 22% in April 2020 during the start of lockdown. However, post lockdown sales during July and August recovered to pre-lockdown levels, with the August figure now 4% higher than the February figure. During lockdown on-line retail sales peaked in June at over 62% higher than pre-lockdown levels. On-line sales remain high at about 50% above normal levels.
Excluding on-line sales, the latest sales figures suggest bricks and mortar retail trade is still 6% down on pre-lockdown levels. This 6% reduction may not fully reflect the implications of the expected economic downturn, particularly after the furlough period ends in October. A challenging period for town centres and some operators over the next 3 to 5 years now seems likely, but these effects will not be evenly distributed.
The comparison goods (non-food) sector has been particularly affected with a 50% drop in sales from February to April, whilst the food sector experienced 10% growth in sales during March, in part due to panic buying at the start of the crisis. Food sales volumes have been consistently higher since February, benefiting from reduced trade in restaurants, cafés, pubs and bars.
The year to date sales figures (January to August) are down by -4.8%. Food stores achieved +4.4% growth compared with -18.2% reduction for non-food retail, with clothing and footwear the hardest hit at -30.1%. The continuation of these trends suggest higher order fashion shopping destinations could suffer most from the surge in on-line shopping. Lower order centres focusing on day-to-day essential items and services have, and should continue to recover more quickly.  
This trend is evident from the Centres for the Cities’ high street recovery tracker which monitors footfall and spend across cities and large towns. Large city centres have been slow to recover with many centres still 30% or more down on footfall and spend during the last week of August compared with pre-lockdown levels. The worst affected city centres in terms of footfall include: London (-69%), Manchester (-51%), Birmingham (-48%), Leeds (-43%) and Nottingham (-41%). These large centres have been the hardest hit due to increased home working and loss of international tourism. As a consequence of increased working from home, these headline figures for larger cities mask increased footfall within many local, district and town centres: which have seen a resurgence in footfall as people work and spend locally. Many satellite towns and seaside resorts have benefitted from home working, staycations and more customers shopping locally. The best performing towns include: Blackpool (+41%), Bournemouth (+33%), Birkenhead (+24%), Southend (+16%) and Chatham (+15%). This is likely due to the differing roles that high streets have in smaller towns. Where footfall has previously been driven by destination retail (for example the Bull ring in Birmingham or Oxford Street in London) or by office generated footfall, for example Leeds or the City of London, high streets have lost their customers during lockdown and the shift to working from home. In smaller towns, and local centres however there is evidence of customers returning, following the eat out to help out scheme and the benefits of being able to shop locally.

Source: Centres for Cities footfall data for 13 February – 1 September 2020

Some rebalancing from large to smaller centres will be welcomed in many areas, following the extended period of polarisation towards the most successful regional shopping destinations. This rebalancing could be sustained if, for example, increased home working continues. Town centres ability to retain market share and compete with on-line sales will be critical for the vitality and viability of town centres in the post-COVIDnorm. Town centres will need a coherent recovery strategy to have the best prospects of flourishing. Continued repurposing of retail space is inevitable due to the likely spike in vacancy rates and recent changes to the Use Class Order allowing more flexibility for changes of use.
Other blogs in this series:

CONTINUE READING

The Local Plan Transition – From the NPPF (2019) and the Standard Method to a new White Paper Planning System

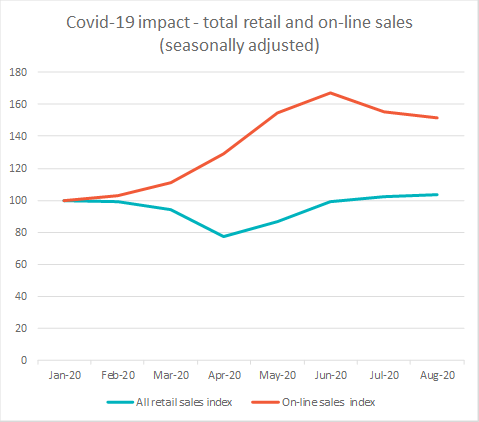
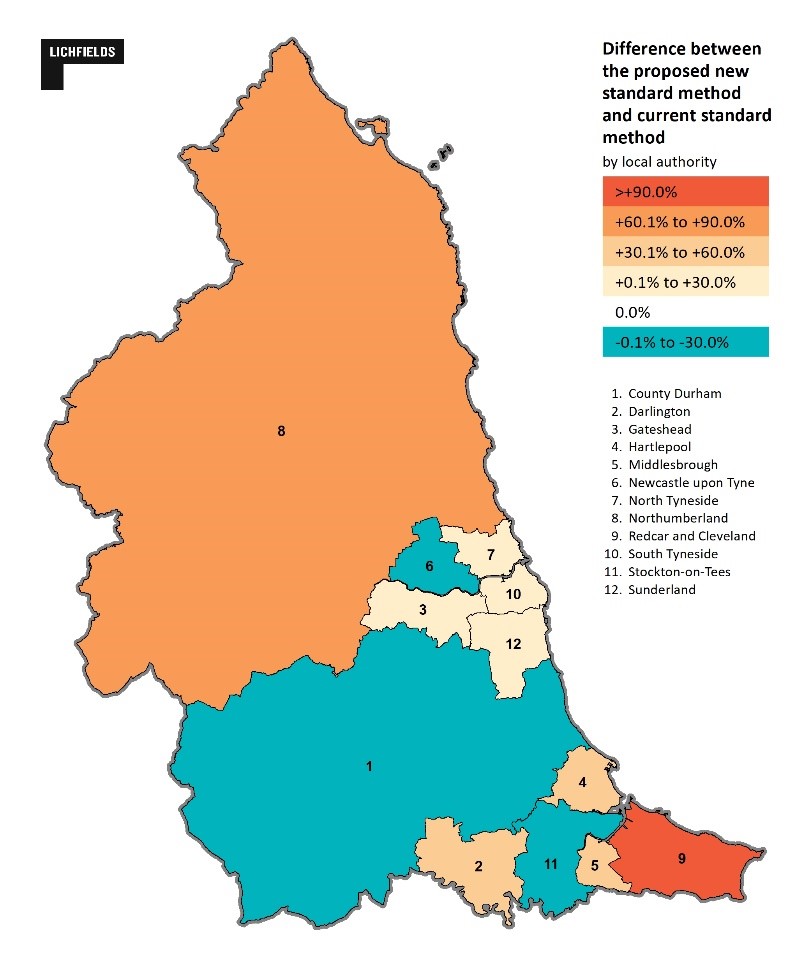
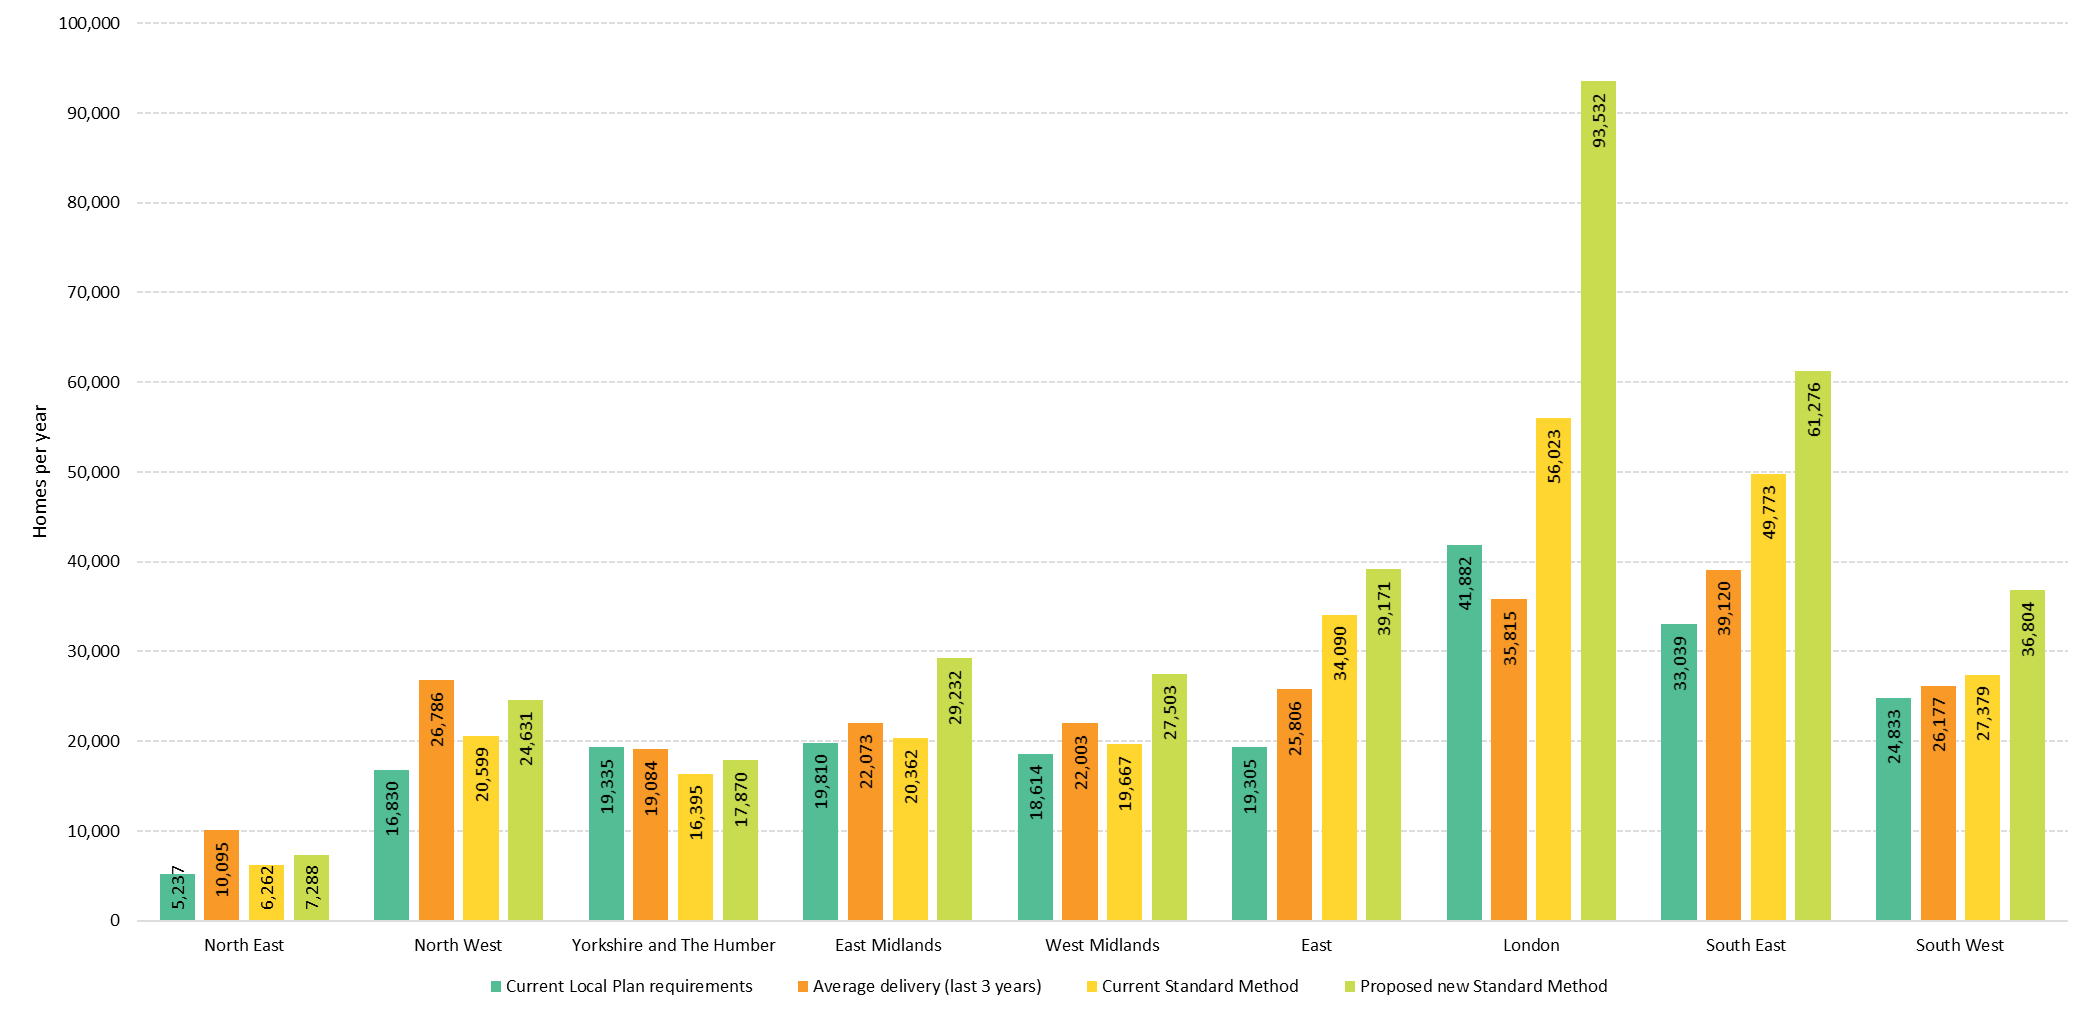
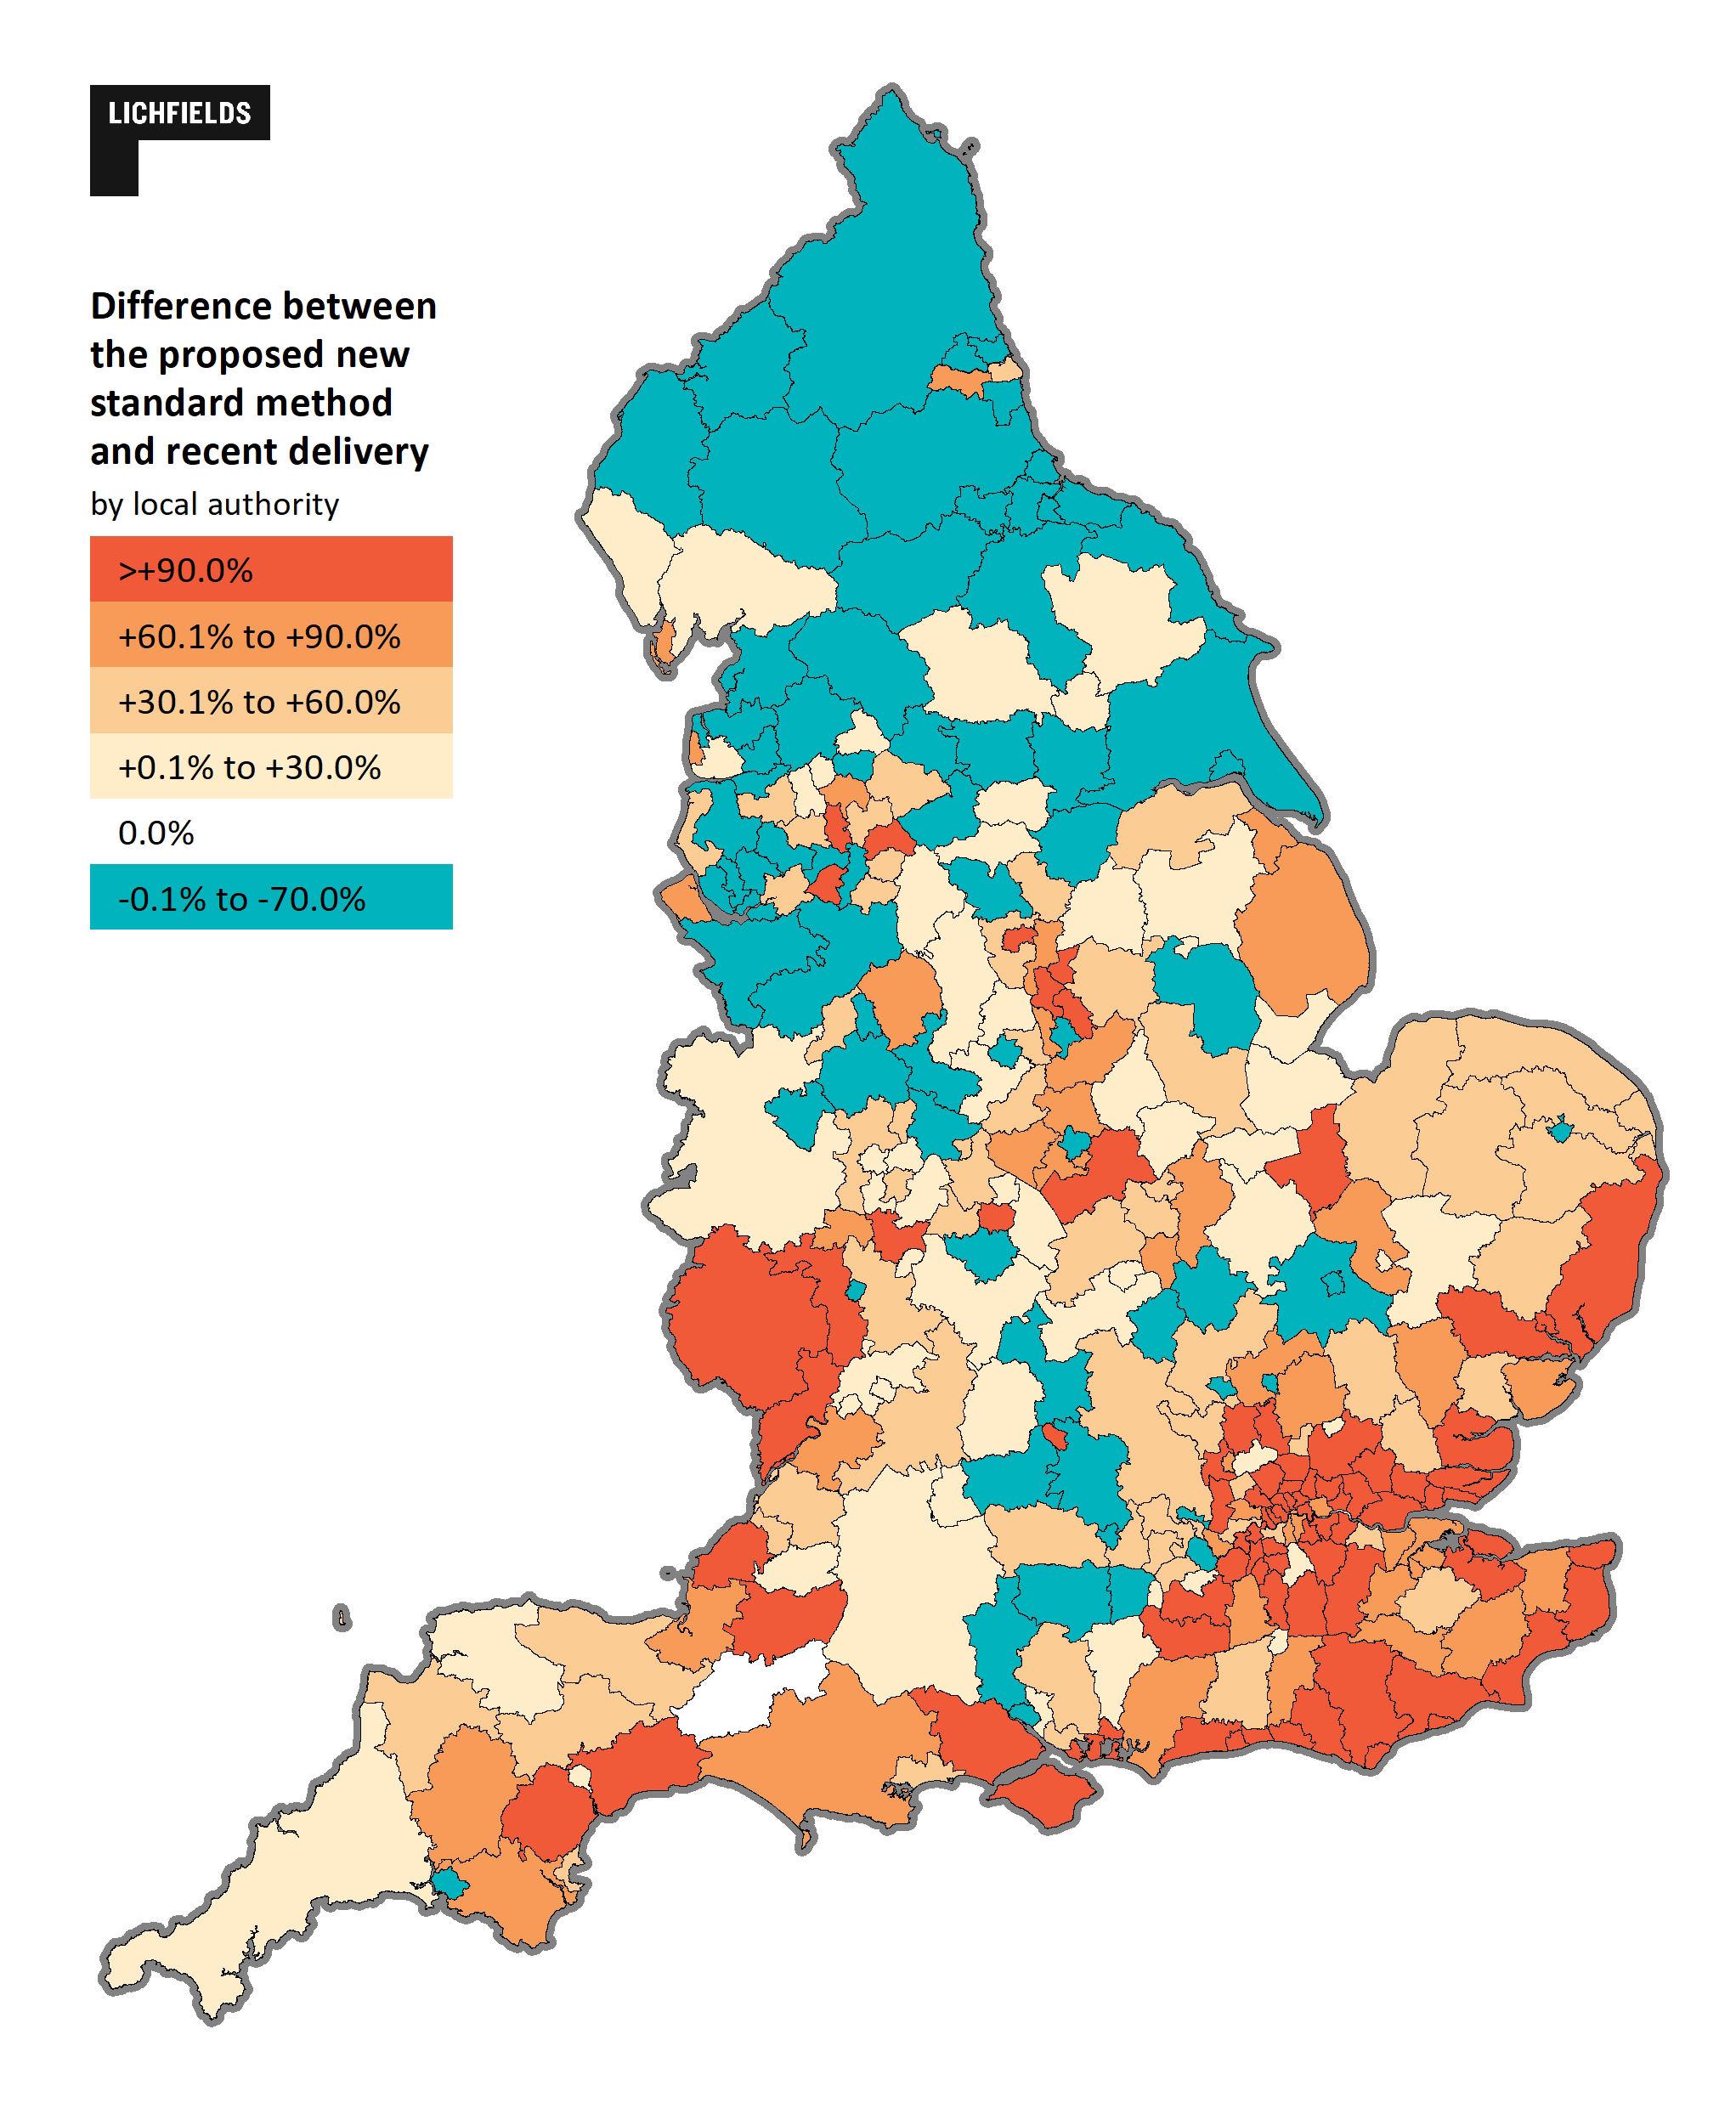
The preparation of local plans in England has become a ‘little’ more complicated in recent weeks (if it ever needed more complexity?). A new planning system is on the horizon, following the publication of the planning White Paper ‘Planning for the Future’. Shorter term changes are also proposed to the Standard Method for calculating local housing need, which has received much publicity recently[1] and Lichfields has already crunched the numbers and considered the different figures at a local level. While some of the output figures are on the high side (i.e. Westminster), other figures are surprisingly low (i.e. Liverpool).

For plan-making though, the combination of proposed introduction of a new Standard Method and a wholly new planning system really has thrown the cat amongst the pigeons. Each LPA will need to take stock and work out its next move. Will it be decided to have a ‘White Paper’ Local Plan, to try and rush through a NPPF (2019) Plan or even try to game the system?

This blog maps out the ‘plan-making’ road ahead: considering both the transition to a new planning system in the long term and a new standard method in the short term. Inevitably, this is a complex topic and just the transition itself will be complicated. We look to cut through the complexity here and to consider how LPAs might react in response to their different circumstances. There is some background to the different transitional arrangements, but if you already have some knowledge then you might want to skip ahead:


Contents 


01
 
 
02


The Road Ahead: White Paper Plans and the Standard Method 2

A new ‘White Paper’ planning system

We know that a new planning system is coming, underpinned by new legislation. We have looked at the proposals in-depth here. For this blog, the key thing to know is that the Government wants to give each LPA a binding housing requirement to plan for. This will take into account both housing need in an area (i.e. what the Standard Method currently provides) and relative constraints (or lack of) – i.e. a ‘policy on’ requirement[2]. Crucially, there is also an expectation that at least some ‘White Paper’ Local Plans will be adopted before the end of this Parliament and the next election in May 2024[3].
There are proposed transitional arrangements in terms of moving from the current system to the new ‘White Paper’ planning system[4]. Under the proposals, each LPA would have a statutory duty to prepare a new ‘White Paper’ Plan:
  • 30 months from new legislation coming into force for any LPA without a local plan adopted in the previous three years;

  • 42 months from new legislation coming into force for any LPA with a local plan adopted in the previous three years; or

  • 42 months from adoption of a current local plan that was submitted for examination prior to the new legislation becoming in force.
Working backwards, the new planning legislation will need to be in force by the end of September 2021 at the very latest, to enable a ‘White Paper’ Local Plan to be adopted before the end of Parliament. This takes account of a 30-month statutory deadline for LPAs without a Local Plan adopted in the previous three years and pre-election Purdah (following the dissolution of Parliament on 28th March 2024).

Standard Method 2

The proposed changes to the standard method are independent of the White Paper proposals and are described as ‘short term’. Looking back at previous changes to the NPPF (2018), a consultation commenced at the end of October 2018 and changes were published in mid-February 2019 – c. 4 months. On this basis, we could be looking at ‘Standard Method 2’ being in place before Christmas. However, to simplify our road map, we have assumed that the PPG is updated with the new ‘Standard Method 2’ on 1st January 2021 (a new year’s treat).
Transitional arrangements are proposed in the plan-making context (key to note that similar arrangements are proposed for five-year housing supply) to move us from the current ‘Standard method 1’ to the ‘Standard Method 2’. These are:
  • If an LPA has already undertaken a Reg.19 consultation, it has six months from the adoption of ‘Standard Method 2’ to submit its new plan for examination – by our timescales this would be the end of June 2021.

  • If an LPA hasn’t undertaken a Reg.19 consultation by the adoption of Standard Method 2, the LPA has three months to do so (i.e. by the end of March 2021) and then has a further six months to submit the plan for examination – i.e. the end of September 2021.
 

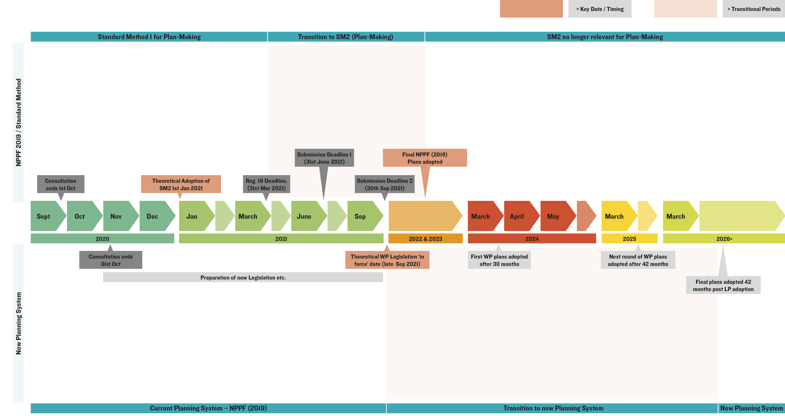
The ‘plan-making’ road map: the transition from the NPPF (2019) to a new planning system

The roadmap identifies a rough timetable for the adoption of ‘Standard Method 2’ and the new White Paper planning system. Obviously, this is based on a number of assumptions, including that the proposed transitional arrangements are implemented as proposed.

How might LPAs react

The circumstances for each LPA will be unique with politics likely to play a large role. However, there are some clear groupings in terms of potential outcomes.

Group 1: Those with a plan adopted within three years of legislation coming in to force

Taking a White Paper legislation ‘in force’ date of September 2021, for LPAs who have adopted a Plan since September 2018 (or will likely go on to adopt a plan from now up until that date) we can assume that its next Local Plan will be in accordance with the new White Paper legislation. Some with Plans on the boundary of September 2018 may be a little nervous as they could just fall through the cracks. 
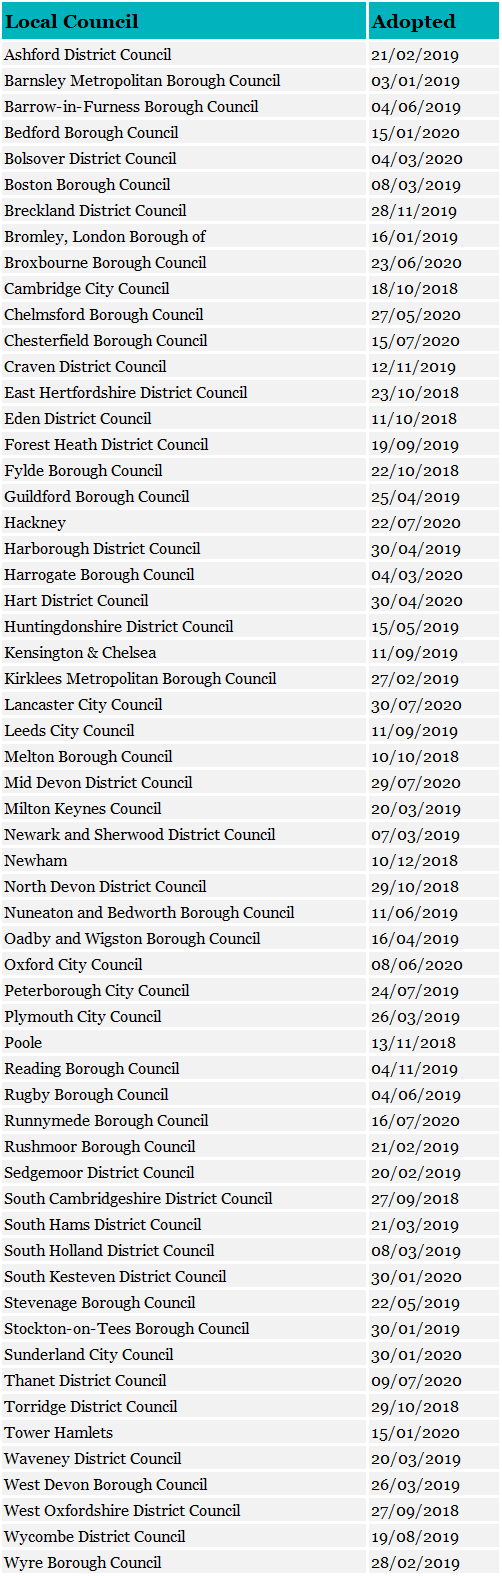
In any case, these authorities will then have 42 months to adopt said ‘White Paper Plan’: c. March/April 2025. Currently, there are only 59 LPAs that fall into this category. A list of these is included at the end of the blog.

Group 2: Those LPAs without a plan adopted within three years of legislation coming into force

The vast majority of LPAs currently fall into this group. The LPAs with Local Plans not already at Examination will be under a pressure to progress with plan-making under the current system and may well already be deep into plan-preparation. These LPAs have an incentive to adopt an NPPF (2019) compliant plan ahead of the new legislation. The incentive being an additional 12 months to prepare and adopt a future ‘White Paper’ Local Plan following the ‘in force’ date.
How each LPA will react in plan-making terms will most likely hinge on its proposed ‘Standard Method 2’ figure:


LPAs with a Standard Method 2 figure above the current standard method

Similar to previous transitional arrangements from the 2012 to the then 2018 NPPF, the new standard method might be the nudge to get on with plan-making for LPAs in this situation. You may recall a flurry of LPAs submitting local plans just before the transitional deadline to the 2018 NPPF. Missing this deadline would have meant that these LPAs Plans would have to be assessed against the then new Standard Method 1 (subject to constraints) instead of their own assessed housing needs.
These LPAs may, therefore, attempt to ramp up plan-making to adhere to transitional arrangements in order to submit a ‘Standard Method 1’ plan; thereby banking a lower housing requirement in the short term and buying more time to make a ‘White Paper’ Local Plan in the longer term. Many LPAs will already have spent many years investing in a new Local Plan with residents and businesses inputting throughout – so it only seems fair that they may take this route. Therefore, expect a flurry of Reg.19 consultations either side of the new year, with Plan Submissions to the Secretary of State following in the summer.
It may take a year or so from Submission of a Local Plan to its adoption: c. Summer 2022. From that point on, each of these LPA would have a further 42 months to prepare a ‘White Paper’ Local Plan – likely to be some time towards the back end of 2025 or 2026. This would give plenty of time to work out how to tackle whatever requirement figure the Government will mandate and gives time for the new system to bed in.
Of course, it is also worth noting that missing the ‘Standard Method 2’ transitional arrangements for these LPAs could have major plan-making implications. There is unlikely to be time to account and plan for a higher Standard Method 2 target, so many of these LPAs may have to wait for the White Paper system to come in to force and prepare a new Plan within the 30-month deadline.
 

LPAs with a lower Standard Method 2 figure

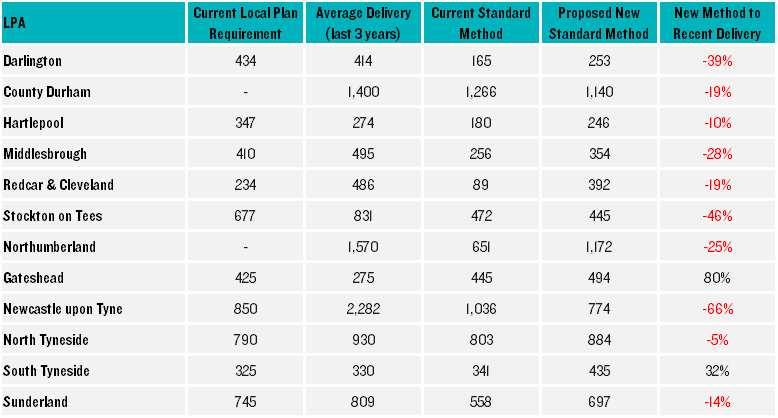
As a starting point, there will be many – most likely northern – LPAs with, what would appear to be rather low Standard Method 2 figures, when judged against said LPAs ambitions for housing and the ‘Standard Method 1’ outputs. These LPAs may simply ignore the ‘Standard Method 2’ figure even if they miss transitional deadlines and plan for a higher target; akin to the ‘Standard Method 1’ or even go further above that to meet housing/economic ambitions.
A cynic, though, could see a situation arise where an LPA is struggling to meet the Standard Method 1 figure, or is doing so begrudgingly (against local opposition) and, in such cases, these authorities may deliberately wait for the ‘Standard Method 2’ transitional arrangements to pass. That LPA could then subsequently submit a Local Plan for examination – using the ‘Standard Method 2’ as its basis of local housing need – just prior to the White Paper legislation ‘in force’ date. With examination of the Submitted Plan, plus a 42-month timescale to prepare a ‘White Paper’ Local Plan, these LPAs would buy themselves some breathing time to prepare for whatever the Government mandated requirement is further down the line. For these LPAs, they might adopt ‘White Paper’ Plans at the back end of 2025 or early 2026.
 

And for those LPAs willing to wait it out?

The above has assumed that LPAs will mainly want to have an NPPF (2019) Plan adopted ahead of the new White Paper legislation. This is chiefly to buy themselves time in the transitional measures to adopt a new ‘White Paper’ Local Plan: i.e. having 42-months (the carrot) instead of 30-months (the stick). But what about those who, by design or circumstance, become the early adopters of the new planning system?
For LPAs who are already struggling to plan for the ‘Standard Method 1’ figure, or where they are highly constrained, or where the Standard Method 2’ is also higher - waiting could, arguably, be in their favour. This would depend on the politics of the area, but it’s not hard to imagine an authority with Green Belt/AONB and vocal residents, where holding off plan-making under the current system would be a significantly less controversial option. Given that the White Paper proposes that LPAs will have a housing requirement dictated to them which specifically accounts for constraints, these LPA may decide to hold fire and chance a lower figure later down the line for its ‘White Paper’ Local Plan.
There will also be some LPAs who are in early plan-preparation stage, with less time and money invested, who might just wait. Why spend lots of local authority money on a Plan now, when there will be a statutory duty to prepare one within 30-months - potentially starting from Summer next year?
However, waiting for the new White Paper legislation also brings with it considerable risks and unknowns. A constrained LPAs housing number could well go up, as well as down. There could be delay in the legislation coming forward with legal challenges – leaving LPAs without an up-to-date local plan. This is also a new system after all, that is highly likely to have teething problems.
Finally, there is also the December 2023 deadline for all LPAs to have an ‘up-to-date’ local plan to consider. There was nothing in the White Paper regarding this deadline, nor any recent comments regarding it by Ministers. Assuming it is still in place, waiting to prepare a ‘White Paper’ Plan would mean missing this deadline. We don’t know what measures the Secretary of State would take in these circumstances.

Summary

There are many unknowns and permutations in our roadmap set out above. The introduction of the ‘Standard Method 2’ arguably makes the transition to a new planning system more complicated but may also result in some LPAs working quicker to bring about emerging plans. For those LPAs who end up waiting for the White Paper legislation to make their next Local Plan, there are significant risks and unknowns and so the question is whether local politicians will be willing to take the risk of the unknowns?
The only thing that is clear is that the transition from the current to the new plan-making system will complex. We will need to wait and see what comes out of the consultation process but in the run up to Christmas and over the next few years in general local plan life will be complicated. We will all need to be monitoring local circumstances carefully and consider how these interact with changes to national policy.
Of course, who could be better placed than Lichfields to help in this regard. Follow our blog for upcoming updates on what the various consultations means for local regions across the country. Also, contact one of our local offices if you have a more detailed query.
LPAs with a plan/review/DPD adopted since September 2018. LPAs that have adopted joint plans are individually listed below.


[1]
Housebuilding algorithm will lead to more developments in Tory areas, Johnson warned  https://www.bbc.co.uk/sounds/play/live:bbc_radio_fourfm
[2] Lichfields: Grow, Renew, Protect: The White Paper - ‘Top Down’ Housing Requirements
[3] Paragraph 6.3 of the White Paper[4] As detailed at Paragraphs 2.50 & 2.51 of the White Paper.

CONTINUE READING

Cause for concern? What does the new Standard Method mean for the North East?

Update 16 December 2020:
 

The launch of the proposed new standard method for local housing need on 6th August 2020 unleashed a media and political storm. An unfortunate cross-over with the problems of A-levels and GCSEs led to it being dubbed the ‘mutant algorithm’.
 
On 16th December, the Government sought to resolve matters, making a series of announcements across four publications: 
  1. A written Ministerial Statement
     
  2. Response to the Consultation on Proposed Changes to the Current Planning System
     
  3. Updates to the Planning Practice Guidance on Local Housing Need to set the new standard method approach
     
  4. A spreadsheet with the indicative figures from the updated method
     

What are the headlines and what does it mean? 
 

View blog

The current Standard Method for calculating housing need was introduced in 2018 and was intended to significantly simplify the process of establishing local housing requirements and improve the efficiency of the plan-making process. It was a step in the right direction but fell significantly short of the mark on a number of key points including reliance on authorities choosing to set a far higher requirement than their minimum figure to achieve the national 300,000 dwellings per annum (dpa) target and driving need into London and the South East whilst doing the opposite in the North – a point which is certainly at odds with the Government’s agenda to ‘level up’ the economic and social disparities between many northern and southern authorities.
On the 6th August, the Government announced proposals in its Changes to the Current Planning System document which seek to remedy the shortfalls of the current Standard Method; setting a much higher bar for many Local Authorities and resulting in an uplift to the national housing requirement of 35% against the current Standard Method - from 250,550 to 337,307dpa.
The recent blog published by my colleague Bethan Haynes explores the national implications of the Standard Method however, for the purposes of this blog, we consider what the new Standard Method means for the North East.

An Improvement on the Current Standard Method

Taken at face-value, the revised Standard Method has a positive outcome for the region – seeking to address some of the previous concerns raised about the impact of assumptions within the calculation on the North. Almost all authorities across the North East see an uplift against the current method (aside from Stockton-on-Tees, County Durham and Newcastle upon Tyne which see a 6%, 10% and 25% reduction respectively) resulting in an overall increase of 1,026dpa (from 6,262dpa to 7,288dpa) from the current Standard Method in the region - an uplift of around 16%. In theory this is a positive step and may see additional opportunities for land promotion in authorities where there is an uplift against the current Standard Method as Local Plans progress and/or are reviewed.

Contribution to the National Target

Delve a little deeper into the figures however and it becomes apparent that some of the issues with the previous Standard Method remain. First and foremost is proportionality of distribution; whilst the North East sees a 16% increase from the current to revised method this still falls well below the 35% national average uplift that the revised calculation brings and is in fact the third lowest proportional increase nationally (with only Yorkshire and the Humber at 9% and the East at 15% holding smaller proportions of the uplift).This shift also results in a reduction in the contribution that the region makes to the national total from the already inadequate 2.5% under the current method down to only around 2.2% - significantly below the region’s existing national household contribution of around 5%[1]. This is particularly concerning when measured against some southern regions such as London which will see a staggering 67% increase from the current method and which would constitute over 25% of the national total housing requirement alone under the revised method.

Restraining the Market

The revised method also still provides significantly fewer homes than recent delivery in the region – a clear spatial disparity for northern authorities compared with central and southern regions where the Method sets a need figure that is often far in excess of that which the market has been able to achieve.
For the North East, the shortfall between the proposed new method and recent delivery is around 2,800 dwellings per annum – over 25% of the average supply delivered across the region in the last 3 years. Whilst it must be acknowledged that this is an improvement against the current standard method position (which sees a shortfall of around 3,800dpa) it still falls far short of the numbers currently being delivered in the region and would effectively restrain the North East housing development industry.
At a Local Authority level only two of the 12 authorities see an uplift against average recent delivery (Gateshead and South Tyneside) with some others falling well below the mark – most notably, Newcastle upon Tyne would see a 66% reduction against recent delivery.

Why does the Standard Method have these Impacts?

The new Standard Method is more complex than the original, moving away from the Government’s intention to make the process simple, transparent and understandable for non-experts. Whilst we are still analysing its mechanisms, it is clear that   Step 1 of the proposed Method still results in a low starting point upon which Step 2 is applied. It has been widely acknowledged (including by the Government) that an over-reliance on population projections provides an inadequate basis for calculating housing need due to the way in which they continue patterns of historic undersupply in the region.
Whilst the new Standard Method includes an alternative increase based on the size of the existing stock (if that is higher than the population projection), for most North Eastern authorities this isn’t enough (a 0.5% increase is used despite the Government acknowledging that annual growth is typically 1%) to overcome the constraints imposed by the baseline starting point for the Standard Method.
The Government’s intention to use the Standard Method to address affordability problems means that, when considered nationally, the North East’s affordability problems appear relatively less significant. This means that the part of the equation that boosts supply based on unaffordability is heavily skewed towards the acute problems with this issue in some southern authorities. It therefore doesn’t lift the North Eastern authority’s figures high enough to recover from the baseline starting position earlier in the equation.
In fact, housing need is based on a wide variety of factors, often with complex interactions. For example, the Government’s own consultation document refers to regeneration and stock mismatch due to insufficient homes of the right size, type and tenure at paragraph 19. However, the Standard Method largely disregards these factors and focuses solely on affordability, meaning North Eastern authorities’ ability to transform their areas, meet local housing needs and drive economic growth is constrained. Whilst each authority can choose to enhance its Standard Method figure, previous research by Lichfields has confirmed that in reality this does not occur sufficiently.    
 

Conclusions

There is therefore huge cause for concern; whilst the overall increase in housing need figures will bring opportunities in some areas, the revised Standard Method would actually lead to harmful impacts for the North East. The disparity with previous delivery and the reduction in proportional distribution (particularly at a national level) are key areas of concern and risk restricting growth across the region to a level well below that which the market has delivered in recent years. Far from ‘levelling up’ the country, the new Standard Method could actually exacerbate the problem.
Opportunities however still exist - unless a dramatic increase can be achieved and sustained from the recent peak in delivery of c.40,000dpa the housing requirement set for London is likely to underdeliver by at least 50,000 units per annum . This alone would mean 300,000dpa nationally is not achievable without other regions delivering significantly more homes than the current and revised methods make provision for. The North East may hold part of the solution to this – if the revised standard method could ensure a more proportional distribution of the housing requirement across the country and seek to set much more ambitious minimum figures in authorities which have demonstrated they can deliver well in excess of the current and proposed methods (as many in the North East have) this would offer multiple benefits by reducing the over-reliance on London to achieve the 300,000dpa target and driving more clearly towards the Government’s ambition to ‘level up’ the country with all of the associated economic and social benefits that would bring for the North.
Changes to the Standard Method to achieve this could involve tweaks and adjustments to the Government’s equation (a greater increase based on the existing housing stock or an adjustment to the affordability multiplier for example). However, the solution may lie in recognising that it simply isn’t possible to standardise such a complicated matter, which becomes many times more complex when the huge variations in conditions across the country are taken into account. A more nuanced and subtle approach is required linked to the specific circumstances of each authority. That could mean returning to the pre-Standard Method approach and introducing a lesser degree of standardisation but still allowing for the crucial adjustments needed to reflect local circumstances such as historic growth, economic growth and spatial strategies. Whilst that won’t be a (relatively) simple equation, it should produce far more appropriate outcomes for more authorities and prevent the extreme positive and negative results generated by the Standard Method.
We are currently undertaking more research for various organisations to understand why the equation produces such negative results for the North East and how this can be rectified. The Government’s consultation on the proposed revised Standard Method closes at 11:45pm on 1 October 2020. Please get in touch if you are interested in making representations.
For implications of what the New Standard Method means for other regions, see below perspectives:
London   |   North West   |   Thames Valley   |   South West   |   West Midlands   |  Yorkshire and The Humber

[1] ONS 2018-based household projections for local authorities and higher administrative areas within England, Table 406


CONTINUE READING

Keeping up with the numbers: what does the proposed standard method mean in the Thames Valley?

Update 16 December 2020:
 

The launch of the proposed new standard method for local housing need on 6th August 2020 unleashed a media and political storm. An unfortunate cross-over with the problems of A-levels and GCSEs led to it being dubbed the ‘mutant algorithm’.
 
On 16th December, the Government sought to resolve matters, making a series of announcements across four publications: 
  1. A written Ministerial Statement
     
  2. Response to the Consultation on Proposed Changes to the Current Planning System
     
  3. Updates to the Planning Practice Guidance on Local Housing Need to set the new standard method approach
     
  4. A spreadsheet with the indicative figures from the updated method
     

What are the headlines and what does it mean? 
 

View blog

This blog is the latest in a series exploring the potential implications of the proposed standard method across England. See our other blogs on the South West, Yorkshire, North West, West Midlands and London. This blog is also an extended version of a blog originally published online in the Thames Tap.
The last week or so has seen most of us planners really beginning to fully digest some of the proposals set out in the Planning Reform paper and thinking about what impact they could have on the system and our country as a whole. It’s no surprise that the issue of housing numbers remains at the forefront of the proposed changes and the Thames Valley highlights some of the possible difficulties which could be faced in planning for housing in such a high demand area which is subject to significant constraints.

How did we get here?

The current standard method first appeared in the 2019 NPPF and assesses household growth and affordability (the ratio of prices to incomes, as of now) to generate a figure of ‘local housing need’. However, a judgment was still needed at the local level as to whether this need could be met in full, under NPPF para 11b ([i] and [ii]). After less than 2 years of being in place, Government has now decided that a refresh of the standard method is needed (read more about the background to these changes here), with some significant changes;
  • Firstly, it raises the bar – nationally. The current method yielded around 270,000 homes a year when it was published; now Government has set the bar higher (337,000, to be exact), hoping this will increase the likelihood that 300,000 will be delivered;

  • Secondly, it seeks to ensure that the baseline figure for housing isn’t unduly low as a result of household projections by introducing a ‘floor’ of 0.5% of stock;

  • Thirdly, Government has placed a renewed emphasis on affordability – a change which has had a significant impact on numbers in the Thames Valley. The idea that homes should be built in high demand areas, where people want to live (as indicated by a high affordability ratio) has been a longstanding view of Government. Although the current method does apply an uplift based on how unaffordable an area currently is, the new method goes even further. It now also includes an adjustment based on how much worse an area’s affordability has got in the last 10 years;

  • Finally, the cap which was previously in place (40% above the projections or plan requirement, depending on the age of plan) has gone. This represents somewhat of a change of tune from Government; having previously said that a cap was needed to ensure numbers were “deliverable”, it’s now of the view that applying a cap is “not compatible” with the step-change which is needed to boost supply as quickly as possible. Coupled with the new enhanced affordability uplift, its easy to see why many parts of the Thames Valley have seen their number substantially increase.
On top of all these changes, the standard method for assessing local housing need is now not the only step in the process. In due course, Government is set to publish housing requirements - a second stage where the numbers reflect not only housing demand (as indicated by the method for assessing local need set out in the proposals), but also land supply factors. But more on that later.

What does this mean in the Thames Valley?

These changes have led to some significant changes in housing numbers in the Thames Valley (see Figure 1 which compares the proposed method with the current method, and see the figures in full here).
Figure 1 – Difference between proposed new standard method and current standard method for local authorities in Thames Valley

Source: Lichfields analysis

Worsening affordability - the primary driver of higher numbers in the Thames Valley

With every single authority in the Thames Valley seeing their affordability ratio worsen in the last 10 years (by an average of 43%), the increased emphasis on affordability in the proposed method has had a huge impact – every authority has a greater affordability uplift under the proposed method than the current method (see Figure 2). Under the current method, many authorities have an uplift of around 30%, with an overall average of 46% (albeit this is before any caps are applied). Under the proposed method, the uplift exceeds 100% (i.e. a doubling of the baseline) in virtually all areas, with an average uplift of 130%. Bracknell Forest has seen the highest increase in the affordability ratio up from 5.6 in 2009 to 9.3 as of 2019, which means it’s housing number is now subject to a 128% uplift, compared with just 33% under the current method. Similarly, the ratio in Reading has gone up from 6.4 to 9.1, increasing its uplift from 32% to 99%.
Figure 2 – Affordability Ratio (2019), uplift under current standard method and uplift under proposed standard method for local authorities in Thames Valley

Source: Lichfields analysis based on ONS affordability data

As well as more significant affordability uplifts, some authorities such as Cherwell, Vale of White Horse and Wokingham, have also seen their numbers increase because their baseline has increased. In Wokingham for example, the baseline in the proposed method is 672 (based on the 2018-based household projections) compared with 544 under the current method (2014-based). Under the current method, Wokingham’s figure of around 800 was not miles away from it’s current plan requirement of 662 (and still well below recent delivery which has been around 1,200 per year). Yet the current method still created something of a stir locally, with the Council seeking to argue ‘exceptional circumstances’ and put forward a number lower than the current method in its emerging plan[1]. With the proposed method doubling the number – from around 800 to over 1,600 – one can only imagine what the Council’s reaction will be this time around.

Oxfordshire

As part of one of most important economic sub-regions in the UK – the Oxford-Cambridge Arc - housing growth in Oxfordshire is a key part of economic success of the area and indeed the country as a whole. Understandably then, planners and commentators are keen to understand what the proposals mean for the county.
Oxfordshire is an interesting case; whilst the proposed method yields significant increases compared with the current method in every authority, the situation is perhaps not quite a severe as it seems. The Councils were already planning for an ambitious housing number, having agreed to deliver around 5,000 homes a year as part of the Oxfordshire Housing Deal (a figure also deemed necessary to support economic growth, as identified in the Oxfordshire SHMA[2]).
At the moment, some 4,000 homes a year are planned for in Local Plans across the county, but we can expect this to increase after South Oxfordshire adopts its plan and others review theirs to include Oxford’s unmet need. The current standard method yielded a somewhat unambitious figure of just over 3,000 per year, but because of plan progress in the county (combined with the Housing Deal) these numbers were largely meaningless – they were unlikely to lead to any reduction in housing targets in plans in Oxfordshire. The proposed method however is up at around 4,800 per year – remarkably in line with housing delivery seen in recent years (c.4,700) and also similar to the figure of 5,000 per year which is considered to be needed to support economic growth. So, despite the sea of ‘red’ across Oxfordshire in Figure 1 above (indicative of the increase between the current and proposed methods), the figures under the proposed method might not be such a shock to the system in the Oxfordshire authorities as a first glance suggests.

Slough

Slough is the only authority to have seen a decrease, and this is because of the lower baseline (279, compared with 659 under the current method). This means that, even with its greater affordability uplift, the number is still down compared with the current method (597, compared with 863). Although recent delivery in Slough has been strong, with an average of c.600 homes a year completed in the last 3 years (well above the local plan requirement of c.300 per year), with a limited and finite supply of housing land, it is questionable whether Slough can sustain delivery at a level to meet this figure.

What about the future?

Despite all of this, its important to remember that the proposals for the new standard method set out in the Planning Reform proposals represent only the first part of [what will eventually be] a two-step process. The proposed method as set out in the proposals generates a figure for local housing need, reflective of stock, household projections and affordability. But, there is a second part, which seeks to address a multitude of other factors; the size of existing urban settlements, the extent of land constraints, brownfield opportunities and demand for other (non-residential) uses. This would give the housing requirements that local authorities would need to plan for. At the moment, it is for Councils to assess to what degree they can meet their need, as far as is consistent with the NPPF (para 11b). In effect, Government would take over the task of doing this, giving authorities a number which also reflects land supply and constraints.
A simple task? Almost certainly not. There are clearly lots of factors to take into account (brownfield land supply, the extent of constraints, affordability pressures) which need to be carefully balanced against one other, and the circumstances in every single local authority in the country are different. The Thames Valley is the prime example of the difficulties in the balancing exercise; it contains some of the least affordable authorities in the country outside London, but yet many of these areas are almost entirely covered in areas the Government is seeking to ‘protect’ – Green Belt, AONB, etc. In Windsor and Maidenhead, for example, house prices are nearly 14 times local incomes, yet the authority is 84% constrained (based on Green Belt and NPPF footnote 6 constraints, rising to 99% if you once urban land is accounted for). Similarly, Oxford’s housing pressures are well documented and house prices are now 11.5 times local earnings, yet the authority is over 80% urban, and most of what’s left is constrained, meaning overall 98% of land is either constrained or already built on. There is certainly no ‘right’ answer to the question ‘how do we balance the demand for housing whilst also taking into account environmental, policy and physical constraints which exist’?
At the moment we aren’t sure how exactly Government will go about this crucial balancing exercise; it seems unlikely that some of the relevant factors can simply be totted up in a spreadsheet and applied in a formula (as Government has done with the standard method to date). And how quickly can it implement all this; we must remember that Government wants every authority to have a plan in plan by December 2023. In short, it needs to come up with these housing requirements, and quick. Councils, planners and local residents in the Thames Valley will no doubt be eagerly awaiting more detail on this next – and arguably crucial - step in the planning process.
For implications of what the New Standard Method means for other regions, see below perspectives:
London   |   North West   |   South West   |   West Midlands   |   Yorkshire and The Humber

[1] See https://www.wokingham.gov.uk/_resources/assets/attachment/full/0/508844.pdf[2] See http://www.southoxon.gov.uk/sites/default/files/2014-04-14_Final%20SHMA%20Report.pdf


CONTINUE READING