Planning matters

Our award winning blog gives a fresh perspective on the latest trends in planning and development.

The Liverpool City Region’s Spatial Development Strategy:  Show me the numbers!
Following approval by the Liverpool City Region Combined Authority [LCRCA], a public consultation on the Liverpool City Region [LCR] Spatial Development Strategy [SDS] commenced on 10th November and will run up to the 1st February 2021. This consultation represents the second public engagement on the SDS, following an initial consultation exercise in 2019.
This blog assesses the key content of the consultation, and explores whether the objectives of the LCRCA can realistically be achieved through its proposed strategy for housing and economic growth.

What is the LCR SDS?

The SDS will set out a spatial planning framework for the LCR for the next 15 years, covering the City of Liverpool and the Metropolitan Boroughs of Knowsley, St Helens, Sefton, Wirral and Halton.
The SDS will be different to the Greater Manchester Spatial Framework [GMSF] in that it will not allocate housing and employment sites throughout the region and will not make changes to Green Belt boundaries. In the LCR, these policies will be contained within the development plans for the constituent local authorities.
Based on the recent struggles experienced by the Greater Manchester Combined Authority in adopting the GMSF (see my colleague Brian O’Connor’s blogs on this topic[1]), this key difference may lead to a quicker adoption of the SDS – but does it really harness the huge potential of the City Region?

Purpose of the Current Consultation

It is encouraging to see the SDS progressing and taking shape despite complications presented by the pandemic.
In terms of its content, the consultation is focused on the overall vision for the SDS, and is based around 5 key strategic objectives and policy areas (see Figure 1):
Figure 1: 5 Strategic Objectives of the SDS

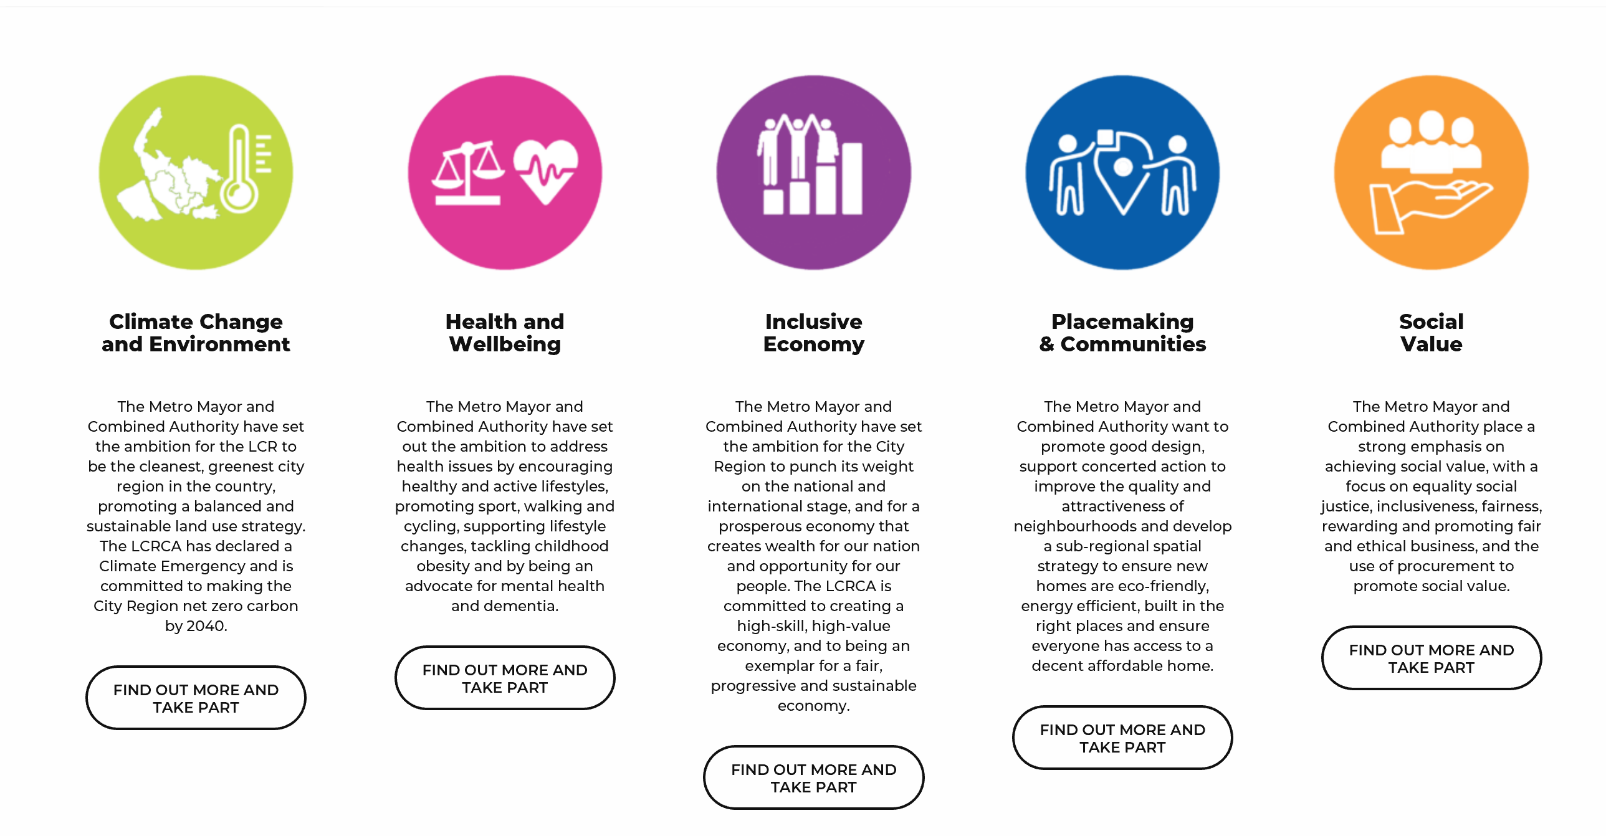
Source: Liverpool City Region Combined Authority

These objectives are well-intentioned starting points from which to develop detailed policies.  The LCRCA is obligated to address key themes such as climate change and health and well-being, and has also sought to pursue an inclusive growth strategy alongside this with a clear focus on promoting social value and creating high-skilled, quality employment across the City Region. 
There is significant merit in this approach, which if addressed effectively alongside an ambitious plan for housing and economic growth, will benefit both current and future generations living and working within the LCR.   
However, my concern with the LCR is not necessarily what it is saying at this stage - which are generally high level aspirations that in many cases are difficult to disagree with - but what it remains silent on.  There is next to no detail on what will ultimately be the most crucial (and most controversial) aspects of the SDS, namely the scale of housing and employment need and its spatial distribution across the LCR. 
Although this is expected to be published in the next round of consultation in Summer 2021, it is difficult to be too enthusiastic about the latest draft without understanding the direction of travel that its growth agenda will ultimately take.
It is acknowledged that the LCR had sought to wait for the outcome of the Standard Method review, though question marks remain over the general approach being pursued by the Combined Authority.

Scaled Down Ambitions?

In the context of the Government’s aim to try and ‘level up’ the north, there is a considerable opportunity for the LCR to take a leading role for growth and set ambitious housing and employment targets which go above and beyond.
However, the LCR will not be reviewing or releasing Green Belt through the SDS, and will instead pursue a ‘brownfield first’ approach to development.  Targeting brownfield land first signifies a policy compliant approach which ties in with Government objectives – though it arguably does not represent an ambitious ‘pro-growth’ plan.
It is widely acknowledged within the industry that there are significant viability issues associated with developing brownfield land within the City Region, and the LCRCA has itself acknowledged this by seeking significant levels of funding from Government to unlock these sites for development.
However, there is currently no indication as to how much funding the LCR will be receiving, and there are obvious question marks as to whether the amount due to be handed down will enable the LCR to fully address the scale of the viability issue.
Furthermore, the Standard Method 2.0 will lift the housing numbers for Liverpool City by over 35% (as explored below), and even more land in the urban area will therefore be required to accommodate this hugely increased need.  

Impact of the Standard Method 2.0

The Government launched the new Standard Method for local housing need on 6th August 2020.  However, the Government revised its approach and issued further updates to the Standard Method on 16th December, simply reverting back to the method it introduced in 2018, but with a modification to top up numbers in the 20 largest cities and urban areas by 35%[2].
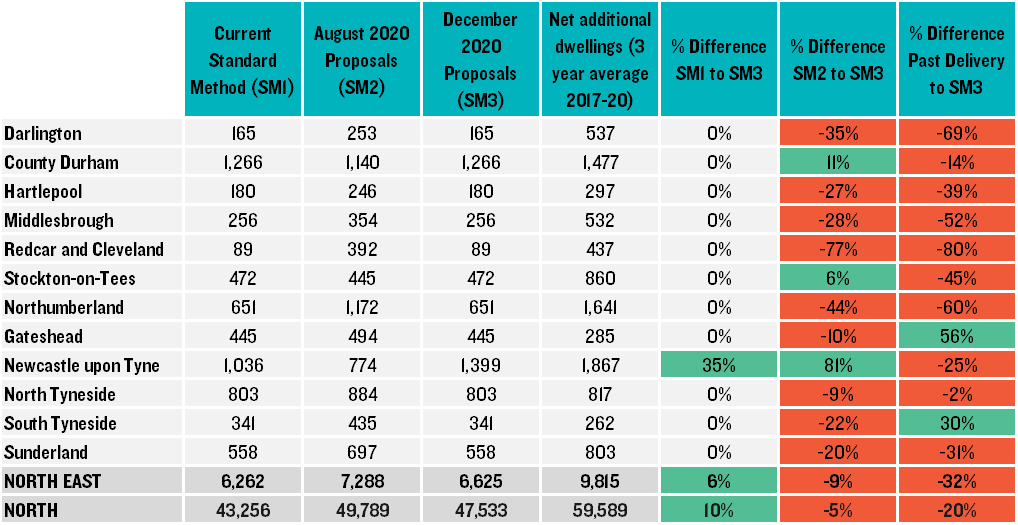
This 'cities and urban centre uplift' of 35% applies to the City of Liverpool, which results in an increased need of almost 545 dwellings per year from the previous Standard Method figure (see effect of the uplift in Table 1 below).

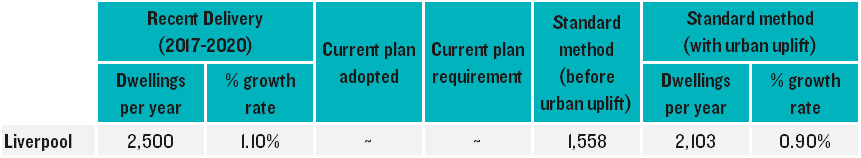
Source: Planning matters: Mangling the mutant: change to the standard method for local housing need

The uplift represents a reduction on recent delivery (2017-2020) of 397 dwellings per year, which on face value would suggest that accommodating this increased need may not be an issue, as they have recently been delivering far in excess. 
However, the uplift is expected to be met by the cities and urban areas themselves rather than the surrounding areas, with brownfield and other under-utilised urban sites prioritised[3].  For the City of Liverpool this increase will predominantly need to be met on land within the urban area.  With brownfield land already in scarce supply, this could create problems further into the next plan period.
It will be interesting to see whether this uplift influences the proposed approach being taken by the LCR, or if they continue along the same path regardless.

Where will the houses go?

The factors outlined above leads me to one main question:  
  • How does the LCR seek to tackle deprivation across the region and pursue objectives outlined in the current consultation (such as inclusive growth and achieving social value) and yet rely solely on delivering brownfield sites, the majority of which will only be viable with significant funding from Government?
It is unrealistic to consider that a ‘brownfield first’ approach will provide even the bare minimum of land required, particularly with the additional 35% uplift also applicable in Liverpool. 
Furthermore, delivering housing solely on brownfield land in the urban area is likely to result in the delivery of predominantly higher density development (i.e. apartments).  Over the last twenty years, the majority of new housing delivery in Liverpool City (some 90%) has taken the form of flats.
A continuation of this approach neglects a clear need for a wider mix of market and affordable housing in the LCR, particularly the delivery of homes with gardens or outdoor amenity space.  The demand for traditional family homes with gardens is also likely to have increased as a result of the pandemic as people reflect on their living environments. 
It is likely that the LCRCA will need to do 2 things in order to address this and achieve its overall vision and objectives:
  1. Balance the ‘brownfield first’ objective by identifying additional sources of land, such as Green Belt.
  2. Pursue an arrangement to distribute any unmet need across the City Region through the Duty to Cooperate.
Based on evidence from around the country (including Greater Manchester), distributing any unmet need across constituent authorities has proven to be a painstaking process, and is rarely completely successful when numerous local authorities are involved dealing with large housing numbers within complex urban areas.
Green Belt release will obviously be met with widespread objection.  
The LCRCA may therefore view these options as undesirable, but could be left with no viable alternative.  Clear answers on this issue will need to be provided by the Combined Authority through the next consultation.   

Final thoughts

Preparation of an ambitious, ‘pro-growth’ spatial plan presents a significant opportunity for the LCRCA to take a leading role for growth in the North West, helping to deliver the Government’s levelling up agenda and tackling the deprivation experienced across the City Region. 
This consultation provides a (tentative) first step on this path providing very limited detail on key issues, but does identify a number of important high level objectives centred around achieving inclusive growth, promoting social value and responding positively to health and well-being in light of the COVID-19 pandemic. 
However, looking ahead, the Combined Authority must seek to do more than just provide the bare minimum in terms of housing and economic growth in order to realise its objectives.
One only has to look down the East Lancs Road to see an example of a cautionary tale in spatial plan preparation, with the GMSF failing in its ambitions for achieving aspirational growth for the Greater Manchester sub-region. 
Preparation of the framework has been plagued by mixed messages from politicians, a suppression of growth needs despite all available evidence, and an overriding reluctance to release Green Belt land.  This has led to consistent infighting amongst constituent authorities, considerable delays and ultimately a failure of the plan making process.
It is hoped that the LCR takes note of this and seeks to avoid the same pitfalls and failures moving forwards.  The next engagement is key to identifying ambitious housing and employment land targets – and perhaps an entirely different spatial approach – in order to shape the SDS into a positive and transformational spatial plan for the City Region.
 

[1] Planning matters: The three certainties in life: death, taxes and delays to the GMSF | Planning matter: GMSF 2020 in a nutshell[2] Planning matters: Mangling the mutant: change to the standard method for local housing need[3] PPG Paragraph: 035 Reference ID: 2a-035-20201216

Image credit: Neil Martin on Unsplash

CONTINUE READING

Round and round in (almost) circles – initial thoughts from the North East on the new new new (!) Standard Method
The issue of housing need and the number of homes being planned for is really important and it’s great to see it getting more airtime and column inches in the mainstream media. But has this led to yet another kneejerk reaction that will result in harmful outcomes for the North East?
When reading the news of the Government’s latest proposals for the Standard Method, I was reminded of an episode of The Thick of It where beleaguered MP, Nicola Murray, pleads “That WAS a U-turn! If I do another U-turn it’s an O-turn.”
The latest iteration of the Standard Method, which has been causing consternation (albeit for different reasons) amongst planners, developers, MPs and the general public since its proposal in 2017, will largely return to the approach suggested previously, with a single modification that falls considerably short of those which its various critics advocated during the recent consultation.
As set out in Lichfields’ recent blog, the Government has now announced that the Standard Method will largely remain that which was first introduced in 2017. The only difference is that an uplift of 35% is applied to the 20 largest cities across England. For the vast majority of LPAs, including 65 of the 72 LPAs in the North, there will be no change in their housing need figure. As a result, it is hard not to feel that a great deal of time and effort has been expended to arrive back at somewhere very close to where we started out over three years ago – and there was broad consensus that that approach wasn’t fit for purpose!

How does the Standard Method work and why is this a problem in the North?

The formula which underpins the new (SM3 - the third and what now seems likely to be the final) version of the Standard Method uses the 2014-based household projections to identify a demographic baseline for each local authority (LPA), which is then uplifted to address local affordability and is finally capped (if needed) based on the age of the LPA’s Local Plan. The ‘cities and urban centres uplift’ is then applied to this figure.
The problems (particularly for the North) with basing the Standard Method on the household projections, has been extensively discussed by Lichfields. The projections are based on historically low population growth which was followed by suppressed household formation rates experienced during the 2008 recession. As a result of the projections being based on past trends, these are perpetuated in future projections. This is acute in the North, where the recession had a particularly significant impact. Given that the newest version of the formula is, for most LPAs, unchanged, it is unsurprising that these issues remain. The increased age of the projections still being used in the SM only compounds these problems.
As a result of the artificially and excessively low baseline, the affordability uplift is largely irrelevant for most northern LPAs, where affordability ratios are typically lower than in the South of England. The third stage of capping the resulting Standard Method figure is irrelevant in the North, as the Standard Method outputs are lower than housing requirements set out in Local Plans.

An opportunity missed?

SM3 results in an overall national figure of 297,600, which is closer to, but still below, the Government’s target of 300,000 new homes each year. It is also significantly less than the figure of 337,300 dwellings per annum generated by the version of the formula consulted on in August 2020 (SM2). The reason why that figure was so high was to ensure that even after some LPAs had justified the use of a housing requirement lower than their SM2 figure, the 300,000 home target could still be achieved.
The difference between the two methods is stark in the North; SM3 results in a figure of 47,500 dpa, higher than the figure of 43,300 dpa generated by SM1 (the current version of the Standard Method), but significantly less than the 49,800 dpa identified by SM2. More significantly, and worryingly, the SM3 figure is over 20% less than the average number of homes actually delivered across the North in each of the past three years - 59,600 dpa.
Figure 1 Comparison of Standard Method approaches for the North

Source: Lichfields

In the North East, the discrepancy between SM3 and past delivery levels is even greater; SM3 results in a total of 6,625 dpa, compared to the average delivery levels of 9,815 dpa, a decrease of 32%. Indeed, SM3 exceeds past delivery levels in only two of the 12 North East local authorities (Gateshead and South Tyneside), even with Newcastle’s ‘cities and urban centres’ uplift.
Table 1 Comparison between original Standard Method, August and December proposals and past delivery

Source: Lichfields (Figures correct as of Dec 2020)

SM2 was considered a moderate improvement on the original approach when applied in the North East (although a number of issues remained unaddressed). The major difference was that the revised approach used the higher of the 2018-based projections or 0.5% of existing stock as the baseline. As a result, the proposed figure across the North East was significantly closer to past delivery rates than when projections alone are used (as in SM1 and SM3). 
Additionally, a stock-based approach provides a much more stable method to identifying a baseline position, as it is based on the number of existing homes in an area which does not experience the significant fluctuations observed through projections, which are updated every two years.
Finally, SM3 reverts to using the 2014-based projections, despite the fact that two sets of projections have been released since. In their rationale for retaining the current (SM1) approach, the Government state that although use of the 2018-based projections has been carefully considered, “due to the substantial change in the distribution of housing need that would arise as a result, in the interests of stability for local planning and for local communities” the 2014-based projections should be used instead[1]. This approach seems counter-intuitive given the importance of using up-to-date evidence, including within the Standard Method itself (affordability ratios) and does not seem like a long-term solution as we move further away from 2014. In the North it causes decline rather than stability.

20’s plenty…or is it?

As shown in Table 1, in the North East only Newcastle sees a difference in SM3 when compared with SM1. For every other LPA, the Standard Method is back where it started, with all the associated problems. This is because only Newcastle is within the 20 cities to which the 35% cities uplift is applied. Looking more broadly, seven (Newcastle, Manchester, Liverpool, Leeds, Bradford, Sheffield and Hull) of the 20 cities are found within the North.
The uplift is only applied to the LPAs which contain the largest proportion of the population for each of the 20 cities identified (with the exception of London, where an uplift is applied to all Boroughs). This approach is problematic for a number of reasons, as discussed in my colleague Harry’s blog. Specifically in the North East, Newcastle is part of a much larger functional economic and market area that extends into Gateshead, which shares a local plan with Newcastle, and North Tyneside. Both areas play key roles in supporting the wider city. However, under the proposed method, these authorities will receive no uplift to their housing need figure.
Although Newcastle appears able to accommodate the entirety of the uplift, concerns have been raised previously about the proportion of housing delivered in Newcastle that is student accommodation and city centre apartments compared to family housing.
It is also unclear why the Government has chosen 20 cities and a 35% uplift. At face value, both would seem to be arbitrary figures. Why not apply a lower percentage uplift to a larger number of cities, which would help to ensure figures remained deliverable, whilst maintaining the Government’s aspiration to direct more growth to cities and urban areas? This might have the added benefit of directing a greater proportion of the national housing need to cities in the North, supporting the Government’s levelling up agenda.
Finally, the Government’s strategy behind the SM3 is that the urban centres are the most sustainable locations for large amounts of new housing, they have the largest supply of brownfield land and often the most acute affordability problems. That appears laudable in theory but, in reality, there could be problems:
  • Is there enough brownfield land to meet these needs? Is it in the right locations? Is it suitable for the type of housing that is needed? Can it be developed viably? If plenty of suitable, viable and available brownfield land exists, why has it not already been developed?

  • 14 of the 20 cities are constrained by Green Belt[2] or Metropolitan Open Land. Newcastle took the bold decision in their Core Strategy to release land from their Green Belt which has supported their recent healthy supply and balanced the city centre student and apartment accommodation with family housing.

  • Can the physical and social infrastructure cope with this additional concentration of demand?

  • Will there be sufficient supply to address the affordability in other areas?

  • Will there be sufficient supply to address the other reasons why more housing is needed? In the North these are often more significant than affordability

One size simply doesn’t fit all

One of the key criticisms levelled during the consultation on SM2 in August 2020 was that imposing centralised local housing need figures, dictated by national Government, would significantly weaken local democracy by taking decision-making away from local people and Councils.
Further criticisms highlighted the apparently arbitrary inputs to the formula. It was also stressed that reliance on a single formula was no substitute for local knowledge and expertise taking into account constraints and opportunities and does little to address the vast range of housing challenges and local strategies in different areas of the country. In the North East, many discussions focused on the continued absence of an economic uplift factor within the formula, reflecting the importance of providing sufficient quality and choice of housing to support the North’s economic aspirations by attracting and retaining young people.
SM3 does nothing to address these problems. It still only takes account of a very narrow range of factors (if anything the removal of a stock component is a backwards step for the North East). It focuses solely on affordability, which, though a key factor, is just one of a number of challenges that drive housing need and, particularly in the North, fails to recognise other factors which are at least as important. It applies a one size fits all approach and imposes a housing need figure on local Councils. It uses arbitrary inputs and, indeed, has increased these. Lastly, far from ‘levelling up’, it continues to funnel housing development towards London and the South East, at the expense of the North East.
After three attempts, is it time to accept that local housing needs simply cannot be calculated using a simple national formula? A broader debate is needed to consider alternative approaches that recognise the importance of this country’s rich local diversity and actually facilitates ‘levelling up’. 
 

[1] Government response to the local housing need proposals in “Changes to the current planning system”

[2] Local authority green belt statistics for England: 2019 to 2020#planoraks: Well, now we *really* need to talk about the Green Belt


CONTINUE READING

Bedspace: a framework used to assess the need for Purpose Built Student Accommodation
Most university locations across the UK have seen an influx of Purpose Built Student Accommodation (PBSA). In response many Local Planning Authorities now require developers to demonstrate the need for this development.

How can Bedspace help?

Bedspace strengthens the justification for PBSA by: 
  • Presenting evidence led quantitative analysis of current and past trends in student growth and student accommodation preferences;

  • Analysing the supply pipeline as well as the potential future capacity for further PBSA, cognisant of both past trends and of university growth ambitions;

  • Detailing the potential economic impacts generated during construction of the development and after its completion; and

  • Presenting this assessment in a planning application document which has proven track record with Local Authorities.

Who is it for?

  • PBSA Developers: Demonstrating the need for PBSA in a given University location or informing early investment decisions;

  • Local Planning Authorities: Understanding student accommodation needs in their area and providing robust evidence for emerging development plans; and

  • Higher Education Institutions: Understanding the mix of student accommodation in their area and informing expansion of their accommodation offer.
Bedspace features two examples of student base data in local authorities, one of which is Oxford City Council (OCC). The need to deliver general housing, whilst ensuring student accommodation is provided for during the plan period, is acutely relevant to OCC, and thus presented an interesting case study.
It has been identified that in the catchment area of Oxford City there are 32,295 students, split between its two universities; Oxford University (19,265) and Oxford Brookes University (13,035)[1]. If the city’s student population was to increase in line with past growth rates over the last 10 years, there could be an additional 965 students by 2025. Unsurprisingly, our evidence also shows that in Oxford, university halls of residence are the preferred accommodation type (over 50%). With 25% of students living in private rented accommodation, private sector halls represent only a very small fraction of the share (3%).
The Council’s recently adopted Local Plan (June 2020) recognises that the success of Oxford’s economy is shaped by the presence of its two universities.
The Local Plan identifies that provision of good quality, well managed student accommodation will continue to be required in Oxford. However, this type of land use often competes with sites for general housing. The Local Plan therefore places restrictions on the locations suitable for student accommodation and limits its occupancy to students at one of the two universities on academic courses of over a year.
OCC’s approach has been to include a threshold cap for both universities within the Local Plan. This restricts the number of students permitted to live outside the university provided accommodation. Furthermore, in the OCC area, the growth, redevelopment or refurbishment of education floorspace is linked to student accommodation provision (i.e. the provision of accommodation must be in step with the expansion of student places).
The above, coupled with the requirement to provide an affordable housing contribution on student accommodation schemes (25 or more students/10 or more self-contained units), as well as payment of CIL (which is applicable to both education and student accommodation floorspace in the OCC area), presents a challenging situation for PBSA.
However, the unique nature of OCC’s threshold strategy for the universities is long established. The Local Plan Inspector noted in its Examination Report (May 2020[2]) that “…..the threshold system has been tried and tested in Oxford in previous plans and is a workable means of balancing the housing needs of the very large student population against the city’s many other housing needs and land uses. It is also a system that, subject to the specific threshold numbers, has been developed by consensus.”
Given the importance of the universities within the area, supply for student accommodation needs to be met to ensure growth of these important institutions can continue. The Local Plan’s aim is to balance support for the two universities while continuing the prioritisation of general housing. This difficult balancing act is applicable to local authorities across the UK.
Clearly PBSA is one of many competing land uses that Local Authorities have to contend with when seeking to meet its housing requirements. The shortage of appropriate sites within the city is a factor in land supply for housing. For example, Oxford has a rich history with large swathes of the city core within or adjacent to Conservation Areas, many listed buildings and other heritage assets. This is common across several of the UK’s university towns and cities. By nature, student accommodation would ideally be located in areas accessible to the city centre as opposed to outer suburbs, which may be more suitable for general housing provision. If students living within private rented accommodation could be housed in PBSA, private housing could be released back into the general rental market.
The National Planning Practice Guidance (NPPG[3]) confirms that all student accommodation can in principle count towards contributing to an authority’s housing land supply based on:
  • the amount of accommodation that new student housing releases in the wider housing market (by allowing existing properties to return to general residential use); and / or

  • the extent to which it allows general market housing to remain in such use, rather than being converted for use as student accommodation.
PBSA development could go some way to assist with these challenges, allowing institutions to focus investment in teaching facilities and the “student experience” rather than provision of accommodation.
New PBSA development presents a fresh opportunity in terms of the way it can be used, which will be increasingly important in an uncertain market (See Arwel Evans' blog). This flexibility could help with other competing land uses, not just for general housing sites. For example, PBSA space can be rented on a short-term basis to visitors outside of term time, helping to address a shortage of visitor accommodation.
Bedspace can help navigate some of the current uncertainty in the market and provide a robust evidence led argument, helping to guide investment decisions to where PBSA is most needed.
Please do not hesitate to get in touch to discuss further.

[1] HESA Student Record 2018/19 (figures do not sum due to rounding)[2] https://www.oxford.gov.uk/downloads/file/7288/inspectors_report_-_oxford_local_plan_2036[3] https://www.gov.uk/guidance/housing-supply-and-delivery Paragraph: 034 Reference ID: 68-034-20190722

CONTINUE READING

Your Official Top 20: The new Standard Method and the cities/urban centres uplift
Our blog - 'Mangling the Mutant' - provided thoughts on the implications of the revisions to the Standard Method for assessing local housing need when it was released just before Christmas, and charted the Government’s retreat from its original proposals of August last year.
For most local planning authority (LPA) areas, the Government simply reverted to its 2018 version of the Standard Method, with the only change being a 35% uplift to the 20 largest Cities and Urban Centres in England. Applying this uplift magically elevates the combined national local housing need figure to just shy of 300,000 per annum; fancy that!
The general merits of this approach are debated elsewhere. In this blog we look specifically at the top 20 cities/urban areas selected for the uplift, which are currently: Birmingham, Bradford, Brighton and Hove, Bristol, Coventry, Derby, Kingston upon Hull, Leeds, Leicester, Liverpool, London, Manchester, Newcastle upon Tyne, Nottingham, Plymouth, Reading, Sheffield, Southampton, Stoke-on-Trent, and Wolverhampton[1].
There are two things to note when considering the top 20 cities/urban areas. First, the top 20 cities/urban areas can change over time based on population growth. Second, with the exception of London[2] the uplift is applied only to the LPA in each city/urban area with the largest population; for example, in Manchester the uplift is only applied to Manchester City Council (being the Manchester LPA with the greatest population) not the whole urban area of Manchester (including Salford, Trafford etc.).
The selection of the top 20 gives rise to many questions. In this blog we look at four:
  1. How were the top 20 determined and is there a logic to the threshold?
  2. The top 20 can change, but is this likely? and
  3. Urban vs administrative boundaries?
  4. What is the rationale for the uplift?

How were the top 20 determined and is there a logic to the threshold?

There is no background data set that shows the full workings out of how the Government arrived at the top 20 list. The PPG simply states:
“The cities and urban centres list is devised by ranking the Office for National Statistics list of Major Towns and Citiesby population size using the latest mid-year population estimates (nomis, official labour market statistics).” (2a-004)
When the updated PPG was first published it linked through to a Freedom of Information (FOI) request. That link seems to have been updated over the Christmas break, now directing to a list of towns and cities defined by the ONS. From the original FOI link, buried away in the data requested, was a dataset matching Middle Layer Super Output Areas (MSOAs) to the list of towns and cities which can be found here. Using this data and the matching the MSOAs against the latest 2018 mid-year population estimates we get the 20 cities/urban areas which matches with the Governments own list (the list of the top 40 and current population is presented later in this blog).
We can’t be sure if the Government used best-fit MSOAs as the FOI data also included cities matched at the smaller output level. But since there are no workings from MHCLG and we reach the same 20 cities with our approach (see below for the list), we think we are on the right track.
Of note, Portsmouth is number 21 and is the closest LPA to being subject to the uplift; dodging the 35% bullet by virtue of just 12,000 people. Also of note - as was highlighted in our previous blog - all of the OxCam corridor’s urban areas fell outside the top 20; however, four of them feature in the top 30 (with a further two – Oxford and Cambridge - in the 31-40 band)[3].
Whatever the merits in principle of applying the cities/urban centres uplift, questions arise as to the logic of a fixed percentage uplift to just 20 areas, creating a 'cliff edge' with comparable places falling either side of a threshold that might be perceived as arbitrary; the fact that - outside the top 20 - there are four other cities/urban areas with a population over 200,000 (including Portsmouth and Norwich) or places - like Milton Keynes - with obvious potential to grow, does make it seem a blunt approach. An alternative would have been to mirror the formula approach of the affordability adjustment, with a sliding scale or bands based on size, so the uplift is in some way proportionate to the size of centre. This would have captured an uplift to other locations that are undeniably major urban centres.

The top 20 can change, but is this likely?

The PPG (ID: 2a-004) says:
“Whether a cities and urban centres uplift applies depends on whether the local authority contains the largest proportion of population for one of the 20 cities or urban centres in England within the list.”
So, the 20 LPAs currently might change if the population of these areas changes relative to other centres down the list. But is this likely?
Probably not.
We have looked at the ONS 2018-based population projections up to 2043. Applied to the current defined urban areas (which may change given possibility for urban growth etc.) and calculated at MSOA[4] level. Presented in the table below, these show that, even with differing rates of growth, areas are not projected to grow (or shrink) to the extent the places falling within the top 20 will change. In simple terms, barring some dramatic population shifts (such as a baby boom in Portsmouth and a mass exodus from Wolverhampton), no urban area outside the top 20 is projected to grow at such a rate, relative to those above it, that it breaks into the top tier. The LPAs that have the 35% uplift now are most likely stuck with it until a new system for binding housing requirements (as heralded by the White Paper) comes along[5].
If there are any changes to the top 20, it is more likely to come about as a result of ONS amending the defined urban areas by best fit MSOAs, although this would mean the ONS methodology for such a technical exercise carrying a policy-making burden it was not designed to bear.

Urban vs administrative boundaries

With the exception of London, the uplift is applied to the LPA with the highest population in each defined top 20 cities/urban area. The Government’s aim is to apply the uplift to the most populous areas to encourage more sustainable and brownfield development. However, this principle does not take account of how the urban areas of cities align with the LPA boundaries. It also does not take account of the practical constraints on development potential each of those LPAs might have (flagging how the assessment of need for these cities is now contaminated by policy factors).
For some cities, the approach does make some sort of sense. For example, the urban area of Hull is more or less wholly within the LPA of Hull City Council as shown below. The same goes for Wolverhampton. In these cases, the uplift is applied to (in the main) the whole of the city/urban area and is neither applied to large areas outside of the urban area nor to areas that form part of the functional city but are outside of the LPA's control.
However, for others it is less logical. Take Manchester: only Manchester City Council gets the 35% uplift. While this LPA does cover the central area of Manchester, applying the uplift just to the City means that other areas close to the centre (such as parts of Salford and Trafford) are not subject to the same uplift. That is despite them potentially having more brownfield land or central locations for development than areas in the very south of Manchester City’s boundary. Equally, what is it that makes the Greater Manchester urban area (comprising Manchester City, Bolton, Bury, Rochdale, Salford and Stockport) different from the way in which all 33 of London's Boroughs and the City were treated by the method?
Bradford is at the other end of the scale to Manchester; the LPA is far larger than the defined urban area itself. With a blanket 35% uplift to the whole LPA, the city has options – subject to its Green Belt – to address the uplift by releasing land on its periphery or rural hinterland.
Another issue arises where large parts of a functional city are not within an LPAs boundary (akin to Manchester in many respects). In Bristol a large chunk of the eastern part of the city (an area of Green Belt release where a considerable portion of the city’s previous housing needs have been met) is not subject to the uplift as it is outside the Bristol City area. Nor is a large part of Bristol’s northern extent within in its own boundaries (albeit not captured by the ONS best fit). Nottingham is similar where large parts of its wider urban area (also not captured by the ONS best fit) are not in control of the City Council.
This obviously highlights both the limitations (and idiosyncrasies) of the ONS ‘best fit’ exercise (in terms of defining what is or is not part of a main city or urban area) but also the variable approaches available to some LPAs for delivering 35% extra housing.
This takes us to land constraints: the 35% uplift bears no relation to the availability of land in the area. Two obvious examples are Brighton & Hove and Reading. As highlighted in our previous blog, Brighton is bounded by the sea to the south and a National Park to the north while Reading has already built up to its boundaries with much of its development needs already being met on adjacent land in neighbouring LPAs. The same can be said of Coventry, Leicester and Southampton to differing extents. So, where can the extra 35% be met? The duty to cooperate will have to do some heavy lifting here to redistribute uplifted needs in plan preparation. Whilst it can work - Coventry is an example of relatively successful (if not exactly speedy) redistribution under this regime[6] - we know from experience elsewhere it creaks (as do other strategic planning mechanisms) when faced with big numbers and multiple local authorities across complex urban areas.

What is the rationale for the uplift?

In our previous blog we set out the Government's rationale for the uplift was based on three factors: maximising existing infrastructure; responding to the availability of land arising from structural change in retail and commerce, thereby maximising brownfield rather than greenfield development; and responding to climate change by reducing high-carbon travel. The approach set out by Government raises two points of discussion:
First, is one of principle. Housing need is a concept that has long been untarnished by policy factors that should promote or constrain the delivery of housing in different areas[7]. This was made very clear by the Courts in Gallagher Estates Ltd v Solihull MBC[8] where, at paragraph 37 of the judgment, the housing requirement was clearly delineated from the objective assessment of housing need as follows:
“ii) Full Objective Assessment of Need for Housing: This is the objectively assessed need for housing in an area, leaving aside policy considerations….
iii) Housing Requirement: This is the figure which reflects, not only the assessed need for housing, but also any policy considerations that might require that figure to be manipulated to determine the actual housing target for an area. For example, built development in an area might be constrained by the extent of land which is the subject of policy protection, such as Green Belt or Areas of Outstanding Natural Beauty. Or it might be decided, as a matter of policy, to encourage or discourage particular migration reflected in demographic trends. Once these policy considerations have been applied to the figure for full objectively assessed need for housing in an area, the result is a "policy on" figure for housing requirement.”
This distinction between 'need' and 'requirement' means plan makers (and in due course the Local Plan Inspector) would take the local housing need (‘policy off’) and determine the appropriate requirement (‘policy on’) based on spatial policy factors that would include judgements about the desirability to focus development on brownfield sites, in proximity to transport infrastructure, and the desirability of reducing high-carbon travel (all three being longstanding components of national planning policy).
The updated standard method now incorporates these three spatial policy judgements into the assessment of need. Of course, the NPPF para 11 b) still applies, so the housing need figure remains a minimum starting point, and capacity factors may justify setting a requirement figure below the level of 'need'. The practical problem arises because the 35% uplift does not take account of constraints, with locations like Brighton (and London, Birmingham, Coventry etc.) all having very recently demonstrated to Inspectors that are they do not have realistic urban capacity to meet previous (even lower) estimates of need.
The urban priority is being 'double handled' in both the assessment of need and in the 'policy on' exercise of setting the requirement, with the evidential foundation for the former bearing no relationship to the proper exercise that will need to be undertaken in the latter.
This creates a problem of perception (the numbers are unlikely to be achieved in the areas identified) and practicality (in that unmet need is then difficult to redistribute to neighbouring areas), which makes it less likely the Government will hit its 300K per annum national ambition or address growth needs in areas of greatest economic and affordability pressures.  
This takes us to the second point. If we are crossing the Rubicon to include spatial ‘policy-on’ elements into the assessment of need, why stop here? Could a lesser uplift have been applied to the next tier of cities (21-30)? Why did the Government not also apply an uplift to urban areas where development would help meet its own aspirations such as the OxCam Arc (e.g. by applying an uplift to Milton Keynes, Oxford, Cambridge and other Arc urban areas) to reflect the National Infrastructure Commission? The PPG (ID: 2a-010) already provided a conceptual framework for this in explaining the basis on which 'actual need' might be higher than the standard method:
“Therefore, there will be circumstances where it is appropriate to consider whether actual housing need is higher than the standard method indicates.
This will need to be assessed prior to, and separate from, considering how much of the overall need can be accommodated (and then translated into a housing requirement figure for the strategic policies in the plan). Circumstances where this may be appropriate include, but are not limited to situations where increases in housing need are likely to exceed past trends because of:
  • growth strategies for the area that are likely to be deliverable, for example where funding is in place to promote and facilitate additional growth (e.g. Housing Deals);
  • strategic infrastructure improvements that are likely to drive an increase in the homes needed locally”
Taken as a whole, the 35% uplift to the top 20 urban areas and cities invites more questions than it answers. It will be perceived as a blunt tool with a potentially messy application in many of the cities/urban areas to which it applies. And having blurred the concept of need for policy reasons, it appears not to have fulfilled its potential – for reasons on which we can all speculate – to deliver the uplift in areas where it will deliver the most benefit.


[1] ID: 2a-004[2] ID: 2a-034[3] Northampton (22), Luton (23), Peterborough (27), Milton Keynes (29), Oxford (34), Cambridge (40).[4] MSOA = Middle layer Super Output Area[5] Some initial thoughts on the challenge of this new White Paper system for setting binding requirements can be found here[6] Based on the Memorandum of Understanding between Coventry and the Warwickshire authorities, which has been taken through Local Plans in both Coventry and its surrounding areas.[7] This 2010 research provides a good summary of the concepts of housing need. PPS3 (2006 and subsequently) defined housing demand and need respectively as: “The quantity of housing that households are willing and able to buy or rent” and “The quantity of housing required for households who are unable to access suitable housing without financial assistance.” [8] The judgement is available here


Image credit: Pollard Thomas Edwards


CONTINUE READING