Planning matters

Our award winning blog gives a fresh perspective on the latest trends in planning and development.

Counting the cost of delay: The economic impact of Local Plan delay to housing delivery

Counting the cost of delay: The economic impact of Local Plan delay to housing delivery

Rachel Clements, Harry Bennett & Isla Bowman 26 Apr 2022
Local plan making seems to be in a perilous state. A slew of local plans have been withdrawn, ‘shelved’, stalled, or are not taking on the feedback of local plan inspectors in recent weeks and months. One can look at this trend as symptomatic of the political and resourcing difficulties faced by the planning system. However, these delays have a real social and economic impact.
 

Who and why – the plan-making delay

In recent months, the following 11 authorities have either stalled, delayed, or withdrawn their local plans: 
  1. Basildon
  2. Dacorum
  3. Hertsmere
  4. Mid Sussex
  5. St Albans
  6. Dorset
  7. Ashfield
  8. Sheffield
  9. Arun
  10. Welwyn Hatfield
  11. Castle Point
The emerging  hiatus in local plan preparations has been well covered (for example Simon Ricketts, Zack Simons, and a Planning Resource article). Many of the delays – particularity in the South East of England – are linked to the vexed issue of housing needs. There is a current uncertainty over how the Government intends to address the question of how many homes and where they should be provided, with rumours of a new local housing need methodology (or indeed getting rid of it altogether) which may (or may not?) reduce figures in constrained authorities in the name of ‘levelling up’. This comes on top of the perennial difficulties of planning in areas of Green Belt, uncertainty over potential changes to the planning system associated with the planning ‘White Paper’, and local political pushback on development.
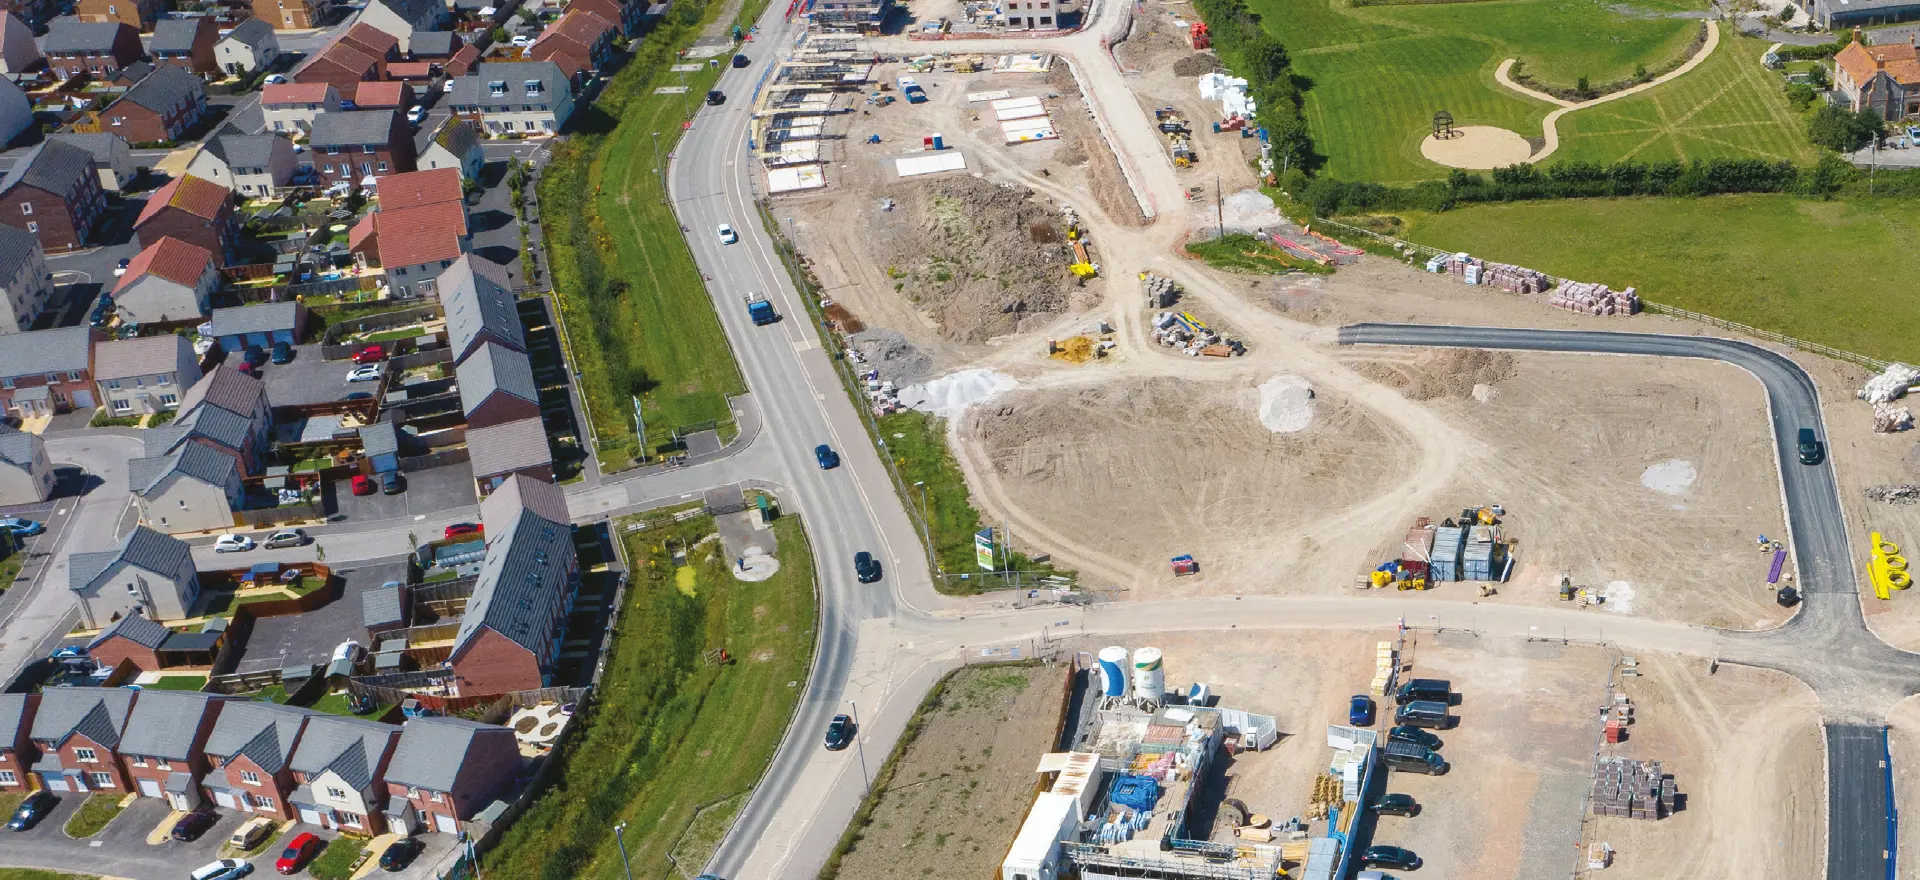
Under a plan-led system, the delivery pipeline of new housing is to a large extent reliant on housing allocations made in the new local plans. If local plans are delayed, then so too are homes (as equally are commercial developments and infrastructure). Delayed homes are homes not available for purchase, rent or available to meet local affordable housing waiting lists. Delayed housing schemes also won’t generate wider economic benefits arising from their construction, household spend, and council tax receipts.
 

How many homes are caught up in the delay from these authorities?

To quantify the effect of these delays on housing supply and corresponding economic impacts, we have reviewed each of the 11 local planning authorities’ emerging local plans listed above (be that a Reg 18 or Reg 19 draft, or a recently withdrawn plan). For each plan we have calculated how much housing is (or was) proposed on new allocation sites and their expected contribution within each respective plan period. Of the 11 authorities, only eight had published a plan with specific allocations so our analysis is limited to these LPAs (and thus excludes St Albans, Sheffield, and Arun).
From our review, there are currently 69,161 homes held up in the system across these eight authorities; most of which are in Dacorum and the fewest in Castle Point. Assuming that each allocation would deliver policy compliant levels of affordable housing, this means there are at least 21,471 affordable homes held up[1]. This total figure does not include any windfall allowances as it is assumed such sites may well come forward irrespective of a new local plan.
An alternative way of looking at the impact is to compare the figures in the stalled Local Plans against recent rates of delivery, on the (optimistic) assumption these would continue absent an up-to-date plan. Each of the eight LPAs needs to try and prepare a plan that addresses a higher level of housing need than that for which they previously planned. Adopting this approach – comparing the ‘stalled plans’ against the rate of net additions over the past three years, the stalling of the plans means forgoing approximately c.40,000 homes.
 
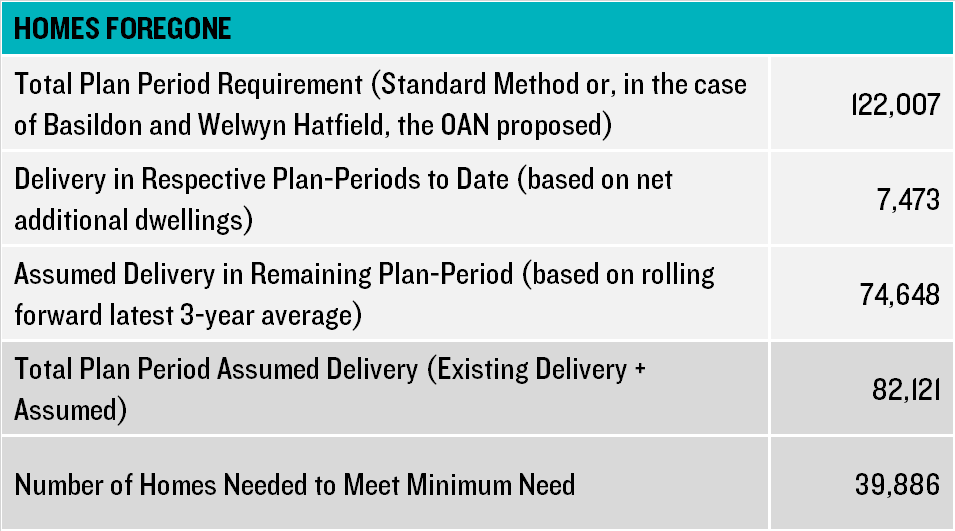
Of course, it may be that recent rates of completions cannot be sustained without new allocations. This is because past delivery will include delivery from past allocations that the emerging stalled plans were intending to replace; therefore, the 40,000 figure represents an optimistic estimate.
 

What is the economic impact of these foregone homes?

We have applied Evaluate – Lichfields’ economic benefit assessment framework – to each of the LPAs providing us with estimates of the economic benefits of the 70,000 homes in the proposed housing allocations. It does not capture the additional economic benefits from associated community infrastructure (i.e. schools and health centres), commercial development (retail and business uses), and green infrastructure associated with these allocations. For each LPA, we have applied a localised housing mix (taken from the relevant authorities SHMA) and assuming policy-compliant levels of affordable housing will be delivered.
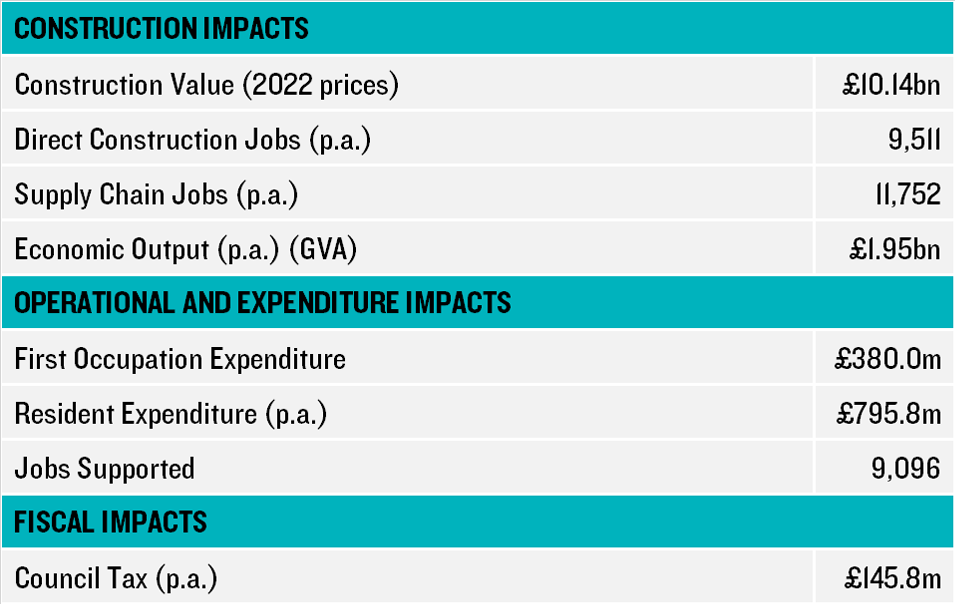
The results of the analysis are set out in the table below. The near 70,000 homes have an estimated combined construction value of £10.14billion (at 2022 prices, calculated on the costs of each region the LPA is in). This level of investment would support thousands of direct jobs and indirect supply chain jobs with an annual economic output of £1.9billion (GVA).
For local economies, there will also be a particular hit as expected housing delivery no longer comes forward. In total, residents of these new homes would support over 9,000 retail and service jobs just by their expenditure. Not all of this expenditure will be ‘new’ as some existing local residents will move into these new developments; however, it serves to show the amount of potential spend is being held up which will be generated once these homes are delivered. Finally, for Local Authorities they are missing out on a significant quantum of Council tax. At today’s rates, once all these homes are built the eight Council will be missing out on nearly £146m per annum. This could be spent on maintaining and improving services across each Council area.
 
 
Taken together, the above shows some of the real costs of local plan delay from an analysis of just eight LPAs. It is only ‘some’ because we have not accounted for the additional benefits of commercial and other developments (which of course secure jobs which many authorities chase). Moreover, we don’t account for the wider social impacts of housing forgone. Each allocation represents social infrastructure – be it schools, health centres, community space, green space, sports provision – all not delivered. The consequences of households not forming, or people living in inadequate living conditions is a further cost.
Whilst one can readily recognise the realpolitik drivers of stalled local plans – and accept that the current system has notable imperfections – it also the case that many of the areas affected are among those with the worst problems of housing affordability in the country and in locations where new housing could help support revival of local high streets. Delays thus carry economic and social negatives that are real; harming existing and future residents. The scale of impacts from just eight local plans also points to the need to arrest the contagion and get the planning system moving again; if the system as a whole grinds to a halt, the adverse consequences will be of national economic significance.


[1] Where an LPA has a range, we have applied the lower figure.

CONTINUE READING

Mapping Build to Rent Policy in London Boroughs

Georgia Crowley & Adam Donovan 13 Apr 2022
The Build to Rent sector is booming. But is the boom reflected in local plan policy across London?
Research by the British Property Federation earlier this year found that the Build to Rent (BtR) sector pipeline grew by 8% in 2021, and showed construction in regional cities in the UK outpacing London. There has been notable investment activity driving investment levels in BtR upwards in the last two years, with various acquisitions and deals listed in this article and many pension funds diversifying into the BtR market.
But where BtR will be focused is informed by planning policy; perhaps the most important public policy issue that impacts the location and implementation of BtR.

UK and London Wide Strategic Support

The birth of BtR within the UK can be traced to 2012 as part of the legacy of the Olympic Games in London with the conversion of the East Village into rental properties. As BtR has evolved, so too has national and strategic planning policy which seeks to control – and mostly support – this specific housing product. The National Planning Policy Framework (NPPF), associated Planning Practice Guidance (PPG) and the London Plan have all released BtR-specific commentary to clarify the nuances and requirements of what is still a relatively new sector with differing planning requirements.
The NPPF (2021) definition sets out that BtR is: “Purpose built housing that is typically 100% rented out. It can form part of a wider multi-tenure development comprising either flats or houses, but should be on the same site and/or contiguous with the main development. Schemes will usually offer longer tenancy agreements of three years or more, and will typically be professionally managed stock in single ownership and management control.”
Meanwhile, the London Plan (2021) qualifies the criteria BtR schemes in London must meet (Policy H11): all units being self-contained and let separately with longer tenancies available to all tenants; being held under a 15 year+ covenant with a clawback mechanism to ensure the covenant is not broken; having unified ownership and unified management with an on-site presence.
The Plan explicitly requests that boroughs “take a positive approach to the Build to Rent sector to enable it to better contribute to the delivery of new homes”.
But how is this strategic support reflected at the local level by London Boroughs?

London Boroughs – A Disparate Approach

We have undertaken research to understand how the 32 London boroughs are responding to the growth of the sector and the strategic obligation to support the asset class in their local planning policy.


As with many policies issues across London, the picture is mixed:
  • There are six authorities with explicit policies that support BtR in adopted Local Plans, where developments adhere to other plan policies and controls.

  • Six authorities have draft policies supportive of BtR.

  • Six authorities reference support of BtR in their supporting text and five authorities reference general support of high quality PRS schemes though without explicit reference to BtR.

  • Only LB Islington’s draft Local Plan policy is expressly against BtR development in the Borough, stating the ‘PRS development model does not have a tole in meeting identified housing need in Islington.’

  • 11 authorities do not make reference to BtR in the Local Plans at all.
Our research shows that there are more boroughs with a supportive approach to BtR than not and, as a general rule, it appears the central boroughs are more supportive to BtR or have a policy position, generally aligned with the London Plan.
Moving forward, we expect the position shown in our map to change as Local Plans are reviewed and are required to demonstrate conformity with the London Plan. However, as planning policy often seeks to counter a sector’s proportionate growth in the property market (think London student housing), there may also be an increase in the number of authorities who seek to limit BtR as a response to the increase in the number of schemes.
What is clear is that BtR is a sector which will continue to mature and evolve over time. How planning policy responds and adapts to this will be key to the future direction of the sector.
The map below demonstrates an overview of our findings[1] - hover over each borough to find out more.
For further details of this borough-level research and our experience and intel in the BtR sector, please do get in touch.

Key Contacts


Contact


Contact


Contact


[1] Data collected w/c  21st March 2022


CONTINUE READING

Over recent years, social media has played an increasingly significant role in our lives, but how is it influencing town centres and how we use them?
Technological advances are now influencing retail and leisure habits and the use of spaces. From finding places to go via word of mouth, I now find myself increasingly turning to Tiktoks or Instagram reels to influence my decisions on places to visit.  The power of social media in attracting people to town centre, was covered in recent research by Lichfields into how young people use and interact with the town centre. This showed 41% found out what was happening in their town centre via Instagram as they seek new and alternative experiential activities.
As of August 2021, just under 15% of high street retail and leisure properties were vacant in Great Britain 1, and since then the covid pandemic increased pressures on many high street and town centre businesses. The covid pandemic saw a catalysed shift to more online-based shopping, working and leisure activities. As a result, the changing dynamic of how we use these town centre spaces has become a great focus amongst planners, politicians and the public.
It is often stated that ‘crisis leads to creativity’. The climate crisis has driven significant growth and development in electric cars and green energy, SARS which ravaged Asia in 2002 led to a widespread adoption of e-commerce within the region2, and some of the world’s largest companies today were created during in the aftermath of the 2008 financial crisis such as Uber, Airbnb, Instagram and Whatsapp3.
Social media platforms such as Tiktok and Instagram have become more widely used throughout the pandemic, influencing the ways in which we interact and socialise. The ONS found that 100% of 16–24 year-olds access the internet on a mobile device and, unsurprisingly, this age group engage very actively with social media (98%) and are highly adept at finding out about information on goods and services online (84%). When compared to other age groups, the percentages range from 84% (ages 35-44) to 69% (ages 45-54)4, and it is clear we are increasingly influenced by the use of technology.
With this in mind, there has been a significant increase in popularity of social experiences through these platforms, with many young people favouring technology-based social experiences over traditional social activities. From traditionally playing golf in large outdoor spaces, minigolf activity centres have sprung up in small spaces within many city centres, such as Ghetto Golf and Puttshack- a tech-infused mini golf experience. Similarly, Flight Club a social darts venue infused with dart tracking technology and an automated scoring system, Hijingo- a multi-sensory based bingo experience and Toca- an immersive and interactive indoor football and dining space.
Toca


Image credit:@tocasocial on Instagram

Flight Club


Image Credit: @flightclubdarts on Instagram

Ghetto Golf

Hiijingo


Image credit: hijingouk on Instagram

 
Through social media adverts, young people in particular have gained interest in these experiential activities, previously seen as traditional activities which have been infused with modern technology. The growth and popularity of these uses highlight the growing demand for more of these experiential spaces within our town centres. They often seek easily accessible locations, which makes vacant city centre spaces an attractive option, where suitable premises exist.
Previously working within the retail sector in London, I have seen first-hand the ways in which high streets and shopping centres have successfully drawn people in through the use of social media and the introduction of experiential spaces.  Examples include the Tiktok pop up at Westfield London, launching its For You pop up store last summer, Lakeside’s ‘upside-down house’ and Snapchat’s pop-up venture with Lego, creating an augmented reality experience 5. These examples are successfully repurposed spaces within high streets and town centres, bringing people back in by meeting current demands, which are now increasingly influenced by social media.

Upside Down House, Lakeside

Image credit: Richard Rogerson

Image credit: intu Lakeside via Essex Live

TikTok House, Westfield London

Image credit: Westfield

At Lichfields, we often help to facilitate such changes through the planning process, either for operators or our asset manager clients; for example, we helped secure permission for the Lakeside ‘upside-down house’, the Flip Out indoor trampoline park at Festival Place, Basingstoke, for Puttshack in Lakeside and Watford Shopping Centres and Ghetto Golf in Newcastle-upon-Tyne. These experiences have been successful in creating exciting new centre attractions, particularly for younger town centre visitors and tourists.
In an age where experiences are often shared via social media, these experiential activities provide a powerful tool in repurposing vacant or under-utilised shop units and bringing more people and vitality back into our town and city centres. Social media is increasingly influencing the demands for spaces within our towns and cities, this brings about questions for the future on the scale and significance social media will play on influencing these spaces?
 
References

1. Sourced from GOAD

2. https://www.mckinsey.com/business-functions/strategy-and-corporate-finance/our-insights/innovation-in-a-crisis-why-it-is-more-critical-than-ever

3. https://www.london.edu/think/why-some-of-the-best-inventions-are-born-in-crisis

4. https://lichfields.uk/media/6188/the-next-generation-the-future-of-our-town-centres_sep-20.pdf

5. https://www.retailgazette.co.uk/blog/2021/08/how-are-social-media-platforms-venturing-into-physical-retail/


CONTINUE READING

Nutrient Neutrality – A housing supply headache
This blog forms part of a miniseries covering the nutrient neutrality issue; in this case focusing on a recent Five-Year Land Supply appeal we worked on in Ashford Borough (ref. 3284479).
Nutrient neutrality is becoming an ever-growing delivery problem nationwide. In many cases, schemes are simply unable to be granted planning permission as they cannot support onsite mitigation or the LPA may require a contribution to an as yet unavailable strategic solution. They are therefore reliant on strategic solutions to come forward first leading to a moratorium on granting permissions. A knock-on issue is a conflict with the requirement for LPAs to demonstrate a five-year housing land supply (5YHLS) of ‘deliverable sites’ (NPPF, Paragraph 74). But what does it mean for 5YHLS in practice?
On a macro level, any LPA affected that might otherwise have been performing well can suddenly became vulnerable to a 5YHLS challenge. Sites with existing detailed permissions can build out as expected, but the future pipeline may be held up as those sites with allocations or outline permission in affected areas are now unlikely to come forward in the short term, leaving an ever-growing shortfall.
The most affected LPAs will be those where the majority of the land is subject to the moratorium; especially where this area covers key urban areas or locations where key strategic developments were planned (like Ashford Borough). It will also particularly impact any LPA with a 5YHLS reliant on sites without detailed planning permissions (i.e. allocations and outline permissioned sites). There will also be a growing problem for some LPAs with a recently adopted local plan. One would expect lower levels of completions and these LPAs can accrue a shortfall of supply against their Plan targets; making it harder and harder to demonstrate a 5YHLS.
Going to the specifics of 5YHLS, the policy requirement is to demonstrate a supply of ‘deliverable’ sites. This is where the recent Appledore Road appeal (ref. 3284479) comes in. Housing supply is dealt with in Paragraphs 7 to 20 where it’s ultimately concluded that Ashford Borough Council cannot demonstrate a 5YHLS (a point that was common ground between the Council and appellant, albeit the scale of the 5YHLS shortfall was in dispute). The key points made by the Inspector link back to the definition of ‘deliverable (see NPPF, Annex 2); that sites should be “…available now, offer a suitable location for development now, and be achievable with a realistic prospect that housing will be delivered on the site within five years” and for Category B sites “clear evidence” must be provided to be considered deliverable.
In the context of the nutrient issue he states:
“Many of the sites that are in the paragraph b) category of the definition are within or on the periphery of Ashford and are affected by the Stodmarsh nutrients issue, … The Council has published guidance on how it can be mitigated, including options on-site or off-site ...
I am not convinced that the evidence presented by the Council is sufficient to clearly demonstrate that all the sites that would be likely to be delayed due to the Stodmarsh nutrients issue would be able to deliver the contributions that it has included within the five-year period.” (Paragraphs 10 and 14).
It is therefore not the fact that the nutrient neutrality issue exists that is the problem. It is the evidential requirements associated with demonstrating a site is ‘deliverable’ in the context of 5YHLS; namely that sites must have a realistic prospect of delivering and be suitable ‘now’ for development. Notionally, if the evidence satisfactorily demonstrated to the Inspector that a strategic solution would be delivered at a certain point in time, with permissions following, and reasonable lead-in times until first delivery after that, then the affected sites may not have been removed (although the timescales as to whether and what they might prospectively deliver in the five year period would still be relevant).
The key implication of this is that as things develop, we should see a clearer picture emerge with regards to the implementation of strategic solutions. Therefore, the impact of the nutrient neutrality issue could be a short to medium term problem in terms of ‘deliverability’ as evidence becomes more and more robust (assuming any strategic solutions are implemented sharpish).
This of course doesn’t have any impact on the immediate problem and LPAs may struggle to convince an Inspector that plans at the very early stages to implement a strategic solution serve to show a ‘realistic prospect’ of completions in the relevant five-year period.
Finally, its worth noting that this appeal shows the policy aim of 5YHLS in action. A lack of 5YHLS – for whatever reason – engages the ‘tilted balance’ of Paragraph 11(d) in the NPPF. This means granting planning permission unless any adverse impacts of doing so would demonstrably outweigh the benefits. In the case of the Appledore Road site, it is outside the nutrient neutrality affected area and the appeal was allowed with the titled balance engaged. It will now be part of the shorter-term solution to the wider delivery problems in the Borough, delivering much needed housing (including 50% affordable) but wider benefits as well. 
 
Image credit: Nilfanion

CONTINUE READING