Planning matters blog | Lichfields

Planning matters

Our award winning blog gives a fresh perspective on the latest trends in planning and development.

A new London Plan by Christmas? …Stop the cavalry!
After what can only be described as an eventful year for Londoners working in planning and development, progress on the new London Plan had been noticeably absent. That was until 9th December, when the Mayor published a letter addressed to the Secretary of State (S0S), setting out his intention to formally approve his final version of the new London Plan.
Within a fortnight the Mayor has indeed approved his draft London plan – on the day envisaged in his letter of 9th December – and including most of the further changes that were put forward by the SoS the day after receiving the Mayor’s letter.
And while the SoS has at least six weeks to consider his position, it seems likely that approval to publish the London Plan will follow swiftly.
This blog provides an overview of how the Plan has changed in response to the directions.

Background

At the time of the Mayor’s 9th December letter, neither a final version of the Plan nor the Mayor’s most recent revisions had been made public by either party. Then, within a matter of hours of receiving the Mayor’s letter, the SoS broke his silence by responding and setting out yet further directions for the Mayor to amend the new London Plan, indicating that there had been collaboration and that the Mayor’s letter was issued in order to poke the Government into action.
The correspondence confirmed that the Mayor had submitted a further amended version of the new London Plan to the SoS on 21 August, in response to the directions made by the SoS back in March 2020.
Annexe 1 of the 10 December letter sets out where the SoS accepted the Mayor’s proposed rewording of the Plan in line with the directions made in March, alongside the parts where he disagreed. Reading through these, it becomes apparent that the Mayor had not taken on board a number of the directions. Annexe 2 sets out two additional directions to the initial eleven, relating to the redevelopment of Industrial Land in areas constrained by Green Belt, and entirely new changes to the Mayor’s tall building policy.
Collectively, the changes directed do alter the strategy to that which was intended by the Mayor when the draft Plan was published in 2017. Not only might we see some development of a different scale to that the Mayor intended, but also in locations and on types of site that the Mayor sought to remain off limits.
To provide an overview of what this means, we have summarised below how the SoS’s latest directions have changed the Plan – and where the Mayor has not accepted the changes in full.

1.     Green Belt and Metropolitan Open Land

As expected, the Mayor has – for a second time - been directed to amend the Plan’s Green Belt Policy G2, effectively bringing this in line with national policy, removing the blanket ban on development on London’s Green Belt and Metropolitan Open Land (MOL).
The directed changes largely mirror paras 84 and 85 of the NPPF (the 2012 version, which the Plan has been assessed against), which require development proposals that would harm the Green Belt to be refused except where very special circumstances can be demonstrated. The directions also encourage opportunities for the enhancement of the Green Belt where this can provide appropriate multifunctional beneficial uses for Londoners.
Policy G3 regarding MOL has also been diluted, with a similar redaction of the previous text that explicitly stated that development proposals that would harm MOL should be refused.
Changes to this particularly contentious area of planning policy will likely draw a mix of reactions. Not only has this required the Mayor to dilute his 2016 manifesto pledge to protect London’s Green Belt and MOL; some outer London Boroughs may now find themselves under pressure to release Green Belt in order to meet the new housing targets, in situations where closer scrutiny of housing land supply reveals they do not have sufficient deliverable and developable capacity without doing so (a topic explored in our recent Insight report: Mind the Gap). Equally, the flexibility will also allow more ambitious boroughs to consider the release of sites in sustainable locations that do not perform well against the NPPF’s criteria for designation. Our previous research on London’s Green Belt and MOL revealed that 11 boroughs had already undertaken Green Belt reviews independently of the GLA.
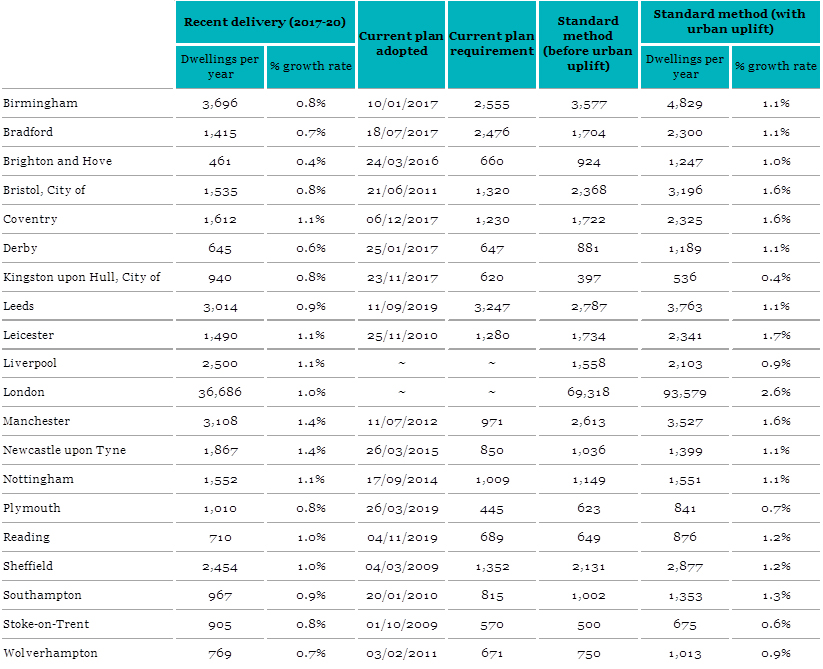
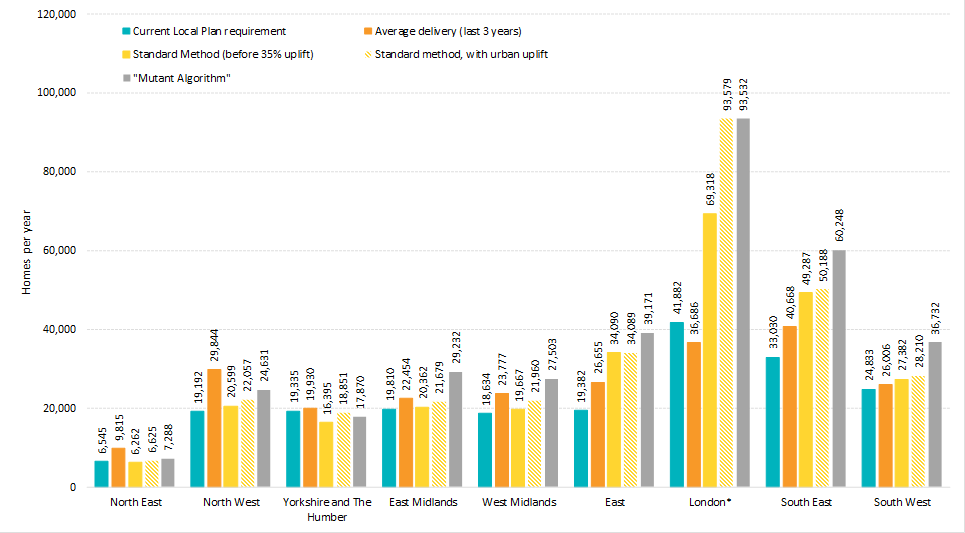
With this change in policy approach, it does invite the question over whether the Mayor will continue to devolve Green Belt reviews to individual Boroughs or seek to overlap some kind of coordinated approach, following previous recommendations from the Examination in Public (EiP) Panel last December, which had suggested that a strategic and comprehensive review of London’s Green Belt should be undertaken to establish its potential for sustainable development. On balance, the former seems more likely, with the latter being a can that will be kicked down the road for the next London Plan, which will need to grapple with a sky-high housing need figure of 93,500dpa (as explored in our recent blog on the Standard Method).
Figure one: Green Belt/ MOL Reviews undertaken by Outer London Boroughs.
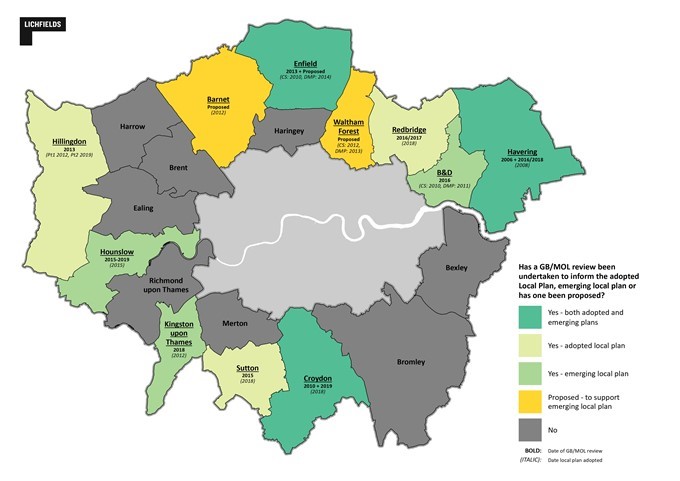
Source: Lichfields

2.    Land for industry, logistics and services to support London’s economy

Perhaps in light of the recent political backlash regarding other areas of planning reform (in particular, the changes to the Standard Method), the SoS had called on the Mayor to provide boroughs constrained by Green Belt and MOL with a degree of freedom to consider the release of other designated land instead, with his latest directions requiring additional changes to the Plan’s policies on Strategic Industrial Land (SIL).
The Mayor was directed to further amend para 6.4.8, supporting text Policy E4, to include the following line:
In exceptional circumstances when allocating land, boroughs considering the release of Green Belt or Metropolitan Open Land to accommodate housing need, may consider the reallocation of industrial land, even where such land is in active employment uses”.
He states that this will “provide boroughs in the difficult position of facing the release of Green Belt or Metropolitan Open Land with a greater freedom to consider the use of Industrial Land in order to meet housing needs.”
The SoS puts this down to the “profound impact Covid-19 is having on London, and other towns and cities”; however, his reasoning goes no further in explaining the link, or why this is the only Policy area to have been affected by the challenges of the pandemic.
The March directions had already sought a significant watering down of Policy E4 and Policy E5 and required the Mayor to drop the ‘no net loss’ principle for sites designated as SIL/Locally Significant Industrial Sites (LSIS). The change would provide boroughs with a much greater degree of flexibility as to how proposals for alternative uses for these sites are to be determined, and potential for such designations to be reviewed through a plan led approach. Evidently the Mayor has already once declined to make these changes, as these had been highlighted a second time around.
The SoS is clear that the emphasis should be on ensuring boroughs “provide” sufficient land rather than to “retain” at all cost. The Plan continues to support opportunities for intensification and co-location of uses, however, the SoS’s directed changes actively encourage boroughs to assess the release of industrial land for alternative uses where vacancy rates are “well above the average”, where possible substituting with “alternative locations with higher demand for industrial uses”.
The EiP Panel had previously noted that that the vacancy rate of existing industrial land and premises in most boroughs is less than 5%, suggesting this sector was operating efficiently but with little capacity to meet future demands. The loosening of Green Belt restrictions may provide opportunities for SIL to be substituted outside of London’s built up areas; however, recent trends have highlighted growing demand for storage and warehousing within and close to the CAZ.
Given the current buoyancy of London’s market for industrial land, its future safeguarding and potential release for other uses will now be largely reliant on wider market factors and the viability of individual sites.
The Mayor has not accepted the wording in the direction and para 6.4.8 has been submitted with text in red inserted in place of the SoS’s wording;
Where industrial land vacancy rates are currently above the London average, boroughs are encouraged to assess whether the release of industrial land for alternative uses is more appropriate if demand cannot support industrial uses in these locations. Boroughs proposing changes through a Local Plan to Green Belt or MOL boundaries (in line with Policy G2 London’s Green Belt and Policy G3 Metropolitan Open Land) to accommodate their London Plan housing target should demonstrate that they have made as much use as possible of suitable brownfield sites and underutilised land, including – in exceptional circumstances – appropriate industrial land in active employment use. Where possible, a substitution approach to alternative locations with higher demand for industrial uses is encouraged”.
The proposed wording does not contradict the SoS’s direction; but emphasises the need to make reference to other policies in the Plan and reflects para 137(a) of the current National Planning Policy Framework (albeit the draft Plan must be consistent with the NPPF 2012). It seems more likely than not that the Mayor’s version of amended para 6.48 will be acceptable to the SoS.

3.     Optimising density

The change in approach of the new London Plan to determining appropriate densities for sites will be familiar, notably the scrapping of the density matrix and the formalising of the established design-led approach to development.
Whilst generally supportive of the approach, the SoS once again directed the Mayor to reword Policy D3 so as to ensure that in optimising site capacity, development is of the most appropriate form and land use for the site and location.
The Mayor had also been directed to add an additional paragraph D3 (B), clarifying that higher density developments should be promoted in locations that are well connected to jobs, services, infrastructure and amenities, by public transport, walking and cycling. Outside of these areas, incremental densification should be actively encouraged.
The approach largely echoes the Government’s White Paper which called for “more homes at gentle densities in and around town centres and high streets, on brownfield land and near existing infrastructure”. With possible divergence in opinion as to what might constitute ‘gentle’, some boroughs may well seek to limit development in some lower density areas. However, the GLA will likely expect this to be determined in line with its (draft) SPG ‘Quality Homes for all Londoners, which seeks to ensure site capacity is determined in response to the local context.

4.    Tall buildings

Linked to the above, the SoS’s additional directions under annexe 2 of his 10th December letter called for amendments to Policy D9 regarding tall buildings. The Mayor has amended the policy in line with this direction. The effect is a lower default threshold definition for tall buildings where no local definition is in place, reducing it from 25m in height in the Thames Policy Area and 30m in height elsewhere in London, to just 6 storeys or 18 metres across the entire Greater London area.
Essentially, unless a higher threshold has been set locally, the Plan’s tall buildings policy will be engaged for any proposals over 6 storeys tall, providing greater control over such development proposed in lower to mid-rise areas of London where local Plans are silent on the height threshold.
The accompanying letter from the SoS acknowledged that there “is clearly a place for tall buildings in London, especially where there are existing clusters. However, there are some areas where tall buildings don’t reflect the local character”.
Taken with the directions on optimising density, these changes will give boroughs more control over applications for taller, higher density developments – perhaps in part to appease some outer London boroughs, such as Hillingdon, Bexley and Richmond, which had previously called for an approach that was more sensitive to local context. Whilst these changes may bring London closer in step with the SoS’s aspirations for “gentle density”, there is a risk this may reinforce existing patterns of low density urban form, reducing the opportunities to optimise the development potential on some otherwise sustainable sites.

5.     Parking

Following his previous directions on this matter, the SoS had again directed changes to the maximum residential parking standards in Table 10.3, introducing a more nuanced approach for development in outer London. Where Table 10.3 provides a range, development proposals that are higher density or in more accessible locations should apply the lower of the threshold. In addition to this, boroughs are given some flexibility to apply higher standards in areas of outer London with the lowest PTAL rating, where there is clear evidence that this would support additional family housing (3+ bedrooms).
For retail parking standards, the Secretary of State also maintained that boroughs may consider alternative standards in certain locations, where it can be demonstrated that the standards in Table 10.5 would undermine town centres first approach to retail development, or significantly undermine the viability of mixed-use redevelopment proposals in town centre locations.
With the Mayor accepting these amendments, it will ultimately fall to the boroughs as to how these standards will be applied. In some instances, this may assist schemes in areas with a lower PTAL, whilst also supporting the viability of mixed use redevelopment on existing retail sites and schemes and in town centre locations.

Concluding thoughts

A comparison of the SoS’s latest directions against those published in March shows that, despite the ‘constructive’ conversations his officials may have had with colleagues at the GLA, the Mayor was initially unwilling to concede on a number of key policy areas, as directed in March.
The changes made in response to the directions will hand a greater degree of flexibility back to boroughs in how they plan for development, whilst decisions over how land is best utilised will be more market driven. Reflecting on the priorities and challenges of the Government’s wider agenda for planning reform, the SoS’s priorities clearly lie with delivering housing, though there is also an attempt to balance this message with assurances over design quality and the impact new development may have on lower density outer boroughs constrained by Green Belt.
On the one hand, this may support boroughs in delivering more homes, giving them greater freedom over the types and locations of sites that are considered appropriate for development. On the other, some of the changes – notably those aimed at optimising site capacity and - may reinforce existing development patterns, particularly where the surrounding context of townscape and urban character are lower in density or may be constrained in other ways.
With London delivering well below its identified housing need (now 93.5K per annum), this will almost inevitably result in the release of some sites within protected land categories, namely Green Belt, MOL, and designated Industrial Land. However, the extent to which this occurs will depend on a range of factors, not limited to the demand for alternative uses, proximity to existing infrastructure, and the viability of sites, particularly given the significant costs and limitations that often come with brownfield sites. Planning decision makers will no doubt also have regard and attach weight to the economic impact this may also have on jobs, affordable employment space, access to supply chains, storage and distribution.
The Mayor faced the difficult choice of making some relatively major concessions to his strategy or risk not getting his version of the London Plan adopted in time for the (already once delayed) Mayoral elections.
On 16 December the SoS, in his Housing Update Written Statement alluded to the sudden change in pace, saying “we expect to agree the London Plan with the Mayor early in the new year which will set his plan for, amongst other things, meeting London’s housing need. This will support greater ambition in London”. 
Given the prevailing uncertainty stemming from the pandemic, a post-Brexit trade deal, and the government’s proposals for wider radical reform of the planning system, pragmatically, the Mayor has accepted the vast majority of changes directed, recognising the importance of having an adopted Plan in place. As his most recent letter to the SoS says:
I welcome your sense of urgency in getting my London Plan published and acknowledgement that this would help families and businesses in London. These reflect my own concerns as I have set out in correspondence to you on a number of occasions since March 2020. Publishing the London Plan will also provide much needed certainty to landowners and developers at this difficult time for the whole country.
The Mayor stuck to his intended formal approval date of 21 December; there could still be a new London Plan 2020, but the new London Plan 2021 sounds more realistic.
 

Mayor of London, Letter to the SoS 9 December 2020MHCLG, Letter to Mayor 10 December 2020Annex A Changes to fulfil Directions 10 December 2020Annex B Further Directions 10 December 2020

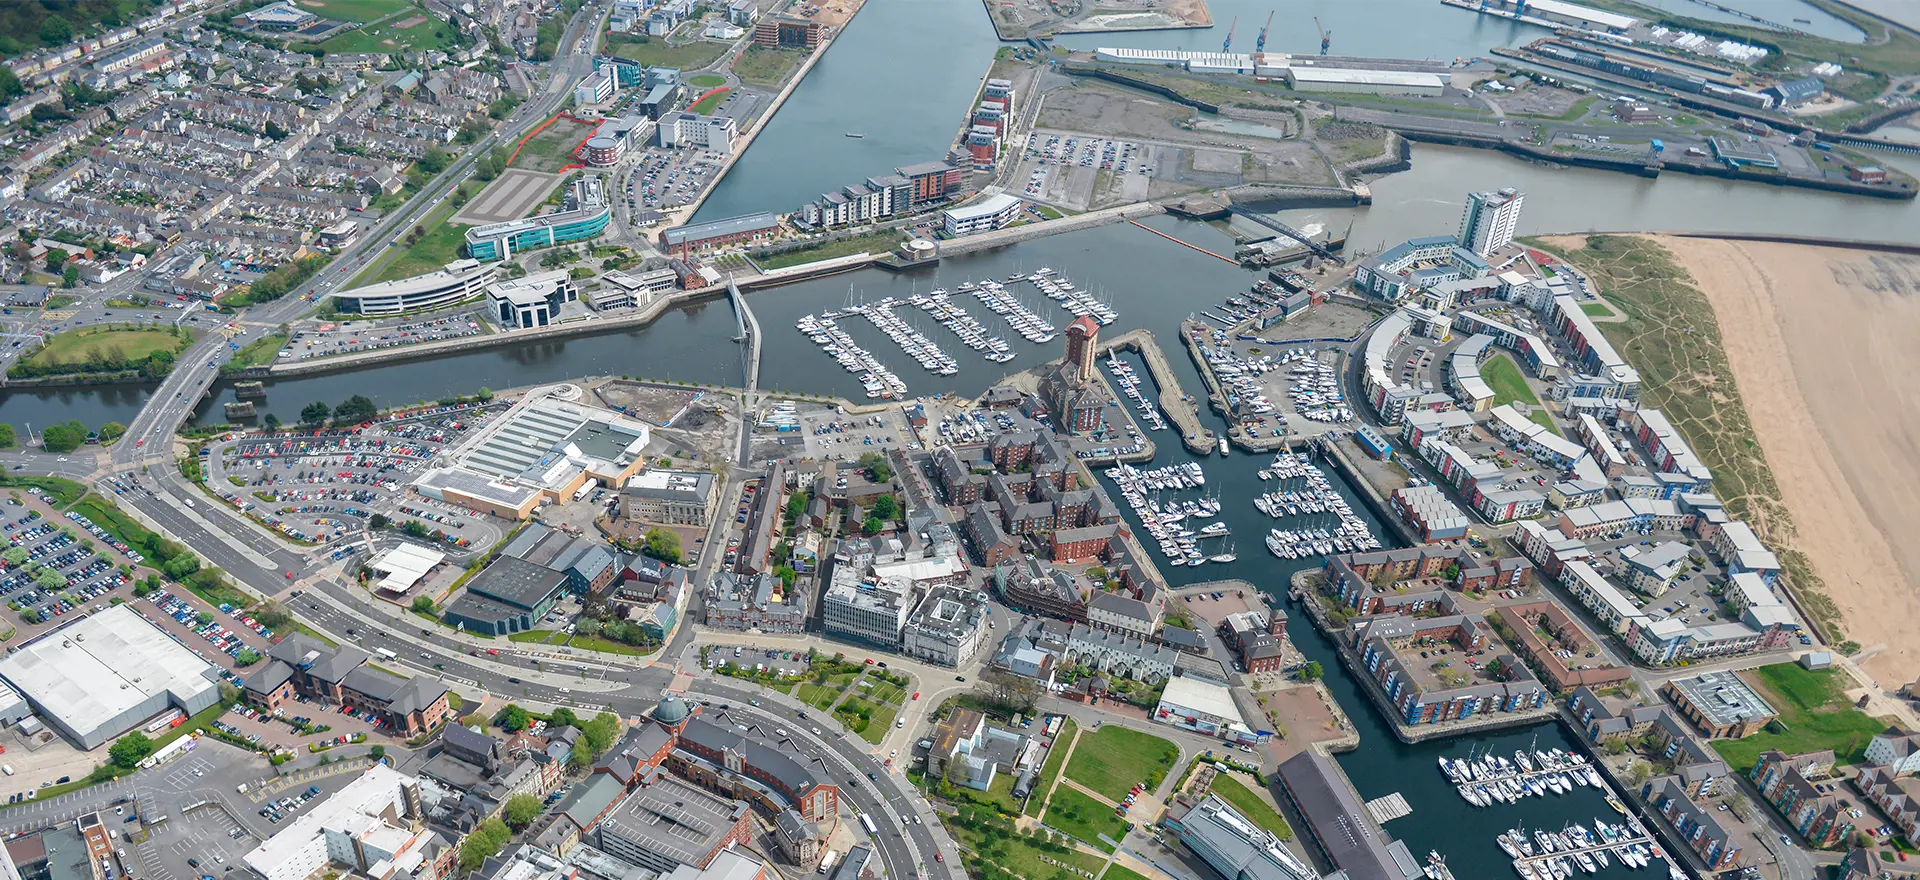
Image credit: GRID architects for Bellway Homes

CONTINUE READING

Mangling the mutant: change to the standard method for local housing need
The launch of the proposed new standard method for local housing need on 6th August 2020 unleashed a media and political storm. An unfortunate cross-over with the problems of A-levels and GCSEs led to it being dubbed the ‘mutant algorithm’[1]
On 16th December, the Government sought to resolve matters, making a series of announcements across four publications:
  1. A written Ministerial Statement[2]
  2. Response to the Consultation on Proposed Changes to the Current Planning System[3]
  3. Updates to the Planning Practice Guidance on Local Housing Need[4] to set the new standard method approach
  4. A spreadsheet with the indicative figures from the updated method[5]
What are the headlines and what does it mean?

For most local authorities, it’s ‘as you were’

Outside the 20 largest urban areas, the method will remain that which was first introduced in 2017, which is based on applying the 2014-based household projections, with a percentage uplift to reflect the price-income affordability of housing, subject to the 40% cap. Whilst the number will change in response to fluctuations in affordability, the ten year period over which it is calculated, and the plan-related 'cap', this represents stability.
Interestingly, this now means that the majority of those local authorities preparing plans over the next 2-3 years, looking ahead to 2040 or beyond, will be doing so based on a demographic trend period of 2009-2014 that was infected by the financial crisis.

The 20 largest cities and urban centres top up their need figure by 35%

The new method applies what it calls a 'cities and urban centre uplift' of 35% to the capped need figure generated by the existing standard method in the top 20 largest cities and urban centres. What is classified as the top 20 is based on ranking the ONS list of major towns and cities[6] by population, and thus it may change over time. The current top 20 are Birmingham, Bradford, Brighton and Hove, Bristol, Coventry, Derby, Kingston upon Hull, Leeds, Leicester, Liverpool, London, Manchester, Newcastle upon Tyne, Nottingham, Plymouth, Reading, Sheffield, Southampton, Stoke-on-Trent, and Wolverhampton.
The effect of this uplift is summarised in the table below, which compares the new SM approach against past delivery, the most recent Local Plan, and the previous version of the SM without the urban uplift.
As can be seen, London represents the biggest absolute increase because the 35% is applied to all Boroughs, whereas for other metropolitan areas it only applies to one or two urban authorities. We turn to the London figure later in our analysis.

The City and Urban Centre Uplift: Quart into a pint pot?

Beyond London, the figures generate a number of interesting dynamics. The new SM figures are markedly higher than most current Local Plan requirement figures for those cities, which were themselves lower than the previous Standard Method (ie without the new cities and urban centres uplift). With some exceptions (perhaps), this may simply mean the new method will pile up need into cities that do not realistically have the urban capacity to meet it.
The Government rationale in its consultation response presents three reasons for this approach:
"First, building in existing cities and urban centres ensures that new homes can maximise existing infrastructure such as public transport, schools, medical facilities and shops. Second, there is potentially a profound structural change working through the retail and commercial sector, and we should expect more opportunities for creative use of land in urban areas to emerge. Utilising this land allows us to give priority to the development of brownfield land, and thereby protect our green spaces. And third, our climate aspirations demand that we aim for a spatial pattern of development that reduces the need for unnecessary high-carbon travel."
All three reasons are what the planning system would traditionally have regarded as being ‘supply side’ or ‘policy-on’ and not part of the so-called ‘objective assessment of need’[7]. 26% of the total housing need figure for these twenty cities is now based on explicit 'policy-on' considerations, and it will be interesting to see whether and how these are played back into the debate over setting 'policy-on' requirement figures, particularly in circumstances where those cities might say they are unable to meet needs due to lack of suitable or deliverable/developable sites. Questions may be raised as to whether these policy factors are consistent with the concept of need as defined in the NPPF, or whether the application of them only to the 20 largest urban centres - within what can be multi-polar urban conurbations - has been justified.
The Government goes on to say that:
"The increase in the number of homes to be delivered is expected to be met by the cities and urban centres themselves, rather than the surrounding areas. In considering how need is met in the first instance, brownfield and other under-utilised urban sites should be prioritised to promote the most efficient use of land. Development should align with the character of local neighbourhoods in urban areas and support the building of green homes. This is to ensure that homes are built in the right places, to make the most of existing infrastructure, and to allow people to live nearby the services they rely on, making travel patterns more sustainable. Local planning authorities should co-operate on that basis, notwithstanding any longer-term proposals set out in the Planning for the Future White Paper which explain that we intend to abolish the Duty to Cooperate."
Of course, the drive to meet needs in urban areas on brownfield land is not new. Many of the 20 cities are ones where their current Local Plans sought but failed to identify sufficient land to meet previous - lower - estimates of need, thereby generating unmet need. For example, in Brighton & Hove, the current Plan was adopted after an examination process where the Inspector concluded[8] that, to be adopted, “I would need to be satisfied that the Council had left no stone unturned in seeking to meet as much of this need as possible.” Brighton's Plan was subsequently adopted with an annual target of 660, against a need figure (at the time) of 900‐1,200 dpa, with unmet need that has not subsequently been addressed. The new standard method now proposes a figure for Brighton that is almost three times recent rates of delivery, in a tightly bound city wedged between the South Downs and the English Channel. Extra need in Brighton thus inevitably increases pressure on areas like Horsham and Mid Sussex via the duty to cooperate. 
Other high profile examples include Birmingham, Bristol, Coventry and Reading, in some cases leading to plan making failure (e.g. the West of England) or protracted (largely unsuccessful) attempts to resolve - with multiple neighbouring local authorities - how those unmet needs will be addressed. In many of these same cities (but also, for example, Newcastle, Leeds) needs that cannot be met in the urban area have resulted in plans proposing Green Belt release on the urban edge.
The Government might argue (as does Neil O’Brien MP – a critic of the 'mutant algorithm' – in this tweet thread) that the changing world and new permitted development rights will open up new capacity for residential development, that the development model for development in cities will need to change, and that the new Urban Task Force will help to shape a new approach.
That may be right to some extent (of note, some of the 20 cities have exceeded their local plan targets suggesting the plan makers' attempts to quantify urban capacity is not infallible), but it does seem that the structural change sketchily envisaged would at best take time to achieve, whereas the new Standard Method figures will need to inform plan making now. And there is no change proposed to the NPPF’s requirement (para 67) for local plans to have:
a.  specific, deliverable sites for years one to five of the plan period
b.  specific, developable sites or broad locations for growth, for years 6-10 and, where possible, for years 11-15 of the pla
Plan makers in these cities - faced with the elevated need figures - will be required to identify specific deliverable and developable capacity capable of meeting that need, and will struggle to rely on more abstract concepts around how future urban development will be realised. The two most recent iterations of the London Plan - faced with this challenge - have seen Inspectors (who reviewed the evidence) recommending a reduction in the housing requirement figures advanced by the Mayor due to insufficient confidence in deliverability of the urban capacity. The conclusions of the Inspectors examining the New London Plan in 2019 are apposite when they settled on the capacity constrained requirement figure that looks shortly to be adopted:
"Furthermore, the question of supply is based on capacity and given that this would be maximised as far as realistically possible, it is difficult to see how the number of deliverable housing units could be increased [above 52K per annum] without consideration being given to a review of the Green Belt or further exploration of potential with local authorities within the wider South East."
On its face, it therefore seems unlikely there is sufficient evidence to conclude that these 20 cities will almost double the rate of housebuilding from 67.3K to the new ‘need’ of 131.5K.
This takes us inexorably to:
  • Green Belt release on the edge of those cities that have them, with the scale of need being a proven part of an ‘exceptional circumstances’ justification under the NPPF; and/or 

  • the duty to cooperate and the requirement for cities who cannot meet their need to seek arrangements with neighbouring LPAs as per the NPPF requirement (para 25 a) “that unmet need from neighbouring areas is accommodated where it is practical to do so and is consistent with achieving sustainable development.” Unfortunately, we know that big cities' attempts to successfully negotiate solutions for this unmet need are both tortuous and rarely completely successful (Birmingham being a notable example).


The national housing need figure is 297,605 (let’s call it 300,000)

Based on the indicative figures supplied by Government, the new national total is just short of 300K, but this figure will change when individual affordability ratios, projection period, and outputs of the plan-based 'cap' all change over time. This compares to an average annual net additions rate since 2017 of 236K.
However, the change in the Standard Method is not evenly spread by region. The figure below charts current local plan requirements, average delivery, the current method (with and without the urban uplift) and the (now deceased) mutant algorithm.
Key points emerge:
  1. London is responsible for the greatest uplift. The increase to 93.5K is almost identical to the figure produced by the ‘mutant algorithm', and is well north of recent completions and current or emerging London Plan. The Government says:

    "It is clear that in London, in the medium term, there will need to be a much more ambitious approach to delivering the homes the capital needs. The Secretary of State for Housing, Communities and Local Government expects to agree the London Plan with the Mayor shortly. This new plan, when adopted, will set London’s housing requirement for the next 5 years."

    This would suggest the London figure is of more academic interest right now, and its uplift will not contribute towards meeting 300K over the next five years.

  2. The new standard method is below recent rates of housing delivery in the midlands and northern regions; criticisms made about consistency with the ‘levelling-up’ agenda might be made again.

  3. The figures in the three southern regions (to 113.7K dpa) are an increase, but not by very much when one considers that the three southern regions have been delivering 93.3K dpa over the past three years. Those regions have been achieving this despite only partial local plan coverage, particularly in areas of Green Belt where rates of development are very low. The new figures appear to be readily achievable if those regions can secure local plan coverage. The reduction from the mutant algorithm’s 137K dpa figure is a stark measure of the political change that has occurred.

Whither the OxCam Corridor?

The authorities in the OxCam corridor have delivered an average of just over 22K dwellings per year in the last three years (to 2020); slightly more than the standard method indicated was needed (before any urban uplift) – 21K[9]. But none of the cities in the corridor fall within the 20 largest urban areas to which a 35% uplift is applied – meaning that the number across the arc will remain at just under 21K dpa for the foreseeable future.
This falls below the identified need for between 23,000 and 30,000 homes to support transformation economic growth across the arc, as identified by the National Infrastructure Commission. This ultimately means that Government is reliant upon authorities in the OxCam corridor voluntarily ‘doing more’ than the minimum housing need figure if it wants to fulfil the arc’s economic potential. There is nothing in the PPG to prevent this – indeed, it is encouraged. But it is interesting how the corridor - a longstanding national policy priority - did not similarly feed its way into the revised method as part of the new ('policy-on') uplift.

The Government has reiterated the 2023 deadline for Local Plans

In the WMS, the Secretary of State commented on the timescale for implementation of the wider reforms in the White Paper, saying that the Government:
“will publish a response in the Spring which will setting out our decisions on the proposed way forward, including to prepare for legislation, should we so decide, in the Autumn.”
Whatever the parliamentary passage of that primary legislation, this will be only the first step in a journey that will also involve secondary legislation, policy and guidance to be concluded before any local authority begins its 30 month plan preparation period. There is, quite simply, no realistic prospect of the White Paper providing the framework for practical plan making over the next few years. Despite this, some LPAs have taken the view that they should halt plan making to wait for the new system.
The Government has therefore made plain in its response to the consultation that:
“The government wants to ensure that work continues to progress Local Plans through to adoption as soon as possible and, at a minimum, by the end of 2023 to help ensure that the economy can rebound from COVID-19.”
The December 2023 deadline was the basis of the Secretary of State’s announcement in March 2020[10] which included the following threat:
"The government will prepare to intervene where local authorities fail to meet the deadline in accordance with the existing statutory powers, considering appropriate action on a case by case basis."
The Government will need to monitor closely how quickly the local plan making system – which has stalled due to White Paper, SM and COVID uncertainty – gets back in the saddle and progresses with plan-making. There are a significant number of local authorities where plans will fall beyond the five years-from adoption threshold over the next 2-3 years and need new plans.
Putting all of the above together, one overwhelming conclusion becomes apparent…

It is unlikely the SM alone will lead to 300K by the mid 2020s.

Outside London, the new SM adds up to 204,000 dpa. It is only London’s heroic figure of 93.5K that means the new method gets close to 300K, and we know this is a task for the new London Plan that may take five years to put in place, even before it delivers new homes on the ground. There have to be very significant doubts over the prospect of London hitting that figure given past rates of delivery.
There is little evidence that many local authorities are actively seeking to exceed the standard method, despite it being a minimum starting point; in fact, there are examples of areas ratcheting down their ambitions in response to it. We may see some areas continue with higher build rates, but that may diminish as plans are reviewed based on the new method. The Government would need to introduce significant complementary incentives for areas to go above their numbers.
The duty to cooperate has not proved an effective mechanism for the timely resolution of unmet needs in areas of constraints, and we are unlikely to have a sequencing of new local plan production before the December 2023 deadline that ensures all areas are preparing plans at the same time such that needs are met across wider areas. There is so far little evidence that the strategic plan making ambitions being pursued in many areas are proving an effective or responsive way of addressing these matters.
With a fair wind, the proposals in the new SM are a recipe for maintaining (just) current national rates of housing delivery, but seem unlikely to get England over the 300K hurdle.

[1] The consensus is that it’s really only a formula, but ‘algorithm’ is more à la mode.[2] The Ministerial Statement is available here[3] The response to the consultation can be downloaded here[4] The PPG can be accessed here[5] The figures can be downloaded here[6] Office for National Statistics list of Major Towns and Cities[7] Definitions clearly set out in Gallagher Estates and Lioncourt Homes vs Solihull MBC [2014] EWHC 1283 (Admin) https://www.bailii.org/ew/cases/EWHC/Admin/2014/1283.html[8] As set out in her letter[9] MHCLG indicative figures suggest the new SM yields 200 dpa more in the corridor, but this is due to a gremlin for Oxford which did not take account of the recently adopted Plan (impacting on the cap). No cities in the OxCam corridor feature in ‘the list’ of top 20 cities and urban centres.[10] https://www.gov.uk/government/publications/planning-for-the-future/planning-for-the-future


CONTINUE READING