Planning matters

Our award winning blog gives a fresh perspective on the latest trends in planning and development.

London, housing supply and the Green Belt – a complex relationship
Without a doubt, the UK housing crisis is most acute in the capital. Not a day goes by without a story on prices, the need for housing, or how to / where to / why to build more homes in London. Most recently, an old, controversial topic was re-introduced – building homes on the Green Belt.

The context for this debate is crucially important - there is no one, single solution. But understanding the context within which the Green Belt debate sits is vital to building homes.

So, here are six key London housing issues to remember.
  1. The Green Belt is a significant area of land around London but there are other constraints on development too.
In outer London boroughs, 28% of land is Green Belt (which is a planning designation designed to prevent towns from expanding, not a landscape or ecological one), reaching as high as 54% in one borough. However, beyond the Green Belt 34% of land is covered by other constraints that national planning policy says may also restrict development, such as Areas of Outstanding Natural Beauty and National Parks.

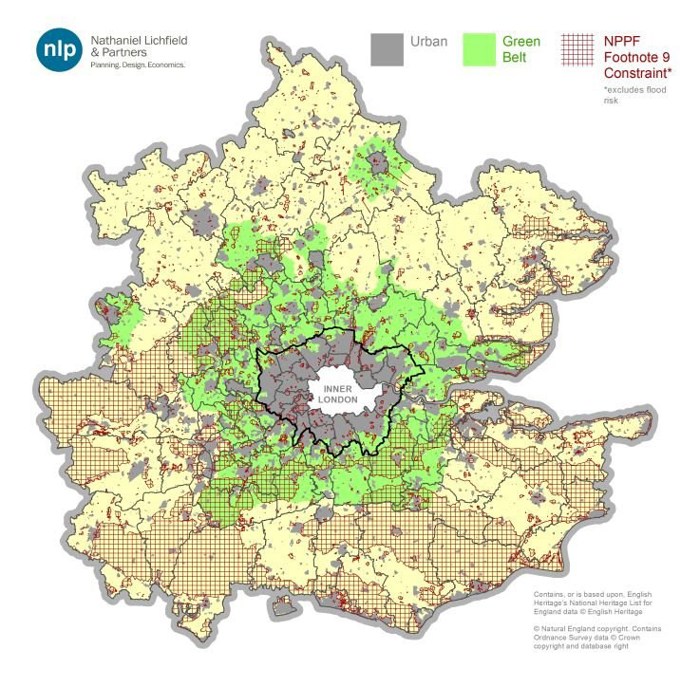
Figure 1: London, Green Belt and footnote 9 constraints | Source: NLP Analysis

  1. Demand for homes inside London is high but supply is falling well short.
The Mayor’s most recent iteration of his London Plan set out a need for between 49,000 and 62,000 homes per year, but the planning inspector who scrutinised it, said current policies meant London would not be able to meet this need, and set a more realistic annual target of 42,000 homes. In 2015, just 25,000 homes were built, and although output is expected to grow for 2016, it will be below what’s required. If need is not able to be met in the capital it will ‘overspill’ to neighbouring areas.

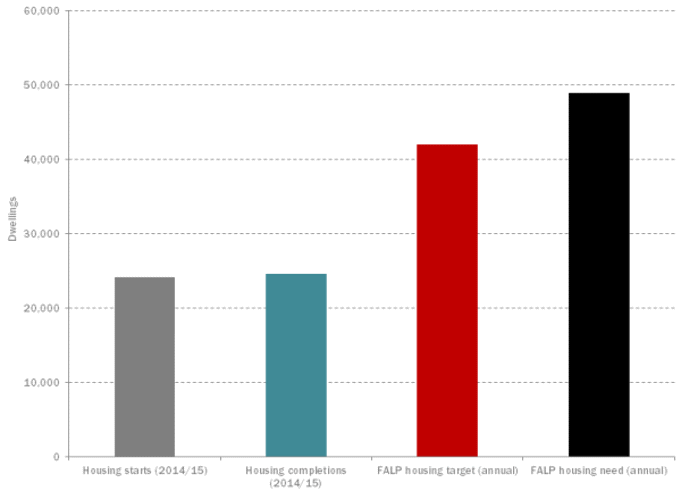
Figure 2: Housing starts, completions, target and need in London | Source: DCLG; FALP; NLP analysis

  1. London’s housing market influence reaches far beyond its outer boundary.
Because London is a magnet for people wanting to live and work here, household growth continues apace. London’s overspill needs puts pressure on surrounding areas in the commuter belt, but many of these places have their own housing needs which many already struggle to meet, due to Green Belt and other constraints. This raises prospect of the double overspill – pushing housing to locations even further out from London, with longer and more expensive commutes for many.

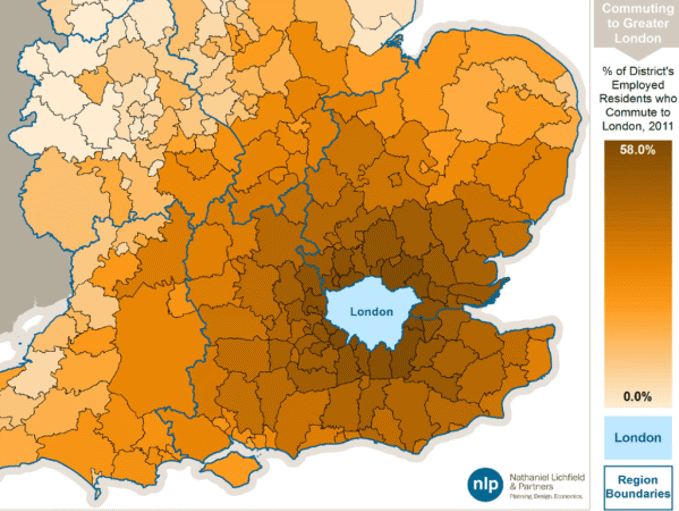
Figure 3: Proportion of district’s employed residents that commute to London | Source: ONS; NLP analysis

  1. Housing undersupply means London house prices are extremely high.
House prices in London are now almost 50% higher (in nominal terms) than the pre-crash peak – prices in the UK excluding London are only 12% higher.

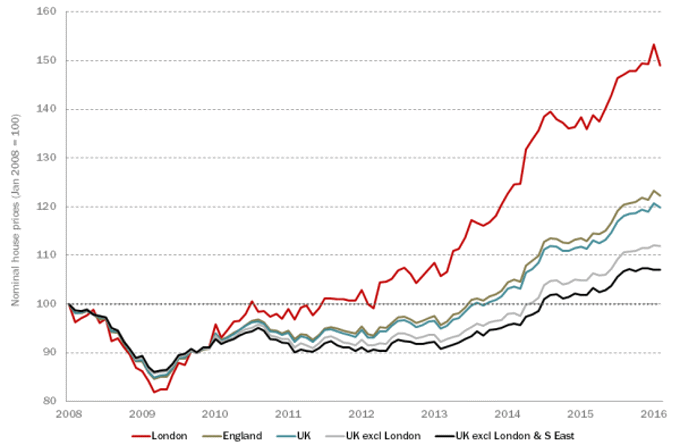
Figure 4: Nominal house prices since the pre-crash peak | Source: ONS; NLP analysis

  1. Brownfield land isn’t a panacea.
While it is important to consider all types of land for development, brownfield land often has viability and remediation difficulties before houses can be built. It is not always in locations where people are willing to live, and is often currently used to accommodate London’s industries, who would need to be relocated. And, it won’t last forever: in London, even if we only used brownfield land to fully meet the capital’s annual housing need, we would run out completely in six years.

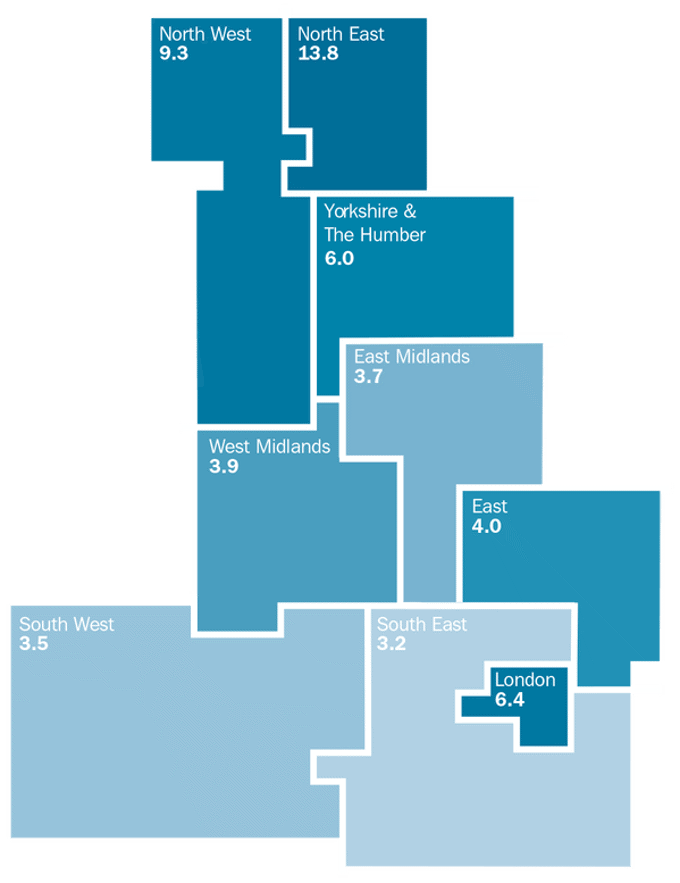
Figure 5: The number of years suitable brownfield land for housing would last if only this land met annual need | Source: NLUD-PDL; NLP analysis

  1. Local plans progress can be slow.
The Government wants local councils to prepare Local Plans to ensure that land is identified for housing to meet needs. But progress is slow. Nationally, just a third of Local Authorities have an up-to-date Local Plan, and for those Green Belt areas surrounding London, the figure is a derisory 15%. The Government has said it expects Councils to produce new Plans by “early 2017” or risk intervention and is considering further reforms. No-one yet knows how this will play out, but until Plans are in place, London and its hinterland will fail to plan effectively for the homes that are needed.

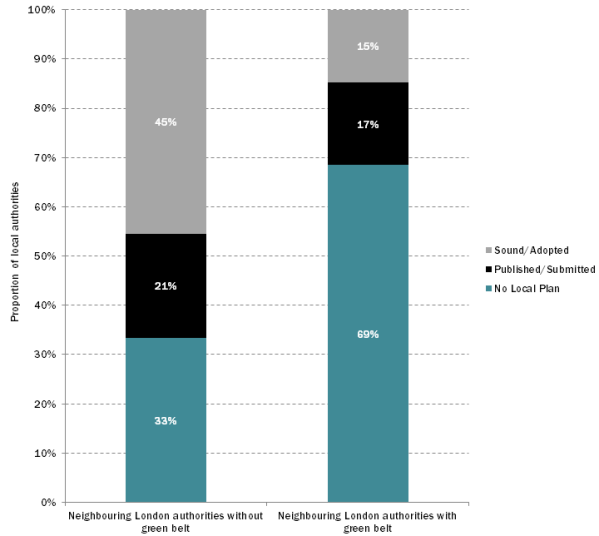
Figure 6: Local plan progress in areas surrounding London | Source: PINS; NLP analysis

No-one yet knows how this will play out, but until plans are in place, London and its hinterland will fail to plan effectively for the homes that are needed.


CONTINUE READING

Getting to Grips with Functional Economic Market Areas
The principle of Functional Economic Market Areas (FEMAs) is of longstanding relevance for spatial and economic planning. However, until recently, it was not always being clearly applied in practice, even under the Regional Strategy regime: most local authorities produced economic evidence based on their local authority boundaries, and made general reference to their neighbouring authorities. However, the Government’s Planning Practice Guidance (PPG) published in 2014 gave FEMAs far more prominence: it states that economic development needs should be assessed in relation to relevant FEMAs - that is, the spatial level at which local economies and markets actually operate (in most cases extending beyond administrative boundaries). In that sense, it is analogous to the role of Housing Market Areas (HMAs) in assessing housing need.

To support our clients to meet this requirement, NLP has developed FEMAplan: a framework for assessing the scope and nature of FEMAs. Having applied this framework for some of the first post-PPG FEMA mapping exercises across the country, it seemed like a good time to reflect on what we have learned, how this has shaped our thinking about the geography of local economies, and what this might mean for local authorities and their partners when it comes to planning for, and delivering, economic growth. Some key observations and reflections are set out below.

Across the guidance (PPG and previous Government notes), a number of key themes and factors are identified as useful approaches or ways of thinking about the economic geography of a local area. These themes shape FEMAplan and are summarised in the Figure below.
When undertaking FEMA analysis, explore the opportunity to collaborate with neighbouring authorities and partners, shaping the scope of analysis together and sharing resources if possible. This approach has been taken in Thames Valley Berkshire where NLP recently supported the Thames Valley Berkshire Local Enterprise Partnership (LEP) and six Berkshire authorities to examine the economic linkages and relationships that exist across the area. This sub-regional partnership approach also worked well in Sheffield and Rotherham, Hertfordshire and Bedfordshire, using the latest data to revisit and re-examine established economic relationships and networks.

Example Commercial Property Market Area Analysis

Be clear from the outset what the purpose of the FEMA analysis is. Is it needed to define the geographical area of analysis for an economic strategy or employment land study, to inform Local Plan policies or Infrastructure Plans? FEMAplan has been used to explore a range of policy issues, from an assessment of the potential scope for new strategic employment sites within the ‘Gatwick Diamond’ to appraising current economic performance and potential across the Greater Brighton and Coastal West Sussex area.

Draw on existing data and analysis as far as possible, with published studies often containing a wealth of intelligence and analysis. When it comes to synthesising this information with new intelligence and data, try and remain open to different ways of thinking about economic geographies and flows of people, goods and capital, particularly where this might deviate somewhat from the ‘status quo’. Our recent work in Berkshire looked beyond the well-recognised concept of an M4 Western Corridor to identify three distinct sub-market areas operating within the Thames Valley (see Figure below), each with their own unique characteristics and profile of occupier demand.

Sub Market Areas in Thames Valley Berkshire

Once a range of factors for mapping FEMAs has been chosen, collating the evidence into a single FEMA boundary can prove challenging; ultimately an element of judgement will be required. One approach could be to consider the ‘degree’ of relationship or overlap with adjoining and nearby authorities across different indicators. In Bracknell Forest, this exercise found that functional linkages with adjoining Windsor & Maidenhead were stronger in commercial property and labour market terms than they were for housing and consumer markets. This evidence will help to determine where cross boundary cooperation will be required on particular strategic planning issues.

Analysing the spatial extent and nature of FEMAs also provides a great opportunity to use powerful GIS, mapping and graphics tools to convey sometimes complex and unfamiliar geographies in a user friendly and digestible format. FEMAplan uses NLP’s market-leading Spatial Analytics skills to capture a broad array of economic information and analysis in a visually appealing and creative way. For example, business sector mapping was used to identify the spatial distribution of business activity and clustering of sector specialisms across the Nottingham Core and Outer Housing Market Area (HMA), as illustrated below. This intelligence was used to help shape a spatial strategy for accommodating business needs across the HMA.
As part of the process of streamlining local plans, recent recommendations made by the Government-appointed Local Plans Expert Group pointed to the potential for government to update national evidence on the definition of HMAs, as well as aiming for coordination between economic and housing planning boundaries to facilitate more effective strategic planning. A sound understanding of economic geography will be key to the outcome of this recommendation being taken up, and we will be watching with interest to see how local planning authorities and their partners apply this evidence and use it to shape their development strategies, and their cross- boundary ‘duty to cooperate’ discussions in the months ahead.

Find out more about FEMAplan and how it can be used to examine functional economic geographies by getting in touch.
 

CONTINUE READING

The social impact of the undersupply of housing
The appeal of owning a house remains strong. According to research more than three quarters of under-25s still aspire to own their own home. Yet there exists a massive shortage of houses for us young people to buy.  A shortage of houses means sky high house prices, and a generation of people who feel locked out of the market.

The economic benefits of housebuilding are clear - for instance, NLP research demonstrated that the UK housebuilding industry employs over 600,000 people and generates at least £1.4bn in tax revenue. Yet less is made of the more subtle, harder-to-capture social benefits of owning your own home – something which seems increasingly out of reach for my generation.

It almost seems too simple to explain the root cause of the housing crisis as simply a case of supply and demand – but in truth it really is. A mixture of increased demand has been combined with a lack of supply to mean that housebuilding has simply not kept pace with demographic and social trends.
These forces have combined to drive house prices sky high (over just the ten years between 2001 and 2011 the average price of a home increased from 7.4 times the average salary to 11.1 times).  As a consequence, more and more young people have to enter into the private rental market, and for most owning their own house is an all too distant possibility. Research by the think tank IPPR shows that half of all those renting privately think it will be at least 10 years before they can even think of buying their own home.

Some might ask why my generation should even want to buy their own house? Germany is often cited as an example of a well-functioning economy with low rates of home-ownership. Two main reasons exist - first is the economic one. By paying rent to a landlord instead of mortgage repayments, one is essentially losing out on owning a valuable asset. Yet the aspiration to own one’s own house is more than about money. Young people, just as their parents’ generation did, want somewhere that feels like home - a place that we can put our own stamp on, to feel safe and secure in, or a place to start a family. It should come as no surprise that home ownership has been associated with increased life satisfaction, whereas not owning a home has been found to make young people delay achieving major life ambitions – polling shows one in five of those who have never had children said they’re delayed starting a family because they didn’t own their own home.

Homeowners are more likely to become more involved in neighborhood groups as a way to establish ties with others and integrate in a new community. Renters who move, however, are less likely to turn to civic participation as a way to build new social network ties. A locked-out generation of young people means an unsettled generation, and an unsettled generation will lead to unsettled communities. IPPR analysis finds that owning a home increases someone's sense of belonging to a neighbourhood as much as simply living there without owning for fourteen years. For example, when controlling for all other variables, an individual who has lived in the same home for 20 years yet does not own it is likely to feel only the same sense of neighbourhood belonging as someone who owns their home but has lived in it for just 6 years.

Whilst renting may make sense for those in their early 20s, the UK rental sector is not as secure for those who want a long-term home (in Germany, leases are generally indefinite, and landlords can only evict for specified reasons, whereas in the UK, landlords are generally able to evict tenants with two months’ notice).  Many students, having graduated, are priced out of renting independently (especially in London) so have been forced to live with their parents in order to save even to be able to afford to rent – but this has been shown to arrest development and affect relationships (such as the ability to find a partner)

One way the Government is trying to increase the number of young people entering the housing market is through the provision of ‘starter homes’ - sold at 80% of the full market value to first time buyers for the most part under the age of 40 (and as currently proposed, over 23).  Whilst the technical details are yet to be fixed, developers will be able to provide starter homes as part of meeting their overall affordable housing requirement - which some critics have suggested would lead to the continued decline in the overall number of affordable housing units being built.

What makes this so frustrating is that the simplest solution to fix the housing crisis – building many more houses in as many tenures as possible – is severely restricted by the political hot potato of protecting the Green Belt. The Green Belt - whilst conjuring up images of pleasant English rolling hills and scenic landscapes - includes land which is covered by airports, quarries, railway embankments and sewage works (oh and golf courses – more land in Surrey is covered by golf courses than housing). It has been claimed that the release of just 3.7% of London’s Green Belt would provide land to build up to a million homes.

This crisis will not be solved until politicians not only accept the scale of the crisis but the obvious solution lying under their noses.

It should now be obvious that Britain needs to build many more homes. Housebuiliding provide a massive boost to Treasury coffers - housebuilding creates jobs and tax revenues not just directly through construction, but also indirectly through fitting them out them with kitchens, curtains and carpets. Yet even more importantly it is necessary for my generation, which has exactly the same aspirations that my parents had. Building enough houses which people can call home - a place they feel safe in and feel happy to raise a family in - will in turn be good for society as a whole.


CONTINUE READING

Great Western Cities - Fraternising with the Competition?
In February 2016, Metro Dynamics published the long awaited ‘Britain’s Western Powerhouse’ report, commissioned to develop the economic case for the Great Western Cities Powerhouse (GWCP) following the launch of the concept a year earlier.

The GWCP proposes economic partnership between Cardiff, Newport and Bristol and specifically seeks to maximise the benefits of ‘constructed agglomeration’. Buzz words aside, this essentially means that collaboration between the multiple core cities will achieve greater economic prosperity or more simply, three heads are better than one.

The document focuses primarily on economic potential, connectivity and renewable energy and includes some impressive statistics on how direct improvements could achieve the identified agglomeration benefits. However, my initial reading of the document is that it shies away from the subject of delivery, simply pushing these issues towards the City Regions.

For example, as someone who frequently travels between Cardiff and Bristol, I immediately turned to the Connectivity section where I was greeted with impressive statistics that a 20 minute reduction in train journey time between Cardiff and Bristol would amount to annual benefits of £32.5m (and possibly even, a seat on the train!). However, beyond reference to the planned electrification works and planned improvements within each City Region, there is very limited reference as to how and if such a reduction could be achieved or if the GWCP is even necessary to realise it.
Turning to the City Regions themselves, it is unclear as to how the GWCP will sit alongside the Cardiff Capital City Deal (signed on 15 March 2016) and the Bristol and West of England City Region Deal (signed in 2012). In the case of Bristol this has arguably become even more of an issue given the Chancellor’s budget announcement that the West of England Devolution Agreement had been signed on 16 March 2016.

This Devolution Agreement marks the next step in a progressive process of devolution of funding, building on the 2012 City Deal and the Growth Deals (agreed in July 2014 and January 2015) and a "metro mayor" will oversee the new combined authority, a detail which has also been the cause of significant debate in recent weeks with some quarters labelling it as yet another unwanted bureaucratic tier while others view it as a positive stride towards greater economic prosperity.

As noted in the press, many of those involved in the devolution agreement have spoken out against the GWCP, seeing it as a threat to the West of England. In particular, the authorities neighbouring Bristol have spoken out, stating that they have been left out of the process and are now caught in the middle.

Whilst I do not wish to discuss the politics of the situation, it does beg the question as to how these various layers will sit together over the coming years. George Ferguson has called the GWCP complementary to the devolution process and considers that it will not cut across the devolution plans. However, it is clear that there are tensions building and the potential for Bristol to be pulled in two different directions. I will not even get started on what could happen following the Bristol Mayoral Elections in May.

The Metro Dynamics Report is very effective at highlighting the clear potential of the Great Western Cities although it needs to go further regarding how the different City Region objectives can be married.

Looking to the north, the Northern Powerhouse which also encompasses several City Deals is portrayed as a real positive and the Liverpool devolution announcement in March has been embraced as a significant boost for the Powerhouse overall. It seems that despite various competing factors (i.e. airports, universities and football teams), there is a real drive to work collaboratively for the greater good.

It is acknowledged that the western situation is slightly different, given the overlap between the GWCP and the City Deals and it is understandable that those sitting outside of the GWCP might be wondering what it will mean moving forwards. However, all parties do at least agree that the west deserves similar levels of investment and it must be recognised that there is more influence in numbers.

Personally, I hope that the GWCP and the City Regions can work collaboratively to achieve the aspirations which have the potential to significantly benefit the region overall and will watch with interest over the coming months.


Source: Metro Dynamics – Britain’s Western Powerhouse February 2016


CONTINUE READING