Planning matters

Our award winning blog gives a fresh perspective on the latest trends in planning and development.

Ljubljana: a city that is embracing the Green Agenda
First impressions of a city are important. Ljubljana, Slovenia is a treasure; it does not disappoint. The city has a variety of architectural influences, including communist era housing blocks (although few in number); however it is the meticulously detailed and maintained public realm that makes the city distinctive, constantly drawing one’s eye to new areas of interest. European Green Capital of the year, 2016, it is in transition and taking strides towards becoming an exemplar of environmentally friendly strategies and civic initiatives.

Figure 1: Ljubljanica river with the Joze Plecnik-designed three bridges in background

A little context: Ljubljana is centrally located within Slovenia, on the Ljubljanica river. With Roman origins, the built form of the city has significant Italian, Austrian and German influences. Jože Plečnik (1872-1957) is often credited as the designer with the most influence on the form of the city, with several of its cultural highlights designed by the much-admired architect and planner. However it is the high quality of materials and design generally that make this city distinctive. Design permeates each street and space, a common palette of materials helping to create a coherent whole.

Figure 2: Joze Plecnik-designed riverfront


Figure 3: Left to right – (i) Dragon Bridge, (ii) steel dragon on Ljubljana Castle wall, (iii) Mesarski Bridge (art installation) and (iv) water feature integrated within Kljucavnicarska ulica laneway

Approximately 275,000 people call the city their home, which is administered by a typical European municipal system led by a mayor. The current mayor is Zoran Jankovic, who came to power in 2006 and quickly started making significant changes. Responding to chronic traffic issues within a medieval street structure, a sizeable car free zone was established (approximately 10 hectares) within the first year of his four year term. Commercial concerns were quickly allayed, as people and businesses flocked to the calm, yet vibrant pedestrian environment.

Figure 4: Car free zone defined by bollards: collapsible bollards controlled by sensors denoted by white squares

The success of the car free zone has been supported by several complementary measures. Cycleways have been carefully and creatively integrated into the public realm of the city, using materials that complement the streetscape. Unlike other celebrated cycling cities, there aren’t high speed pelotons who can intimidate pedestrians. Bike share schemes are conveniently located within and around the car free zone and are fully integrated with the public transport system of the city.

Figure 5: Clockwise from top left – (1) Bicike(lj) bicycle hire station, (2) cycleway defined by simple red line approaching shared surface in front of Slovenian Parliament building, (3) bike access designed into stairs using granite setts and (4) cycleway delineated by flush kerb to carriageway and granite setts to pavement

Park and ride locations have been established on the perimeter of the Zone, to help commuters and a free hail and ride service of electric ‘Kavalirs’ (‘gentle helpers’) have been provided to cater for the elderly or less physically able who might struggle with the 15 minute walk from one side of the Zone to the other. On the theme of accessibility, the city has also provided a contemporary-styled funicular for visitors who don’t fancy the 15 minute hike up to the Roman castle which overlooks the city.

Figure 6: Left to right – (i) Free hail and ride Kavalir – an electric bus within car free zone, (ii) Funicular providing access to Ljubljana castle and (iii) the alternative hiking route up to the Castle

The mantra of ‘Reduce, Reuse, Recycle’ can be seen in action all over the city. One instantly notices the variety of recycling bins provided throughout. The city separates 65% of its waste - exceeding targets set for 2020; its next target is a zero waste strategy by 2025. The city has also adopted underground collection, providing greater capacity for storage and reduced servicing costs.

Figure 7: Left to right – (i) Simple separation of waste within traditional waste bin and (ii) waste bins and underground waste storage

A sense of social engagement and initiative is noticeable whilst exploring the city. The Metalkova district is a haven for alternative cultures within walking distance of the city centre. What began as squatters taking advantage of a derelict military barracks has evolved into a thriving centre of alternative culture that has produced numerous spin-off enterprises. The city has been happy to let this alterative hub scene grow:
It’s a place for critical reflection, civic engagement – and with its activities it is establishing Ljubljana as an area where ideas of all generations can freely flow.

(Zoran Jankovic)[i].

Whilst Metalkova is an easily identifiable example, more subtle bottom up planning initiatives can be seen throughout the city. Groups such as Prostoroz have successfully used crowd-sourced campaigns to demonstrate how stagnant urban sites can be used for urban allotments and social engagement projects such as the Library of Things (think a mixture of a library and Argos).

Figure 8: Metalkova district of Ljubljana

Ljubljana is a city that has been carefully designed and creatively adapted at a variety of scales. Thoughtful consideration can be seen in each intervention - from the strategic level car free zone to the skilful integration of cycle lanes and detailing of the streetscape. The result is a fascinating and vibrant capital city.

[i] https://www.theguardian.com/cities/2015/jul/24/metelkova-ljubljana-abandoned-barracks-europe-squat

CONTINUE READING

Sealing the Deal: the Cardiff Capital Region needs homes
This blog forms the first in a series on the implications of the Cardiff Capital Region City Deal on planning for housing in South East Wales.
With the Cardiff Capital Region (CCR) City Deal programme now underway, there are compelling reasons to believe that South East Wales is an area on the up.
The City Deal, worth £1.2 billion, aims to provide a 5% uplift in GVA and create up to 25,000 new jobs by 2036, representing a 40% increase above forecasted levels of growth. However, by taking a step back and viewing the CCR in its wider UK context, we see a less confident picture – one of a region with a smaller, more fragile economy that has the potential to fall behind in relation to the rest of the country if care is not taken to support its future growth. As we explore in this series of blogs and in our latest Insight Focus, a vital part of this support is the provision of a sufficient number and appropriate mix of new homes in the right locations.
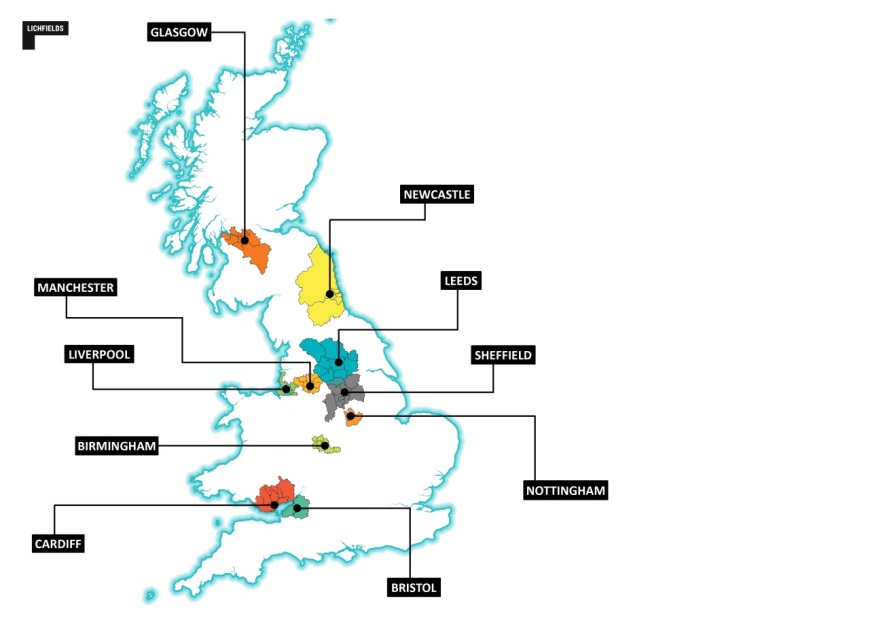
Cardiff is part of the Core Cities Group, which represents the ten largest and most economically important cities outside London. Each of the Core Cities is, in fact, a city region, which includes a number of local authority areas (see figure 1). These city regions have been identified as comparators by the Growth and Competitiveness Commission (established as part of the CCR City Deal). In this blog, I compare the economic performance of the CCR against these other areas and identify the initial implications for housing policy.
Figure 1 Core City regions

Source: The Core Cities Group

Economic status
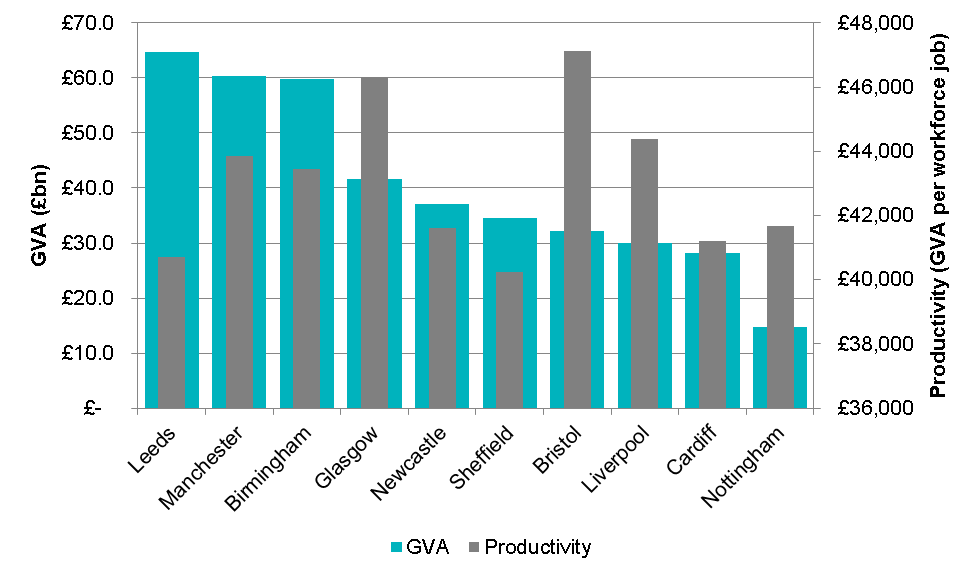
With an annual GVA of £28.3 billion in 2017, the CCR has the second smallest economy of the 10 UK Core City regions. Taking into account its size, the CCR currently has the third lowest level of productivity, at £41,192 GVA created per workforce job, whilst Bristol has the highest at £47,129 per job (see figure 2). Interestingly, despite having the largest economy at £64.7bn, Leeds has the second lowest level of productivity at £40,718 per job. This highlights the importance of considering both indicators in assessing the economic well-being of an area. The fact that the CCR performs poorly in relation to each is troubling.
Figure 2 Total GVA / productivity by Core City region (2017)

Source: Lichfields analysis of Experian data (March 2017 release)

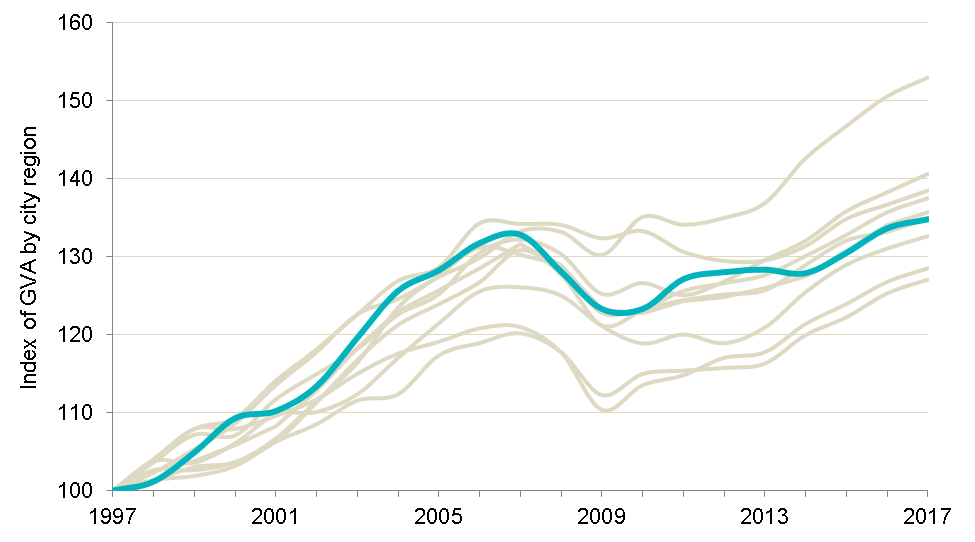
The CCR achieved the second highest level of GVA growth among the Core Cities between 1997 and 2006. However, by 2014 its GVA growth had fallen to the lower half of the Core Cities group and it took nine years for its economy to recover to pre-recession levels following the financial crisis in 2007, such that by 2017 it was only middle-ranking in terms of GVA growth (see figure 3).


Figure 3 GVA all sectors: indexed to 1997 levels

Source: Lichfields analysis of Experian data (March 2017 release)

Similarly, the CCR experienced the highest level of workforce job growth of all of the Core Cities between 1997 and 2006 but had been overtaken by half of the other Core Cities by 2017.
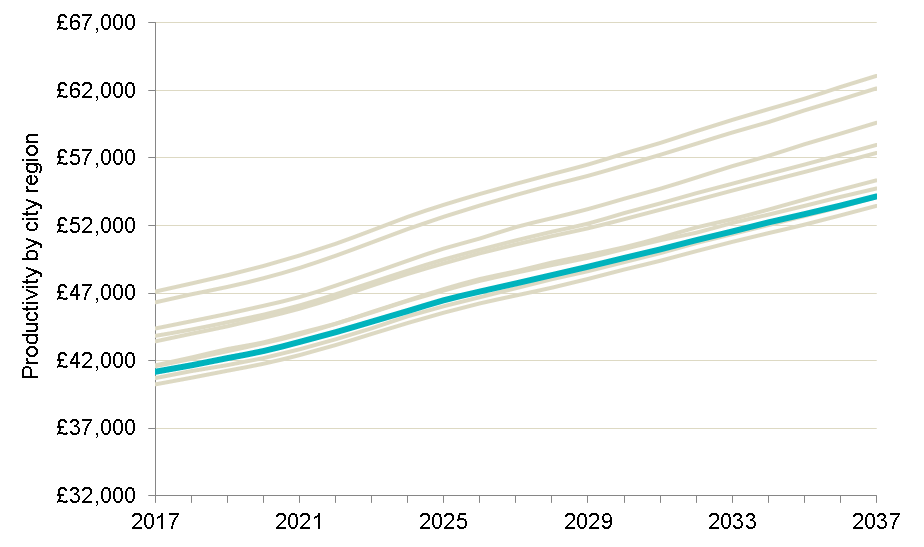
If current trends continue, the CCR’s economy is expected to remain in the middle of the group of Core Cities in terms of GVA, workforce jobs and full-time equivalent (FTE) job growth in the period from 2017 to 2037 (see figure 4). However, its productivity is anticipated to remain at the lower end of the Core Cities group, with the smallest increase (31.5%) of all of the city regions, compared to an average increase of 32.9%.
Figure 4 Forecast productivity

Source: Lichfields analysis of Experian data (March 2017 release)

High tech sectors

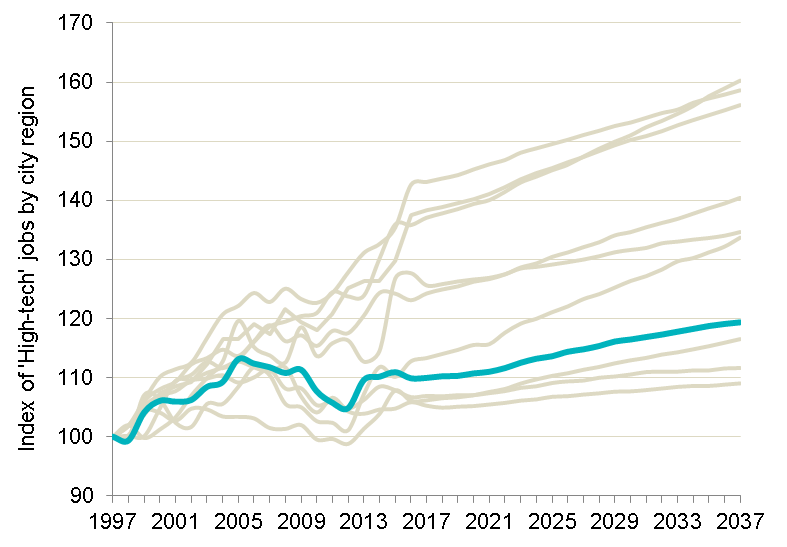
As key drivers of productivity and sources of well-paid jobs, the high tech sectors are an important indicator of economic health. Between 1997 and 2017, there was a 10% increase in high tech jobs in the CCR (the third lowest across the Core Cities), compared to the highest increase of 43.1% in Sheffield. From 2017 to 2037, the CCR’s high tech sectors are expected to grow by only 8.6%. This indicates that a continuation of current conditions will not be sufficient to deliver the desired boost in highly skilled jobs.


Figure 5 Index of high tech jobs by city region

Source: Lichfields analysis of Experian data (March 2017 release)

Part of this issue relates to the difficulty faced by the CCR in losing graduates, particularly in STEM (science, technology, engineering and mathematics) subjects, to other areas – despite benefiting from internationally competitive higher education and further education institutions.


Economic headlines
Current economic status:
  1. 2nd smallest economy of the ten UK Core City regions, with an annual GVA of £28.3 billion in 2017 (see figure 2).
  2. 3rd lowest level of productivity (GVA per workforce job), with £41,192 GVA created per workforce job, whilst neighbouring Bristol has the highest productivity at £47,129 per job (see figure 2).
  3. Nine years for its economy to recover to pre-recession levels following the financial crisis in 2007.
  4. Experienced the third lowest increase (10.0%) in high technology jobs across the Core City regions between 1997 and 2017.
If current conditions continue:
  1. Expected to remain at the middle of the group of Core City regions in terms of GVA, workforce jobs and FTE job growth in the period from 2017 to 2037.
  2. Anticipated to continue at the lower end of the Core Cities group in terms of productivity, with the smallest increase (31.5%) of all of the regions between 2017 and 2037.
  3. Only 8.6% growth expected in high tech sector jobs between 2017 and 2037.


The need for the CCR City Deal is clear. Without appropriate support and investment, the future success of the CCR economy is uncertain. It is also worth bearing in mind that a number of the other Core Cities have their own City Deals, and all will be seeking to improve their future economic performance.

Even with the City Deal in place, meeting its goals will be challenging, particularly given the modest projected growth in high tech sectors in the CCR. In order to increase high tech growth, it will be important to address the issue of retention of graduates, particularly in STEM subjects.

Making the link between the economy and housing: we need workers

The vibrant economy of the CCR City Deal needs a vibrant and growing population, including young people and highly skilled workers. The CCR can only hope to attract and retain workers with these characteristics if it can offer a sufficient number of homes of the right type and quality in suitable, accessible and desirable locations. There is also the moral duty to accommodate the area’s ageing population and those who are unable to afford market housing, many of whom (in both categories) will still be active contributors to the local economy.

The City Deal programme is taking place amid a complex policy landscape of adopted and emerging Local Development Plans and Plan Reviews, the proposed Strategic Development Plan at the regional level and the National Development Framework for Wales. There are a number of key questions which will need to be debated over the coming months, including how to coordinate the next set of development plans and their policies, how to boost housing delivery, and what constitutes an appropriate distribution of new homes across the region.

We will explore these issues and what they mean for housing policy in South East Wales in our forthcoming blogs in this series.


© Lyndon Griffith / Alamy Stock Photo


CONTINUE READING

The right homes in the right places in the North East?
As the initial flurry of analysis of the implications of the Government’s ‘Planning for the right homes in the right places: consultation proposals’[1] settles, there is time to review the content of the proposals and digest what it might mean for the north and more specifically to the north east – my particular area of interest being based in the North East.
When a Council prepares a new Local Plan, the most controversial issue is almost always the number of homes to be built. The existing Planning Practice Guidance (PPG) provides a flexible approach to understanding local housing needs to enable Council’s to choose their own strategies. However, in reality this has meant that there is a great deal of room for debate when a draft Local Plan is tested at Examination.
As someone who deals with OAN debates on a regular basis, I agree that the process would benefit from a clearer approach which is more transparent and accessible to non-specialists, including the local community.
However, the devil is always in the detail and in developing a methodology (and associated policy and guidance) which can be applied nationally, the Government will clearly need to ensure that;
a) The needs assessments it generates are realistically deliverable;
b) It helps to address the housing crisis and driver higher levels of housing completions; and
c) It does not undermine regional strategies focussed upon economic growth objectives e.g. Northern Powerhouse.
Across the North the Government’s proposed approach would mean a 24% per annum reduction when compared to the current assessments of housing need. In the North East this would result in a 20% decrease annually. The consultation does recognise the figures are a starting point and that local authorities have the opportunity to make an uplift beyond these indicative numbers.
Figure 1 Government indicative housing need against current local assessment of need

Source: Government Data/Lichfields Analysis

The North East has tended to be a region that recognised the importance of building more homes. So, if this decrease was simply accepted by Councils as the end point for plans – rather than, as Government indicates, the start point - it would clearly be counter-intuitive. The difference between the Government identified numbers and current OAN reflects the very different underlying assumptions:
Government figures are based one 2014-based demographic projections (plus an uplift for affordability) which simply project forward past trends; and
Current OANs are largely economic-led, reflecting the need to increase jobs and attract and retain skilled workers.
Because housing delivery is intrinsically linked to economic growth, the new approach could constrain the economic growth ambitions of North Eastern authorities and in some cases actually lead to decline if local authorities in the region fail to think beyond the methodology alone. For example, in Sunderland if the Government’s methodology is used the labour force could reduce by almost 1,500 over 10 years as opposed to the 2,500 increase needed to support the economic strategy underpinning the emerging Local Plan.
In order for the North East to achieve its economic ambition there is a need to retain and attract workers and that is intrinsically linked to the quality of place on offer, which of course includes housing. Recent analysis of the net flow of migrants to London highlights County Durham experienced a significant net outflow between 2013 and 2016. Without an ambitious economic growth strategy and the housing to support it, there is likely to be a continued loss of population to the South, particularly of educated and skilled younger people. This is an unsustainable position and runs counter to what the Government is trying to achieve through the Northern Powerhouse agenda.
Figure 2 Net migration flows to London

Source: twitter @election_data

The Government proposals do provide some ‘hooks’ for ambitious local authorities who want to deliver more homes (paragraphs 28 and 46 of the consultation). However, there is little in the way of the detail needed to ensure that local authorities feel confident to pursue a housing number in excess of that provided through the standard methodology. This is an area requiring more thought and incentives.
Without this additional detail and clarity, there is a risk that local authorities may shy away from delivering the housing needed to support their economic aspirations. Sticking to the levels identified under the Government’s standard methodology could result in a level of housing which is more palatable to local communities and avoids the challenges associated with identifying extra housing sites. However, it would fail to deliver the economic growth ambitions for the North East.
There are also significant economic benefits which are generated through housing delivery. In addition to the direct jobs created in the construction of houses, new residents spend money resulting in increased jobs and local authority revenue through Council Tax. The impact of this is increased revenue funding for local authorities to invest in communities and help support wider investment programmes.
The Government’s proposals raise key issues which will require careful thought to ensure that the revised guidance supports the increase in housebuilding in the North East and across England by providing the incentives for local authorities to deliver housing beyond the minimum identified within the proposals.


[1] https://www.gov.uk/government/consultations/planning-for-the-right-homes-in-the-right-places-consultation-proposalsLichfields has prepared an Insight Focus which summarises and provides comment on the proposed housing need methodology http://lichfields.uk/media/3326/housing-need_sep-2017.pdf


CONTINUE READING

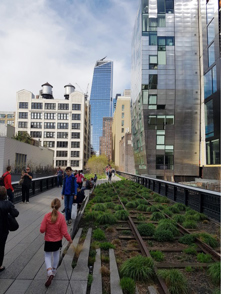
On a recent trip to New York City I visited the High Line, a 1.5 mile-long former elevated railway line built in 1934 to carry goods to and from Manhattan’s largest industrial district. Its elevated position allowed trains to load and unload their cargo inside buildings, without disturbing road traffic. The last train ran along the railway in 1980, leaving its obsolete infrastructure standing above the Meatpacking and Chelsea Districts of the city. It was envisaged that the structure would be demolished and indeed that was the call from local property owners in the 1980s. However the structure was not demolished and in 1999, in true Jane Jacobs style, ‘Friends of the High Line’ was founded by Joshua David and Robert Hammond[1], residents of the High Line neighbourhood, to advocate the High Line’s preservation and re-use as public open space. The inspiration was the Promenade Plantée in Paris, an elevated linear park built on top of obsolete railway infrastructure in Paris which opened in 1993.
Local support for the retention of the line grew and in 2004, the New York City government - spearheaded by the new business savvy mayor Michael Bloomberg - committed $50 million to help establish the proposed park. Construction began in 2006, with the design being led by landscape architect James Corner Field Operations. Whilst the initial idea was not that of urban planners, the project and the regeneration of the area were boosted by designation in June 2005 as the ‘The West Chelsea Special District’ by City planners - no doubt influenced by Bloomberg. This designation assisted in unlocking opportunities for new residential and commercial development, as well as facilitating the reuse of the High Line as a unique park and thoroughfare. The designation also set out regulations to ensure the preservation of light, air and views around the High Line so as to maintain the openness of the space.[2]
Rather than destroying this valuable piece of our history, we have recycled it into an innovative and exciting park that will provide more outdoor space for our citizens and create jobs and economic benefits for our City

Mayor Michael Bloomberg

Today, the High Line is a hive of activity, not only a valuable public open space for local residents but a tourist attraction in its own right, especially for an urban planner like me! The public park weaves itself around and underneath high rise buildings and above the busy car-dominated streets below. There is even an amphitheatre looking down at the traffic on 10th The landscaping is brilliantly designed and combines vegetation with remnants of, and references to the old railway, to create a truly fascinating sense of place.

Whilst walking along the route I couldn’t help noticing the scale and intensity of development taking place alongside the route and the fact that the High Line is being used as an unique selling point for a number of schemes. It became clear that the public open space attracts high density, private development and that homes in close proximity to the asset are using the High Line to justify higher house prices.

For a project that cost approximately $260 million to build, it is estimated that tax revenues from the impact of the High Line due to new development and increased local property values was $900 million over a 20 year period[3]. An additional $2 billion in new economic activity[4] is attributed to the High Line. On top of this, millions of tourists (7.6 million in 2015[5]) visit the park every year and spend money in the local area. The public open space is clearly an economic success. Interestingly, the delivery of the project was financed by a combination of public funds, money raised by the ‘Friends of the High Line’ group (including monetary gifts from wealthy backers) as well as finance from a planning obligation-style deal that allowed developers at three sites to build additional floors in exchange for improvements[6] (to the value of $22 million) to the High Line. Whilst walking along the route I couldn’t help noticing the scale and intensity of development taking place alongside the route and the fact that the High Line is being used as an unique selling point for a number of schemes. It became clear that the public open space attracts high density, private development and that homes in close proximity to the asset are using the High Line to justify higher house prices.

Wh
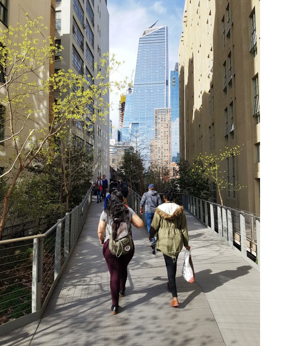
at Joshua David and Robert Hammond have done (with the help of some imaginative and persuasive residents, wealthy financial backers and New York City planners) is to successfully rethink the notion of traditional public open space by reusing leftover railway infrastructure. There is most definitely a lesson to be learnt for councils, developers and built environment professionals in the UK that public open space doesn’t have to be a swing, slide and roundabout and that open space doesn’t have to adhere to strict regulations such as the commonly-used FIT Standards in order to be successful. Similar schemes are now emerging across London such as the Peckham Coal Line, Southwark Low Line and Camden High Line suggesting that local authorities are starting to understand the benefits of alternative forms of open space.
The notion of public open space is often thought of in the traditional sense as a play area or a playing field. However as shown in New York City, public open space can be inherently different and when done well can act as a key catalyst for positive change. It can have a substantial positive impact on the economy, in parallel with the more obvious social and environmental benefits that are normally derived from open spaces.
 

[1] http://www.thehighline.org/about[2] http://global.ctbuh.org/resources/papers/download/2463-the-high-line-effect.pdf[3] New York’s High Line Park: An Example of Successful Economic Development by John Rainey http://greenplayllc.com/wp-content/uploads/2014/11/Highline.pdf[4] New York’s High Line Park: An Example of Successful Economic Development by John Rainey http://greenplayllc.com/wp-content/uploads/2014/11/Highline.pdf[5] http://www.thehighline.org/blog/2017/01/10/high-line-magazine-b1g-da-a-and-parks[6] http://www1.nyc.gov/office-of-the-mayor/news/108-06/mayor-bloomberg-friends-the-high-line-host-rail-lifting-ceremony-mark-start-of#/0

CONTINUE READING