Planning matters

Our award winning blog gives a fresh perspective on the latest trends in planning and development.

Delivering Infrastructure: A Government Pipe(line) Dream?

The Government growth agenda for infrastructure has gathered further momentum with the recent publication of the National Infrastructure and Construction Pipeline (NICP). The NICP is a forward looking publication of planned investment in infrastructure comprising both public and private sectors, and contains over 700 projects and programmes with a total value of more than £500 billion. Infrastructure, here, ranges from smart meters for energy suppliers to nuclear powers stations.

The Government has also published a new Funding and Finance Supplement setting out how planned investment in the pipeline supply is likely to be financed and the opportunities for private investment. These publications come hot on the heels of the Autumn Statement unveiling of the National Productivity Investment Fund (NPIF) that will direct £11 billion of additional investment into infrastructure projects and programmes across the UK, aimed at boosting productivity.

The NICP unashamedly showcases a wide range of projects and highlights that the country’s infrastructure sector is very much open for business and will continue to be post-Brexit. Indeed, significant private investment is needed to deliver the pipeline supply of projects and is estimated to make up more than half of the £300 billion of investment needed for the identified projects up to 2020/21, and a significant amount thereafter.

NLP has undertaken analysis of the project breakdown in the NICP. Figure 1 below provides a breakdown of the near £500 billion investment planned from 2016/17 onwards combining private and public sector investment for the main types of infrastructure. The largest sector in the pipeline supply is energy, totalling £206 billion. Unsurprisingly, nuclear power projects make the largest contribution to planned investment in this sector. The top 3 single largest projects all include nuclear power plants, and account for 22% of overall investment.

Figure 1: Infrastructure investment by sector

Source: NIC; NLP analysis

The next biggest sector is transport, with the total value being heavily skewed by High Speed 2 (accounting for 40% of the total planned investment).

Utilities are the third biggest sector with around £75 billion of investment to be directed towards electricity and gas transmission and distribution. The characteristics of this sector are inherently linked to the high performing energy sector. Interestingly, the utilities sector is the only sector identified in the NICP that is to be entirely funded by the private sector.

Around 40% of the £300 billion of projects up to 2020/21has been allocated to individual English regions - the other 60% cannot be allocated because it relates to schemes or programmes that cover multiple regions. Figure 2 below shows NLP’s analysis of the spatial variation of infrastructure investment from 2016/17 onwards.

Figure 2: Regional-specific infrastructure investment

Figure 2 Regional-specific infrastructure investment 

Source: NIC; NLP analysis

Different regions have different priorities allocated in terms of infrastructure investment. It is noteworthy that a focus for London will be significant investment in transport improvements, which accounts for over two-thirds of its £29 billion planned private and public investment. Crossrail and tube line modernisation represent 2 of the big ticket items for the Capital alongside a large range of other comparatively smaller projects. The NICP shows that the North West and South West regions will attract the largest share of investment in the energy sector compared to the other regions in England, which elevates them into 1st and 3rd place respectively in terms of total planned infrastructure investment for the English regions (over £36 billion and £22 billion respectively). This is largely accountable to significant sums of private sector investment in new nuclear power stations at Moorside (West Cumbria) and Hinkley Point (Somerset). London comes in 2nd overall, spurred on by its planned transport improvements.

NLP has also analysed the timings of planned investment which shows that the energy and transport sectors are planned to receive the majority of investment from 2016 onwards (Figure 3 below). A decline in investment is anticipated in the 2-year post-Brexit era (assuming the UK leaves in 2018), which could just be a coincidence.

Figure 3: Infrastructure analysis by year

Figure 3 Infrastructure analysis by year
Source: NIC; NLP analysis

Certainly ‘Brexit-blight’ has the potential to influence Government spending priorities and private investor confidence, and generally reduce potential sources of funding. For example, the role of The European Investment Bank (EIB) as a source of debt finance for infrastructure projects in the UK is noted in the Funding and Finance Supplement, as is the EU’s “Investment Plan for Europe” which uses a 21 billion euro guarantee fund to enable the EIB to lend to an increased range of infrastructure projects. Whilst the EIB has continued to approve and sign financing deals with UK projects since the referendum, with over £2 billion of EIB financing approved and over £400 million of deals signed for UK projects since 23 June 2016, this support is only likely to continue while we remain a Member State.

It is also notable that investment in infrastructure post 2020/21 is anticipated to be dominated by the energy sector, accounting for 63% (around £127 billion) of the total planned £201 billion. This sector is predominantly privately funded, with overseas investment playing a pivotal role. Economic volatility is likely to hamper the UK’s ability to attract this form of investment.

The Government’s ability to drive the economy forward in the post-Brexit era will therefore be integral to securing the necessary funding and achieving its growth ambitions for infrastructure development in the UK. The NICP and Funding and Finance Supplement will hopefully help by highlighting investment opportunities and inspiring investor confidence.

CONTINUE READING

Fit for Purpose: Assessing Open Space and Recreational Needs
Do you need help establishing open space and recreational needs for your local authority; or for your development project?

Introducing: Fit for Purpose.

NLP’s new ‘Fit for Purpose’ methodology is assisting public and privately sector clients plan more effectively for future needs. 

Fit for Purpose works by combining GIS mapping capabilities and catchment area analysis and presenting the quantifiable demand of additional facilities required in the local area through a tangible, accessible and clear infographic report seeking to offer practical ways forward.

The UK is an increasingly health conscious nation. UK gym membership is at an all-time high[1], the number of adults playing sports once a week is up 1.75 million over the past decade[2] and the Leisure Sector in the UK is now worth an estimated £60billion per annum[3].

This sectorial momentum shows no sign of abating, with Experian projecting that Leisure expenditure per person will increase by 25% over the next decade.

Despite this growing demand, NLP’s research shows, many local planning authorities’ do not have robust and up-to-date assessments of the need for sports and recreation facilities, as required by the NPPF, and are therefore struggling to determine what provision is required now and in the future.

Similarly, promoters and developers of large scale residential developments are being asked to contribute through CIL/ and planning obligations, or through the delivery of green infrastructure to meet the needs of new resident. Determining these requirements in different contexts can be complex.

In response, to this challenge, NLP has developed Fit for Purpose; an innovative cost efficient and robust methodology for quantifying existing and future needs for sport and recreational facilities within any defined area.

Think you could benefit from Fit for Purpose? Find out more about how NLP can help, and how to get in contact here.

[1] State of the UK Fitness Industry Report 2016, http://www.leisuredb.com/blog/2016/5/11/press-release-2016-state-of-the-uk-fitness-industry-report

[2] Sport England, https://www.sportengland.org/research/who-plays-sport/national-picture/

[3] Experian


CONTINUE READING

A cool down of London’s sharing economy? Airbnb enforces 90-day letting rule
In what has been dubbed as a dramatic policy shift Airbnb has announced that it will introduce a 90-day cap on the letting of entire homes in London from 2017.

In the context of worldwide opposition to Airbnb, the cap stems from concerns by local authorities and residents that the homesharing platform is exacerbating London’s housing crisis and having a negative effect on communities.

The change in approach is informed by research undertaken by the Institute of Public Policy Research (IPPR). It concludes that London’s housing crisis has been and is being primarily driven by the failure to build the new homes that London needs and that the effects of homesharing are “likely too small to be a significant contributor to the housing challenges that London faces”.

Notwithstanding this, the research warns that, if left unchecked, homesharing has the potential to damage housing supply by encouraging more landlords to move their properties out of the private rented sector and into the short-term lettings market. With letting agents’ fees scheduled to be banned (and potentially picked up by landlords or incorporated in higher rents), Airbnb’s change could make short-term lets an even more attractive option to landlords than long-term rental.
City of London, Westminster, Kensington and Chelsea and Hackney – the London boroughs where Airbnb homes* represent more than 3% of the boroughs private housing stock (IPPR 2016)

Up until 2015, planning permission was required for the change of use of residential premises (Use Class C3) to provide temporary sleeping accommodation under the Greater London Council (General Powers) Act 1973. The purpose was to protect London’s existing housing supply for the benefit of permanent residents.
Designed to encourage the sharing economy whilst retaining control over commercial lettings, the Deregulation Act 2015 enabled Londoners to participate in the sharing economy by allowing short-term lets for a maximum of 90-days per year without having to apply for planning permission for a change of use. If the cumulative number of days exceeds 90 planning permission would be required for change of use to serviced apartments, short term accommodation or hotel use (Use Class C1 or Sui Generis). This change in legislation, together with the tax breaks for letting spare rooms announced by George Osborne earlier this year, has made participation in London’s sharing economy more accessible than ever.

The number of properties let for more than 90-days per year is not insignificant: IPPR’s research identified that nearly a quarter of home* listings were booked for more than 90-days per year, amounting to over 4,900 homes. Without the sharing economy, some of these homes may otherwise have been occupied and/or let on a longer-term basis providing residential accommodation rather than visitor accommodation.
23% – The percentage of Airbnb’s London home* listings in 2015 deemed to be commercial under the Deregulation Act, amounting to 4,938 homes (IPPR 2016)

Airbnb’s 90-day rule reinforces legislation. It will no doubt make it more difficult for home-sharers to disregard planning rules, reducing the number of properties in London that are let on a short-term basis for more than 90-days and providing more homes for long-term rental.

Airbnb’s move draws into focus the challenges London Mayor Sadiq Khan faces en route to realising his vision set out in A City for All Londoners. In 2016, London attracted around nearly 20 million international overnight visitors a year, who contributed an estimated of $19.8 billion (£15.6 billion) to the economy[1]. Many of these visitors stayed in hotels, but a growing number now chooses to stay in accommodation provided by the sharing economy. Nearly 9 million people also call London ‘home’ and the population is projected to grow by almost 100,000 people annually over the next 25 years, according to ONS.

One of the affinities between Khan’s vision and Airbnb’s aims is the promotion of non-traditional areas to tourists. IPPR’s research finds that homesharing means that parts of London outside the centre benefit from tourists who might not ordinarily visit them. This trend was also noted in our analysis undertaken earlier this year which highlighted the higher proportion of Airbnb listings in locations that have fewer hotel rooms, such as the boroughs of Lambeth, Southwark and Wandsworth.

Similarly, A City for All Londoners aims to spread the economic benefits of tourism throughout London, and promote hotel development in Opportunity Areas and town centres in Outer London (assisting in meeting the target of at least 40,000 additional hotel rooms by 2036). The document also sets out that the London Plan will “promote hidden gems to international visitors” and “encourage participation in culture in all parts of the city”, not just central London.

If we are going to see a cooling down of London’s sharing economy, what does this mean for hotel developments? Will Airbnb’s new cap increase demand for hotel bed spaces at the expense of Airbnb’s? And what locations are likely to be most affected?

Notwithstanding the likely continued dominance of Inner London hotels, well-connected Outer London town centres are likely to provide strong opportunities to increase and diversify London’s hotel provision. Compared to central London hotels, such locations have the benefit of providing an arguably more ‘authentic’ experience of the capital while also providing easy access to Central London. Outer London hotels also (generally) have cheaper room rates, unlocking additional visitor spending in the local economy.

Whilst the competing demands on London as a place to live and a place to visit will need to be balanced in the new London Plan, local planning authorities should plan proactively for more hotels in Outer London to meet the demand for alternative accommodation evidenced by Airbnb.

Given that we work on a wide range of hotel, residential and mixed use projects in London and across the UK, changes to the sharing economy are of great interest to NLP. For more information on how we can help you please have a look at our Hotels page or get in touch.

Twitter: @mattpochin89

[1] MasterCard (2016) Global Destination Cities Index, September 2016.
*Entire home lets rather than space rooms

CONTINUE READING

Planning for inward investment in a world of uncertainty
A fundamental role of planning is to provide land of the right type in the right location to balance the need for new development with the interests of local communities and the wider public. The key challenge though is to recognise current and emerging growth opportunities and ensure that local plans are sufficiently flexible to be able to accommodate the full spectrum of opportunities, from small scale extensions and change of use through to identifying strategic sites capable of accommodating inward investment from external sources.

The recent chain of events triggered by the UK’s decision to leave the EU has placed a renewed focus on how localities position themselves for economic growth and ensuring that the various planning systems across the UK are ‘fit-for-purpose’ to secure future prosperity.

Inward investment represents just one source of growth and development, yet it remains one of the more challenging to quantify and plan for, given its ‘footloose’ nature. The extent to which local areas can actively plan for – and successfully capture – inward investment can also vary considerably across the country.

To explore how planning for inward investment works in local areas and how local partners can be more pro-active in securing these opportunities, NLP recently carried out a survey of local planning authorities (LPAs) and local enterprise partnerships (LEPs) across England. The key messages are presented in our new research report Invest to Grow and are summarised below:
  1. Growth begins at home: 88% of LPA and 100% of LEP respondents thought working with existing businesses and investors was a particularly effective way of supporting and encouraging inward investment in a local area, underlining the valuable role that domestic investors play in expanding their existing presence within the UK.
  2. ‘Oven-ready’ sites are crucial: The most significant barrier to attracting and securing inward investment comes from the various factors that hold up development, such as infrastructure costs required to make sites ‘oven ready’ for development - this was cited as a significant barrier by 83% of LPAs and 100% of LEPs. Planning can have a role to play in shaping the strategy and funding mechanisms required to help overcome these barriers and unlock development opportunities ready for investment.
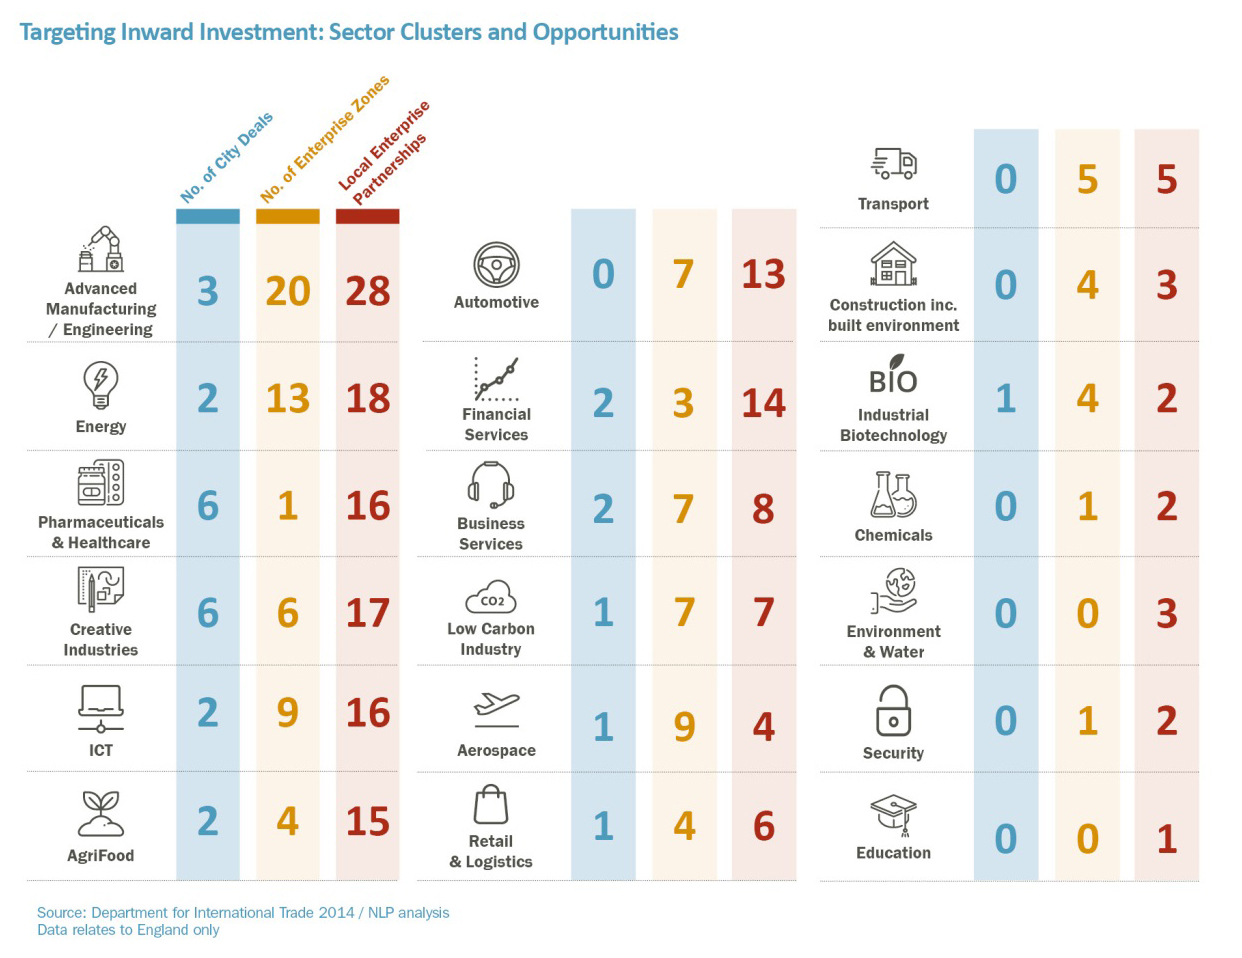
  3. Clarity on inward investment strategies: Global competition for inward investment can be fierce and within the UK a handful of sectors are repeatedly being targeted by local areas, for example through the designation of Enterprise Zones and through allocated City Deal funding (see Figure below). This makes it increasingly important for local areas to develop their strategies around their indigenous sector strengths, clusters and ‘USPs’.
  4. Work together: A 4.good level of awareness exists amongst LPAs and LEPs of the strategy for inward investment in their area and supporting local growth, but a third of LEPs and 60% of LPAs thought there was room for more collaboration between their respective organisations on planning for inward investment. This suggests there is significant scope for more effective, joined-up working between partners.
Drawing on best practice examples, we have identified a series of critical success factors that local partners could use to shape appropriate planning policy responses to inward investment opportunities in their area. This distils the opportunity into three broad typologies (described below) and provides a useful way of thinking about how the planning system can more pro-actively target and help capture inward investment within the overall ambit of planning for growth.

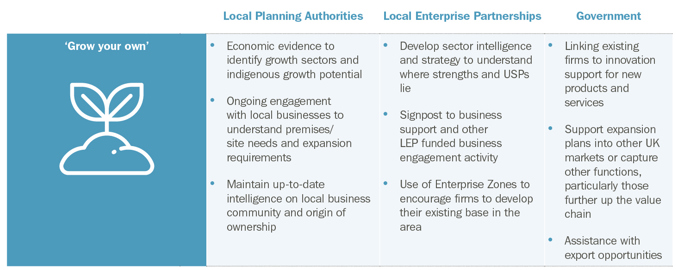
‘Grow your own’ – the first typology - refers to companies that already have a UK base and have scope to expand their operations either in the same location and/or elsewhere across the country. Responding to this opportunity is all about taking the time to understand and nurture an existing business base, ensuring they have the support they need to become more embedded within a local economy and being responsive to expansion and development plans to ensure that their growth can be accommodated.

   Source: NLP Analysis

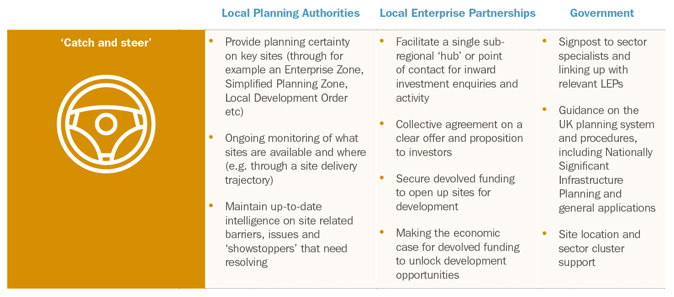
‘Catch and steer’ – the second typology - describes firms that have already decided to bring their investment to the UK or a particular region and are exploring their location, site and premises options. Planning has a role to play here in establishing a clear and competitive sector offer, by providing planning certainty that key sites are available and deliverable, and contributing to making the economic case for public funding to unlock development opportunities.

   Source: NLP Analysis

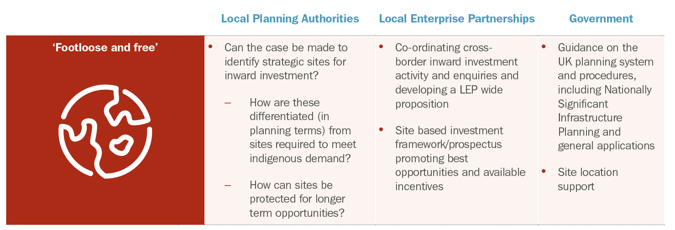
‘Footloose and free’ - the final typology - relates to firms that are not tied to any particular location or country but operate within a global marketplace. This arguably represents the most difficult opportunity to plan for, so maintaining a flexible and responsive planning system that anticipates (rather than accurately predicts) where opportunities might derive from is key, alongside promoting a positive message to the global marketplace that a local area is ‘open for business’. This will help an area to respond effectively if, or as and when the time comes.

   Source: NLP Analysis

Our research shows that planning for inward investment inevitably looks different in different places, but with the EU Referendum result already impacting on business decisions to invest and trade with the UK, it also indicates that the ability of local areas to make themselves attractive to inward investment - and the opportunities that this can bring - is now more important than ever.

Download a copy of Invest to Grow here.

CONTINUE READING