Planning matters

Our award winning blog gives a fresh perspective on the latest trends in planning and development.

More Afloat – New NPPF and the Sequential Test

More Afloat – New NPPF and the Sequential Test

Max Kidd-Rossiter 20 Dec 2024
My previous blog post spoke to the uncertainty that has arisen since the Mead/Redrow High Court Judgment was handed down in February 2024. The judgment held that the Planning Practice Guidance (‘PPG’) has the same legal status as the National Planning Policy Framework (‘NPPF’). This means that, as detailed in the PPG, the sequential test should take account of all sources of flood risk, including surface water flood risk, and not just fluvial flood risk.  It also means that, even if a site-specific flood risk assessment (‘FRA’) concludes that mitigation measures or existing flood defences result in a low risk of flooding, the sequential test would still need to be satisfied.
Following the judgment, it has been broadly accepted that planning applications should satisfy the sequential test if any part of the site is at risk of flooding from any source, unless one of the PPG exemptions apply[1].  This gave rise to the obvious solution to avoid the sequential test by amending red-line boundary to omit areas at risk from flooding.  However, the new NPPF contains a mechanism by which it will be possible to avoid application of the sequential test even if part of the site is at risk from flooding.
 
Changes to the NPPF
Paragraph 175 of the new NPPF includes an addition which establishes the situations when the sequential test is not required:
The sequential test should be used in areas known to be at risk now or in the future from any form of flooding, except in situations where a site-specific flood risk assessment demonstrates that no built development within the site boundary, including access or escape routes, land raising or other potentially vulnerable elements, would be located on an area that would be at risk of flooding from any source, now and in the future (having regard to potential changes in flood risk).
The sequential test can now be avoided at application stage on sites at risk from flooding if it is possible to locate the built development, access or escape routes, land raising, and other vulnerable elements away from any areas at risk from flooding from any source.  Whilst this might appear to be a modest change in policy, it is important.  It will enable the delivery of sites where only part of the area is at risk of flooding, without the challenges and risks associated with the application of the sequential test.
By requiring those part of a site that are at risk of flooding to remain free from built development or sensitive uses, the new approach will continue to minimise the risks associated with flooding. The Government’s response to the draft NPPF consultation reiterates, as established in the PPG[2], that a site-specific FRA cannot rely on mitigation measures that require active maintenance.  This is because their effectiveness in mitigating flood risk cannot be guaranteed in perpetuity.  Active mitigation measures therefore cannot be relied on to justify not satisfying the sequential test, if the elements listed in NPPF paragraph 175 are positioned on areas at risk from flooding. 
A further addition to this part of the NPPF is set out in paragraph 173.  This states that a sequential risk-based approach should also be taken to individual applications in areas known to be at risk now or in the future from any form of flooding.  The Government’s response to the draft NPPF consultation states this paragraph has been inserted to clarify the difference between applying the sequential test to plan-making and decision making.  This paragraph previously only related to the role of the sequential test at plan making stage and so the Government is now giving it a greater remit.
NPPF paragraph 180 states that where planning application come forward on allocated sites which were previously subject to the sequential test at plan preparation stage, it will not be necessary to reapply the sequential test.  It is not clear how this will play out for applications on allocations where the strategic flood risk assessment (‘SFRA’) that informed the plan did not consider all forms of flooding.  In the context of new NPPF paragraph 173, it is also not clear how to judge whether the SFRA has sufficiently considered future flood risk.  However, paragraph 180 does state that “the exception test may need to be reapplied if relevant aspects of the proposal had not been considered when the test was applied at the plan-making stage, or if more recent information about existing or potential flood risk should be taken into account.”   The list of considerations that might fall within this caveat may be extensive.
What if the built development, access or escape routes, land raising, or other potentially vulnerable elements of my scheme are located on areas of the site at risk from flooding?
If these elements cannot be positioned to avoid areas known to be at risk of flooding from any source, either now or in the future, the sequential test will need to be satisfied.  My previous blog provided some practical tips to navigate the sequential test, including how to tightly define the criteria for identifying “reasonably available sites”.  The Government’s response to the draft NPPF consultation confirms than a forthcoming update to the PPG is on the way in “early 2025” and that this will clarify the definition of “reasonably available sites” that should be considered as part of the sequential test. 
What next?
The new NPPF has confirmed that the sequential test is here to stay for sites at risk of flooding from surface water (and all other sources).  We are also now clear that site-specific FRAs cannot rely on active mitigation measures to avoid undertaking the sequential test, where one would otherwise be required.  Further updates to the PPG on this topic are expected in early 2025.  In addition to clarifying the definition of “reasonably available sites”, it would be helpful if the following points are also clarified by the update to the PPG:
  1. That failing the sequential test does not preclude granting planning permission; it’s only one consideration in the overall planning balance;
  2. Whether the sequential test needs to be satisfied again for planning applications on allocated sites, where the SFRA did not consider flood risk from all sources now and in the future;
  3. How the catchment for identifying reasonably available sites should be defined;
  4. How the scale and density of a proposed development should inform the identification of reasonably available sites; and,
  5. Whether (and how) one should identify and assess a series of smaller sites as part of the sequential test.
The Mead Case was heard by Court of Appeal in November 2024; one of the issues that was addressed through this case was the relationship between the NPPF and PPG.  The forthcoming judgment may have a bearing upon the scope and timing of the forthcoming update to the PPG. Whilst the new NPPF has moved things on in respect of the consideration of flood risk at development management stage, it is clear that things are still far from resolved.
Footnotes
[1] Reference ID: 7-027-20220825
[2] Reference ID: 7-024-20220825


Image credit: Chris Gallagher via Unsplash

CONTINUE READING

A(nother) new Standard Method: Back in Stock

A(nother) new Standard Method: Back in Stock

Bethan Haynes & Edward Clarke 12 Dec 2024
The new standard method for calculating local housing need is one of the central tenets of achieving the Governments objective to deliver 1.5m homes in the current Parliament. The new method is much more ambitious than its predecessor (targeting 372,000 homes per year up 21% from 305,000).
It was for this reason that the proposed changes prompted much commentary when published in July alongside the draft changes to the NPPF. At the national level, the changes to the standard method (in the published – December – version, compared with the draft – July – version) result in broadly the same figure – 370,400 rather than 371,500 per year.
Whilst the changes from the initial draft version might appear imperceptible nationally, they contain a broader shift in the geography of housing need.


Ch-ch-ch-ch-changes

The new method aims to boost housing numbers by pinning targets to existing housing stock (rather than household projections, as per the former method) and then uplifting needs, and the target, based on affordability (using a three-year average). It no longer includes a 35% uplift for urban areas and also does away with the ‘cap’. We commented in detail on the proposed changes back in July, here.
So, what has changed between these versions, and what impact could it have?
  1. Starting point – 0.8% of stock – no change between the proposed July and published December methods. Keeping stock as part of the equation provides the important long-term stability and more even starting point;
     
  2. Affordability uplift:
     
    1. Time period – the July method proposed use of three-year affordability average whereas December method proposes use of five-year average. On the whole, five-year affordability ratios are lower than three-year ratios (across England, down 3.4%), so in isolation this change would have a downward effect on numbers;
       
    2. Baseline – the July method proposed an uplift for anywhere where the affordability ratio is above four, whereas the December method proposes an uplift anywhere where the ratio is above five. In isolation, this would have a downward effect (since fewer areas would be subject to an uplift); and,
       
    3. Degree of uplift – the July method proposed that for every 1% the affordability ratio was above the baseline, a 6% uplift would apply. The December method increases this to 0.95%. In isolation, this would have an upward effect.
In short, the changes have the effect of decreasing (or indeed, removing altogether) the affordability uplift – and thus housing numbers – in the most affordable areas, and increasing the affordability uplift and numbers in less affordable areas. In practical terms, from the proposed July version this results in a shift of housing numbers away from the Midlands and North and more greatly concentrated in London and the wider South East, as shown in Figure 1 and Figure 2.
 

Figure 1 – Difference between July and December Method. Source: Lichfields
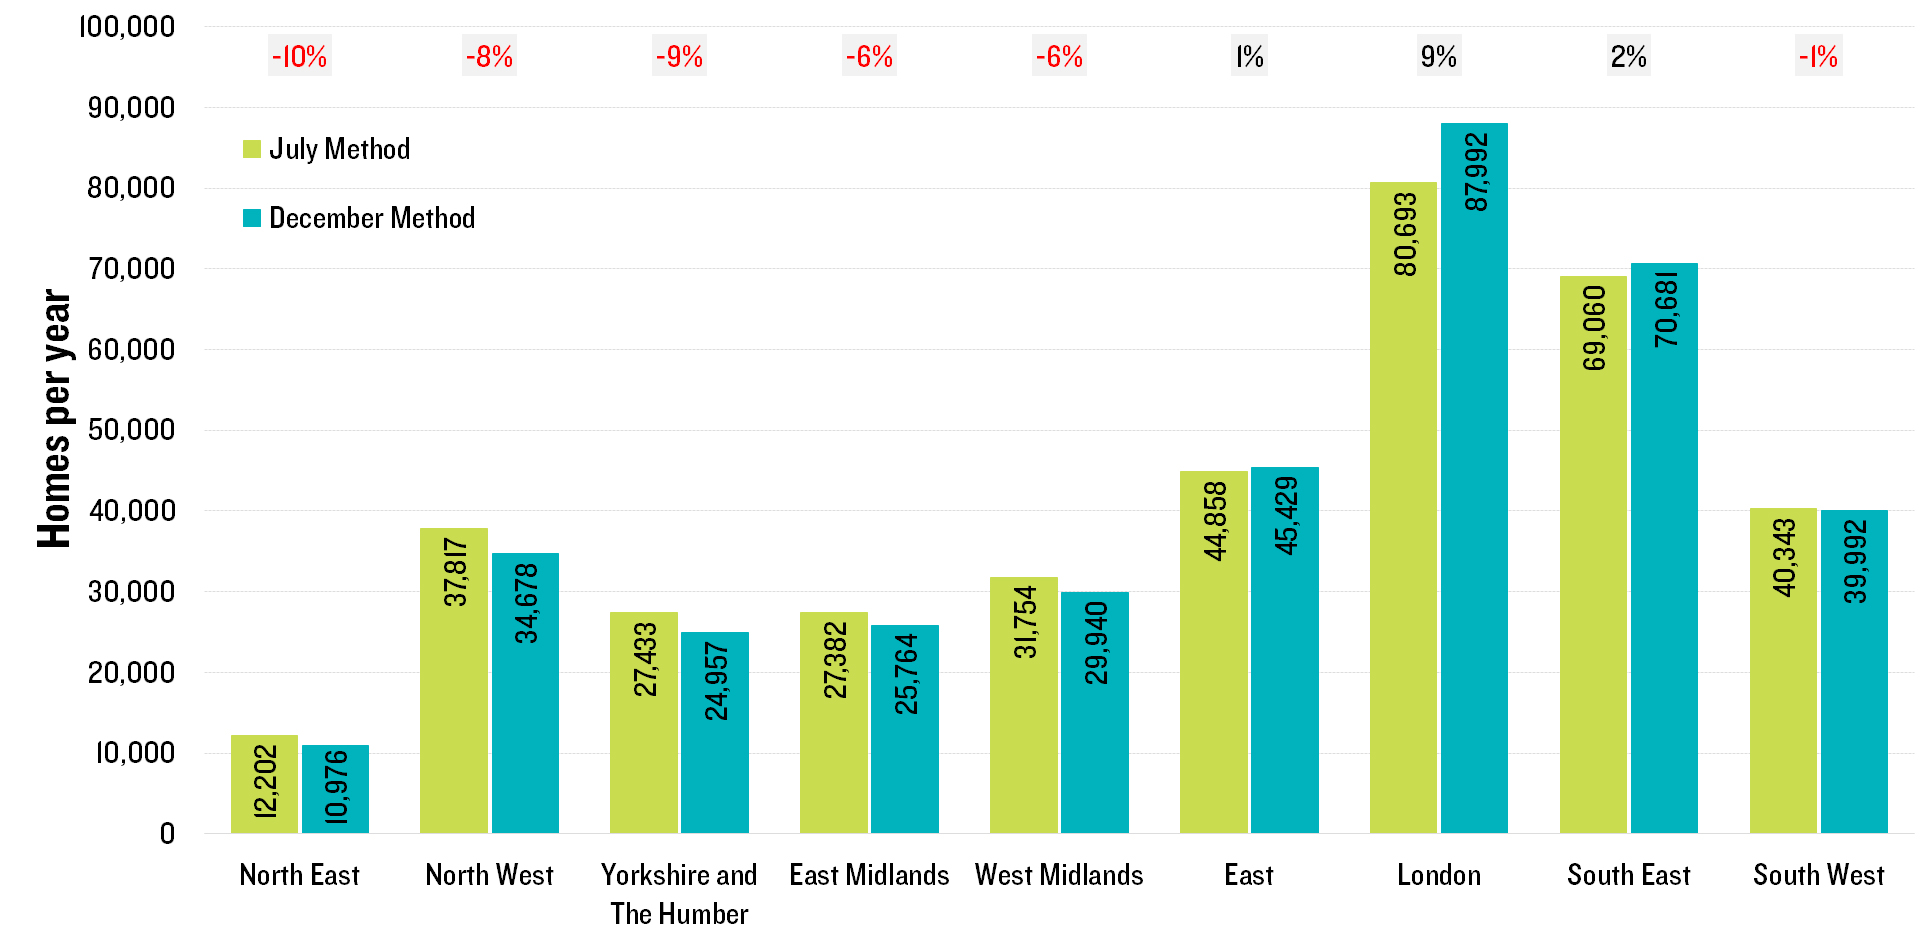
Figure 2 - Map of change between July and December by LPA

The only way is up (still)

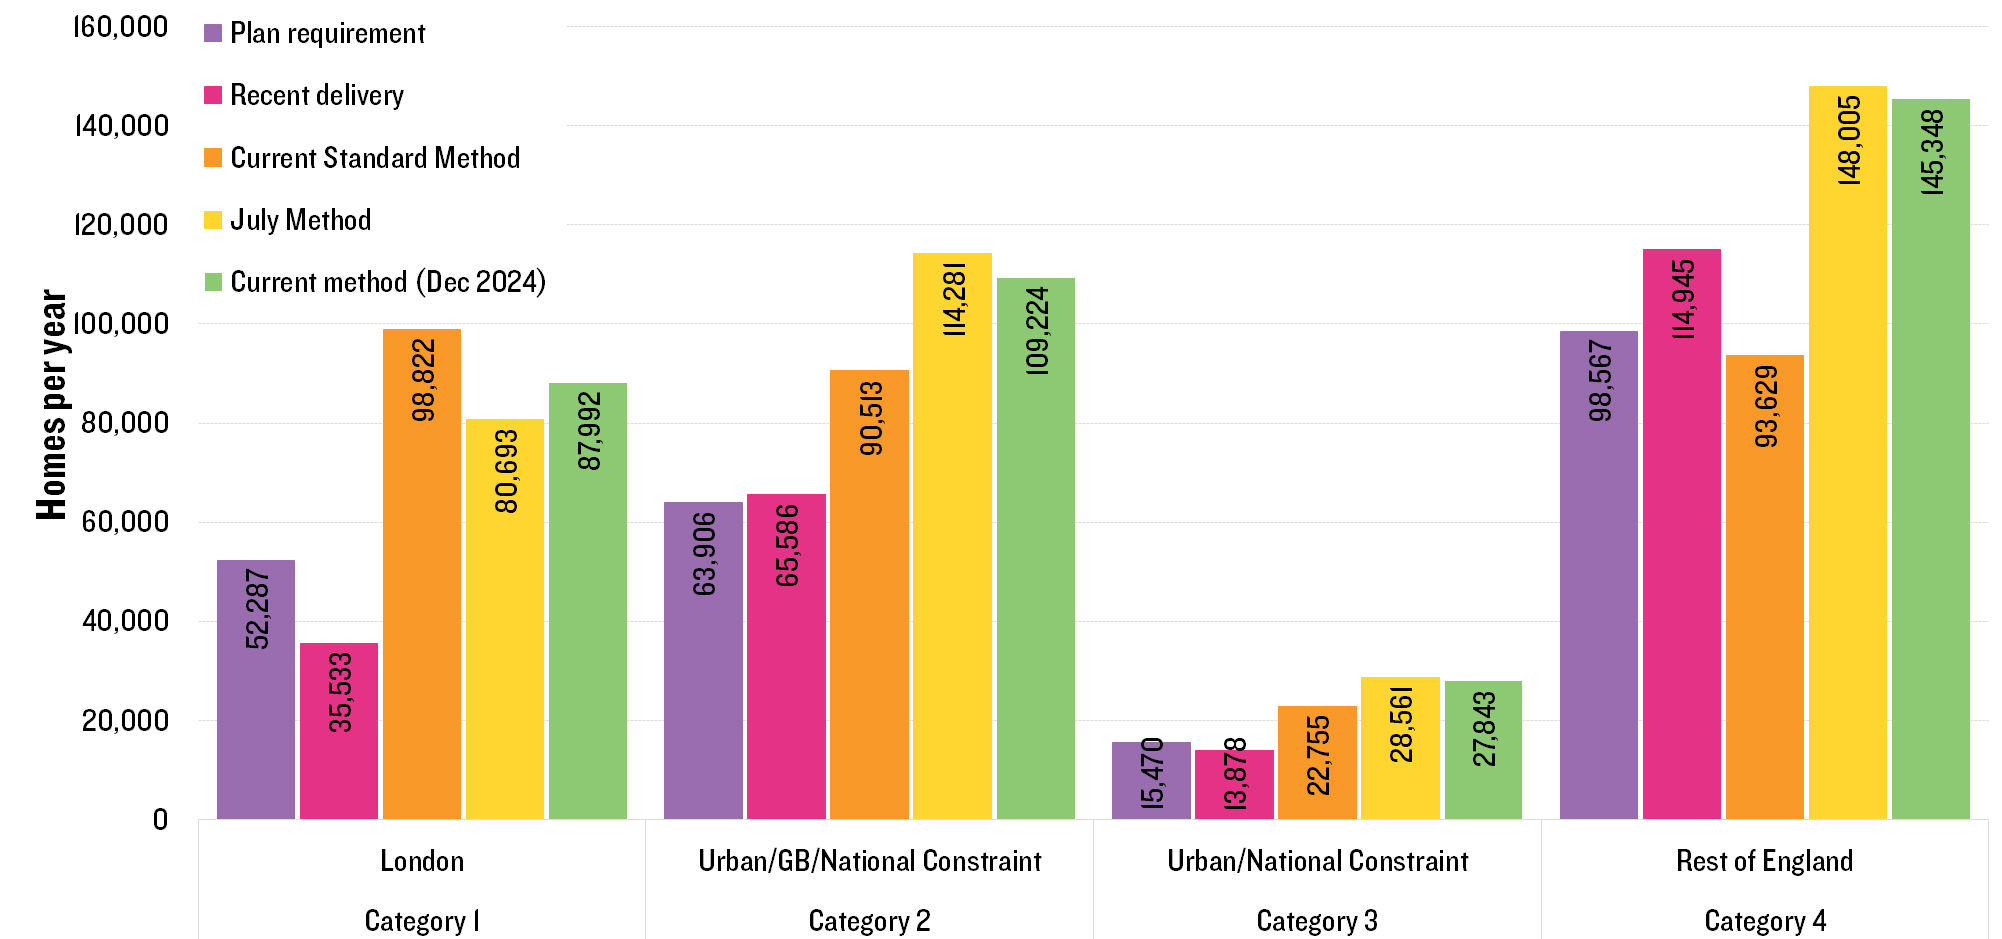
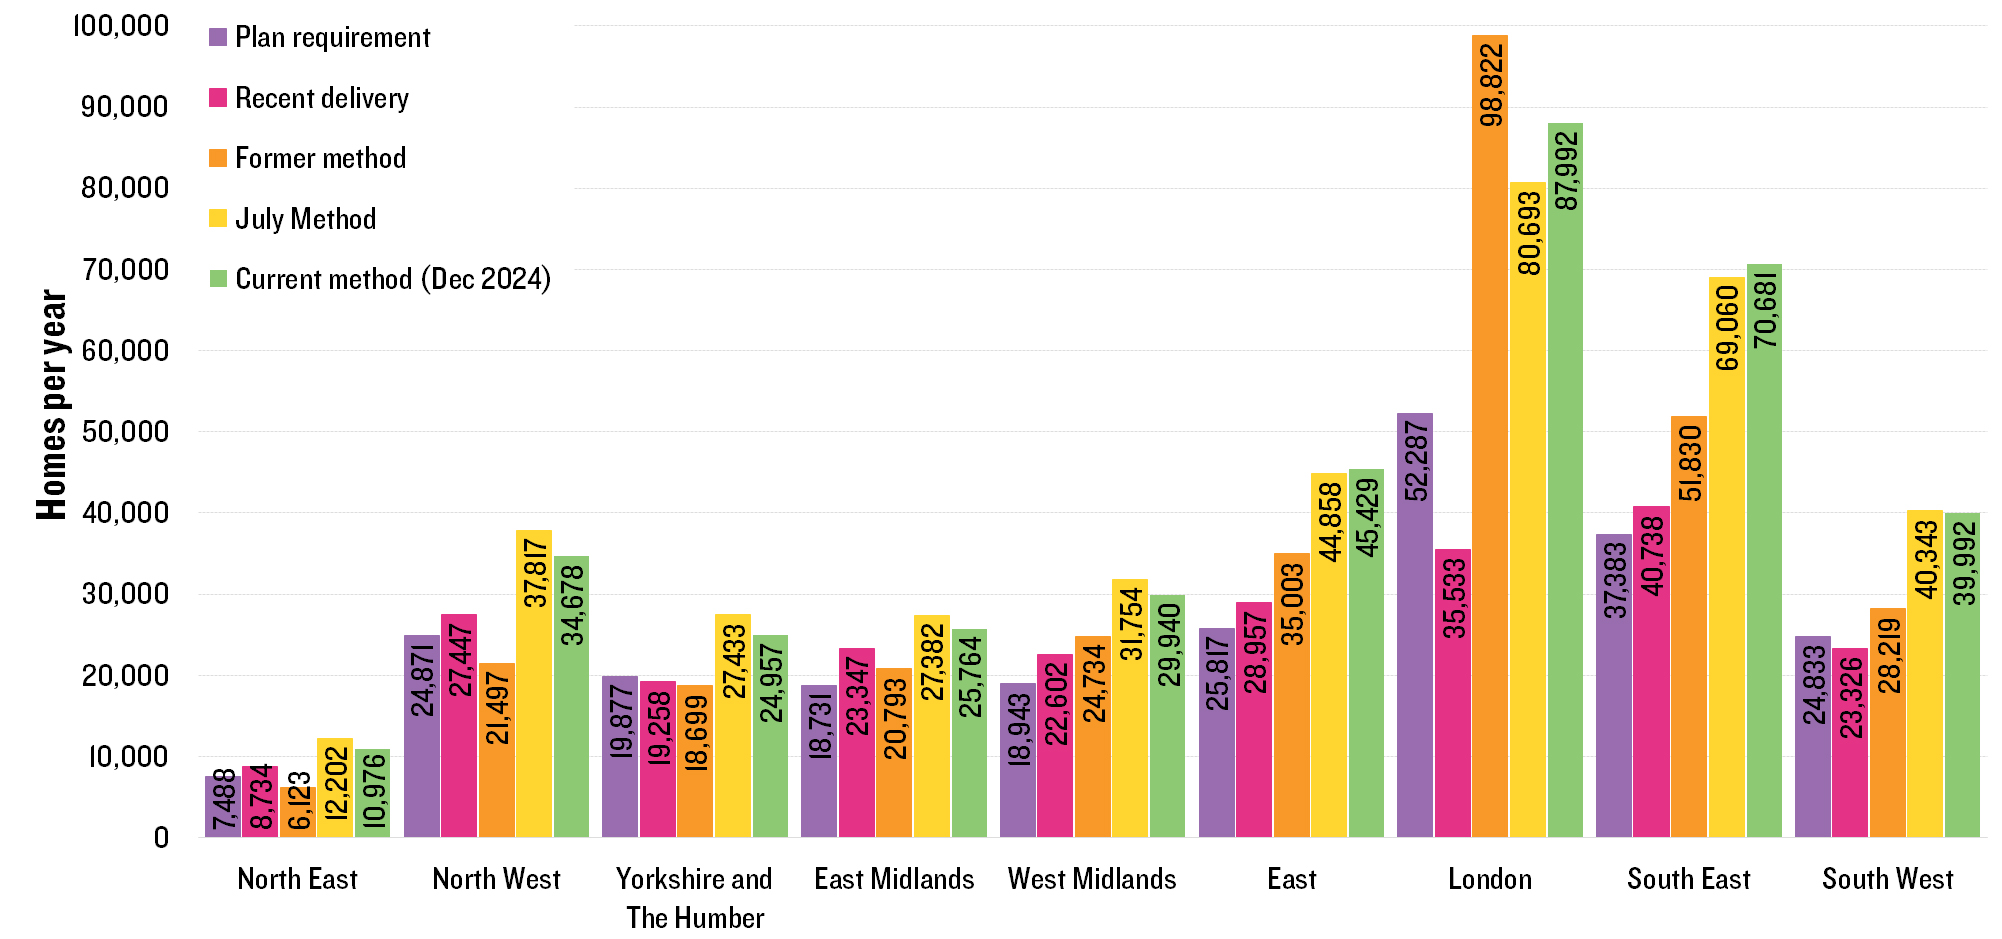
In July, our blog noted that the proposed method was higher than plan requirements, recent delivery and current plans across every region, putting upward pressure on all parts of the country to significantly increase housing delivery (figure 4). Despite the slight shift in housing numbers in the new Standard Method (away from the Midlands/North and towards London/South East), it remains the case that all regions will see housing pressure (above levels of current plans, recent delivery and the current method bar London which is 11% below the previous standard method) as shown in Figure 3. Overall, the new Standard Method is around 60% above plan requirements (ranging from +25% in Yorkshire to 89% in the South East) and 60% above recent delivery (ranging from +10% in the East Midlands to +148% in London).
 
Figure 3 – Plan requirement, recent delivery, current method, July method and December method by Region.

Source: Lichfields based on local plans, MHCLG Live Table 100, ONS.

When looking at housing distribution by type of area[1] (full details of which are described in our July blog), the uplift in London has been largely balanced by slight decreases elsewhere; on the whole areas which are urban/significantly green belt/other national constraint (e.g. National Park, etc) now have a housing need of just under 109,000, down around 5,000 per year from just over 114,000 in the July Method, as shown in Figure 4.
However this is not equal across the country, with constrained parts of the wider South East seeing increases (with many parts of Essex, Hertfordshire, Surrey and Hampshire seeing increases of between 5% and 10% since July), whilst constrained areas in the rest of the country see decreases.
Looking at London specifically, we previously noted that London has been delivering below the London Plan target, and that although some potential NPPF changes to policy on Green Belt review might drive higher targets and delivery, it remains unknown whether London can or will meet needs in full. Reaching even the current London Plan targets (of 53.2K) by end of the current London Plan target period would be an achievement, and delivery would need to more than double to reach the now published standard method figure of nearly 88,000.
 
Figure 4 – Plan requirement, recent delivery, current method, July method and December method by Constraint. 

Source: Lichfields based on local plans, MHCLG Live Table 100, ONS


Will this achieve Government ambitions for 1.5m?

In July, we noted that, one could see how the [at the time, draft] Standard Method, in combination with proposed NPPF revisions (particularly on duty to cooperate and Green Belt review) had the potential to unlock planning constraints to housebuilding in many locations that have so far capped local plan targets, and to stretch delivery in less constrained areas where current targets are largely already met. The final published method has slightly shifted needs further into London, but there remains upward pressure (when compared with current plans, recent delivery and the current method) across all the regions (bar London which is 11% below the previous standard method).
The importance of setting ambitious housing targets is fundamental to supporting housing delivery; delivery being reliant on land released by the planning system, which is shaped by the targets that are set via a housing need methodology and the national policies of the NPPF that direct how much need is actively planned for in local plans. The Competition and Markets Authority (CMA) found that: “The planning system is exerting a significant downward pressure on the overall number of planning permissions being granted. Over the long-term, the number of permissions being given has been insufficient to support housebuilding at the level required to meet government targets and measures of assessed need.”
In December 2020, we said about the then current Standard Method was a method that “with a fair wind, [is] a recipe for maintaining (just) current national rates of housing delivery [of around 230K], but seem unlikely to get England over the 300K hurdle.” In February 2023, we said that the then proposed changes to the NPPF could lead to a fall to 156K. The draft method published in July 2024 (along with the proposed changes to the NPPF) represented a significant shift in direction, setting targets well above any levels seen in plan-making historically. But, we noted, plan-making takes time, and the hiatus in plan-making in combination with the recent housing market downturn looks set to see rates of house building at 170-190K this coming year (a fact the Secretary of State highlighted in her Parliamentary statement) and recovery will be gradual. We concluded that the method (published in July) alongside the NPPF is readily consistent with achieving an annual run rate of the 300,000 – something which appears to likely still be the case under the now finalised version of the NPPF.
Despite this positivity, we conclude that we remain unlikely to reach the 1.5m ambition. Even setting aside the practical and market challenges, until Local Plans are in place housing supply in most areas will be monitored against a target (the SM) that is refreshed each year, with any shortfall from that year wiped clean. This means that the under-delivery against 300K in initial years will not be added to the annual requirement for future years, and planning decisions focused on future delivery will be made based on what is needed to achieve the annual target for five years from that rolling date, not the beginning of the Parliament. Although a worsening affordability due to prior under-delivery in early years might nudge the standard method figure up slightly, it is unlikely to be sufficient to 'make good' the annual shortfall of 100-150K that will accumulate in the short term leading to planning for a lower overall number Additionally, even with local plans in place, the time taken for planning applications to worth through the planning system and then build out will mean a lag time to delivery.
We therefore conclude on a similar footing to in July, increasing ‘mandatory targets’ will be a vital lever to plan for and deliver more homes. It is possible that taken together with the other measures the Government have implemented, including the new NPPF, to a delivery rate of 300,000 by the end of the Parliament is achievable. This would be a significant uplift from recent rates, especially the low point of this year, and an achievement with which the Government could be justifiably pleased.


Footnotes

[1] Category 1: London (the area covered by the Mayor’s London Plan).

Category 2: LPAs where their administrative area is mostly built-up and/or constrained with a significant amount of Green Belt. This is in the context that the NPPF proposes to make brownfield development within settlements acceptable in principle and – most significantly - to compel reviews of the Green Belt and for ‘Grey Belt’ to be capable of development in situations where there is no five year land supply or the Housing Delivery Test (HDT) result is below 75%.

Category 3: LPAs where the administrative area is mostly built up and/or constrained by other national constraints (e.g. national landscapes) for which there is no fundamental change of policy.

Category 4: LPAs in the rest of England – i.e. areas which are unlikely to have fundamental other national policy constraints.

CONTINUE READING

The Pilot UK Net Zero Carbon Building Standard – Key priorities for success
The Pilot UK Net Zero Carbon Building Standard (‘the Standard’), launched in September 2024, aims to provide clarity, and a unified methodology, for establishing what constitutes a net zero building in the UK. Having worked on schemes aspiring to be ‘net zero’ at Lichfields, it is clear that the Standard has the potential to be revolutionary for the industry. This blog provides an overview of the Standard and explores the key actions required to ensure it is successfully implemented.
So what is the Standard?
The Standard is free to access and provides a set of consistent rules for defining what net zero carbon means for buildings in the UK. It applies to both existing and new buildings, covering 13 different sectors (including residential, offices and data centres), but does not apply to infrastructure. By providing clarity on when a building can claim to be net zero, it enables developers to demonstrate that their built assets align with the UK’s carbon and energy budgets without the need for negotiation. Consequently, it has the potential to reduce the time spent deliberating the topic during planning discussions, aligning with the government’s aspirations to streamline the planning system.
The Standard was established through a collaborative effort from the industry with the key organisations involved comprising BBP, BRE, the Carbon Trust, CIBSE, IStructE, LETI, RIBA, RICS and UKGBC. Additionally, over 1,000 organisations were consulted and 4,000 buildings provided data to inform the Standard[i].
While the Standard is ready for use, it has been issued in ‘pilot’ to provide the industry with time to understand what it means and evaluate it on existing buildings and new projects. A period of testing will commence in 2025 to inform its final version, which includes verification and communication of analysis[ii].
The Standard is clearly a positive move to support decarbonisation of the industry. However, several actions are required to ensure it is successfully implemented. In the remainder of this blog, I share some thoughts on three key actions to focus on.
   
Upskilling
Firstly, upskilling of the industry’s workforce is required. Upskilling is necessary in all disciplines and at all stages in a building’s development, from the engineers and architects designing buildings, to supply chain contractors sourcing the building materials. Training will be necessary to understand the components of the Standard and the overall process. Additionally, a robust understanding of the difference between upfront and operational carbon is crucial for everyone involved. This is already important for planners working in London, where the London Plan requires major developments to be net zero or pay a carbon offset contribution. While the initial upfront investment in training could prove challenging, the Standard has the potential to simplify net zero discussions, particularly during the planning process, which will provide time and cost savings. A holistic understanding of the Standard, beyond an individual’s discipline, will be beneficial.
Collaboration and Sharing of Data
Secondly, success is reliant on collaboration from project inception. This will ensure that all necessary matters are being discussed, and that there is a true understanding of what will be required to achieve net zero from the outset of a project. Simultaneously, the collecting and sharing of data is key. While it may be difficult to directly compare projects, providing data at the earliest opportunity will help to inform later versions of the Standard. In particular, the collecting of data during occupation to understand how a building is performing is crucial. Sharing data will also allow the industry to learn and develop from others’ experiences. However, this does mean reporting project failures as well as successes. This may be difficult at first but is something that the industry will need to get comfortable with if true progress is to be made.
In terms of the planning process, the Standard may mean that different information supports planning applications, and so both the project team and determining LPAs will need to become familiar with this. However, a robust standard will give certainty on exactly what needs be provided, particularly if this is endorsed through policy later down the line. It could, therefore, simplify sustainability information provided at the planning stage of a project. 
Shift in how the Industry Perceives Net Zero
Finally, there needs to be an overall shift in how the industry perceives net zero. Given that the Standard emerged from a collaborative effort within the industry, it is clear this shift has already begun. Interestingly, RICS Sustainability Report (November 2024)[iii] highlighted an increasing demand for green buildings by tenants. Evidently, there are commercial benefits to prioritising sustainability, and it is important to end users. We must ensure that sustainability is a key focus early on in the design process, and that outdated conceptions of it being costly and incongruous with high quality design are changed.
Summary
It is clear that the Standard will be significant in supporting the UK’s net zero transition. To realise its full potential, the industry must upskill. Collaboration, including the sharing of data, is also essential, and there needs to be an overall shift in how environmental and sustainability matters are perceived. Other sustainability standards, such as BREAAM and Passivhaus, have become a requirement in local planning policy; and in London, all major developments must provide Whole Life Carbon and Circular Economy Statements. Endorsement through policy would clearly be beneficial. For now, the Standard is a positive and exciting development within the industry which has the potential to be revolutionary by providing consistency and streamlining sustainability standards for buildings.
Lichfields will be keeping a close eye on how the Standard progresses over the coming months. If you have any queries, please do get in touch.


Image credit: Jakub Żerdzicki on Unsplash


CONTINUE READING

Does the tilted balance need a design makeover?
The insertion of reference to the quality of scheme design into Paragraph 11d of the July draft NPPF was seen by some as wariness from Government that the increase in planning applications needed to boost the supply of housing might somehow result in a diminution of scheme quality. But surely the existing NPPF provision on design already prevents that?; especially since the strengthening of the need for design quality in the 2021 iteration of the Framework, which has been maintained thereafter.
The current paragraph 139 states “Development that is not well designed should be refused.” This is the NPPF’s categoric policy message on design and a clear steer from the previous government that despite the urgency of the housing crisis, national policy would not permit it to be solved with poor design. This requirement to deliver well designed schemes was strengthened in the NPPF in the July 2021 iteration (paragraph 134) and is maintained in the September and December 2023 updates at paragraph 139. To support well designed schemes, there is a raft of guidance/tools on good design which ultimately feed into applications including Building for a Healthy Life 12, the National Design Guide and National Model Design Code.
To analyse whether the NPPF’s current provisions on design quality has impacted on how design is addressed in submitted planning applications, or if schemes are now routinely being refused for not delivering well-designed places, Lichfields has reviewed a sample of 270 planning appeal decisions for 50 or more homes since the adoption of the July 2021 NPPF[1].
Initial key findings
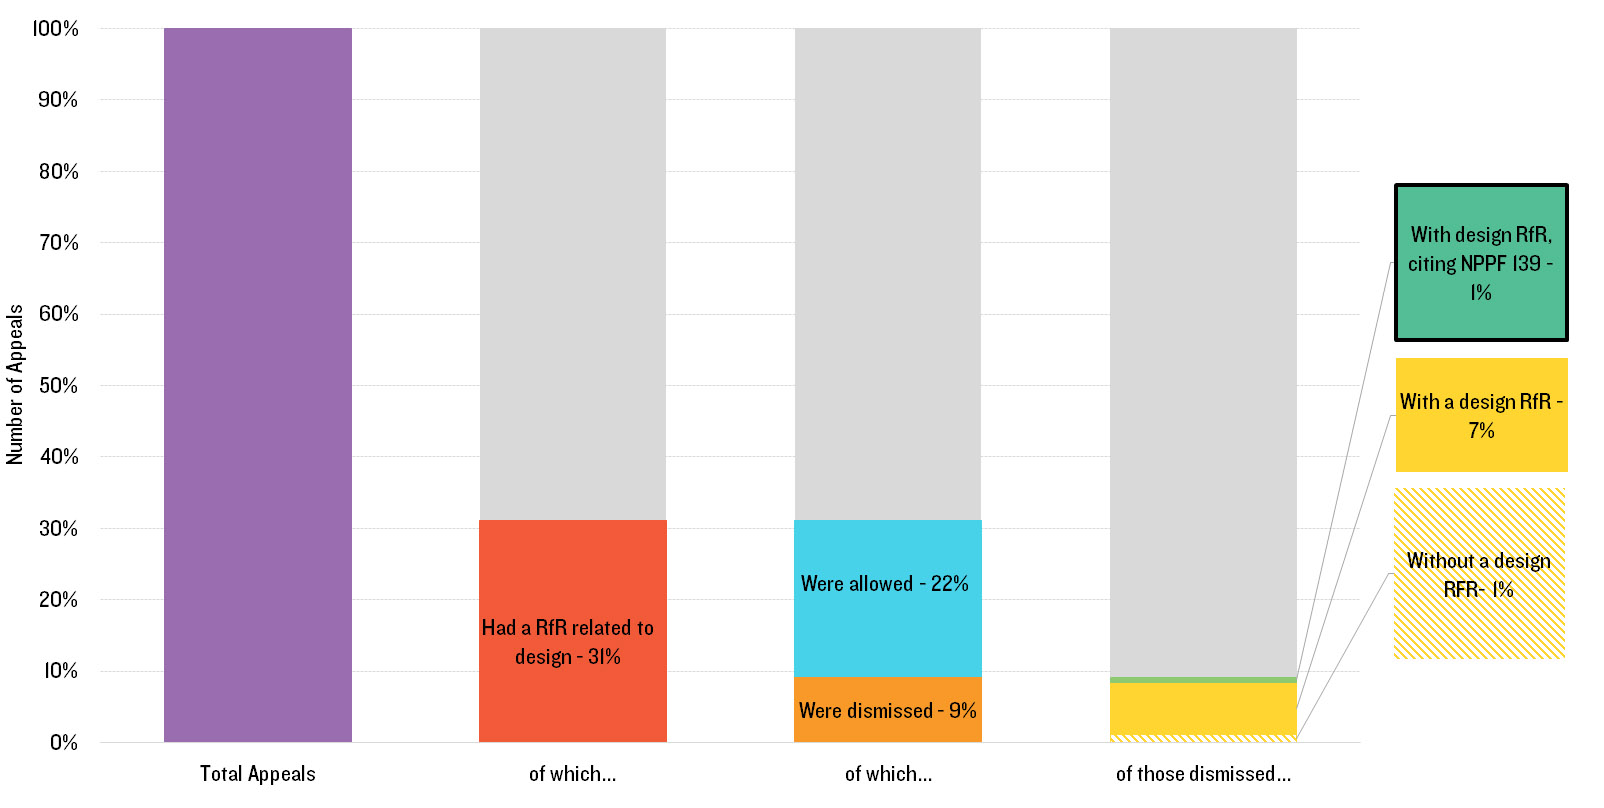
Of the sample of 270 appeals reviewed, we found only 30% where design was conceivably one of the main issues for the appeal inspector and in some instances the Secretary of State, (SoS) to grapple with. This implies design even in its broadest sense is not one of the most prevalent reasons for schemes going to appeal, most certainly not since July 2021. We explain below that in fact most of the references to ‘design’ relate to the potential impact of schemes on the character and appearance of the area, i.e. landscape and townscape impacts rather than the design of spaces and buildings.
But even on this broad definition, of these appeals, 70% were allowed, two by the SoS. This means any design issues perceived as problematic locally were not agreed by the appeal inspector or SoS when they examined the evidence.
It is also of note that of those appeals which were allowed, just under half were refused against officer recommendation at the local level, and on average a further ten months was added to their determination. This means that using their professional planning judgement, design was not something the case officer thought was a reasonable basis on which to refuse the scheme (despite the clear NPPF policy hook to do so if justified). Arguably, these schemes should not have ended up at appeal at all, incurring significant costs to all parties, not least the local planning authority. Adding almost a year’s delay to the determination of these applications will have been frustrating where applicants had invested time in a pre-application design review process – as some of these schemes were. Conversely, for the those appeals dismissed where the Inspector agreed with the local concern about design (in its broad sense), 60% were refused by case officers.
Of the smaller number of schemes dismissed on design grounds[2], only one in five were applications made by the biggest five-volume housebuilders[3]. 80% of applicants were smaller housebuilders, land promoters or other bodies/individuals. The low number of appeals dismissed where volume housebuilders were the appellant is perhaps an indication of effective early engagement, use of design tools, etc.
Furthermore, of all the schemes where design was debated as a main issue at appeal, just over a third were allocated, or an emerging allocation, in a local plan. Of these sites, more than three quarters went on to be allowed.
Finally, we have also considered the prevalence of design codes and whether these were determinative in appeal decisions. Ultimately, we found that of all appeals where design was a main issue for debate, less than 10% of the local planning authorities (LPAs) had an adopted design code in place.
BUT, what is design?
In undertaking this analysis, clearly design is not an issue which is easily categorised. In many of the appeal decisions reviewed, commentary and analysis about scheme design (layout, heights, building design etc.) is in fact conflated with narrative about impact on the character and appearance of the area, impact on the character and appearance of the countryside, and finally in some instances into impact on landscape character. Ultimately, the precise reason for refusal is not always clear, and it may be that development of an open field is too harmful to the character and appearance of an area, regardless of the actual design of the scheme put forward. Indeed, in the case of outline applications, there is not usually a significant amount of design material to make judgements against, given this is reserved. This was borne out in a number of appeal decisions whereby inspectors found proposals were acceptable with regard to detailed design, subject to control by future reserved matters and condition submissions.
Appeals dismissed clearly on the grounds of poor design of the development proposed (e.g. the design quality of spaces and buildings) were few and far between, with the vast majority primarily relating to character and appearance of an area/the countryside/the wider landscape. If the proposed development truly was not well designed, you would expect the appeal inspector to have cited the NPPF para 139 (or previous 134) or the beauty and quality expected by the Framework for design. However, only three of the dismissed appeals make this reference. Much more common is reference to local plan policies, with some conflation of topics as set out above.
This means that the NPPF’s very clear policy requiring poorly designed schemes to be refused – triggered a dismissal in just 1% of all appeals in this sample.
What does this mean?
Ultimately, this initial analysis shows that schemes which are “not well designed” are not a prevalent feature of planning appeals coming forward for major housing schemes. But even where they are, the NPPF provides the policy hooks necessary to dismiss them on appeal. There is no evidence to suggest the NPPF as a whole is routinely permitting poorly designed schemes. In that context, there would not appear to be any case for changing how design matters are addressed via national policy as was consulted upon back in July 2024, and risk adding a layer of confusion to the application of NPPF Paragraph 11d. Indeed, the application of the tilted balance owing to unmet housing need does not outweigh harm associated with poor design in the current NPPF, which perhaps demonstrates that the policy is working. An environment with a greater prevalence of 5YHLS deficits will not change this.
The research also specifically shows that only a very small number of appeals are refused on the grounds of poor design. This infers that applications on sites that are submitted ahead of a local plan (i.e. not allocated) are no less well designed than applications on sites allocated in a local plan. Furthermore, it does not appear that large volume house builders are typically submitting poorly-designed schemes.
What is of interest, and is of relevance to the debate about reforming planning committees covered in the weekends press and in The Planning Reform Working Paper published today, is the clear relationship with the application of design as a reason for refusal in applications which go against the recommendation of case officers. This aligns with Lichfields previous research Refused for Good Reason, which found that in 24% of appeals impact on character of areas and in 22% of appeals height/scale of development were added as reasons for refusal to applications refused against planning officer recommendation.
Footnotes
[1] c.50% of these appeals determined in this period
[2] Of those appeals where design was a main issue, two appeals were dismissed for reasons other than design, i.e. design did not form a reason for refusal by an appeal inspector.

[3] BarrattRedrow, Taylor Wimpey, Bellway, Vistry and Persimmon


Header image credit: Antony Hyson Seltran on Unsplash

CONTINUE READING