Britain’s population is ageing and the implications are wide-ranging. Using population projections to 2036, this blog looks at how this major demographic shift will affect cities and rural areas both in relative (i.e. increasing share of people who are over 65) and absolute terms (i.e. increasing number of older people).
The analysis presented below follows up to
my previous blog and the publication of a
report on age segregation in England and Wales by the Intergenerational Foundation. The methodology is at the end of the blog.
Two trends clearly emerge when analysing dependency ratio at the rural/urban, coastal/non-coastal level. First, in 2036 coastal locations in Britain consistently show higher dependency ratios compared to non-coastal areas. Second, there is an almost linear relationship between an area’s degree of urbanisation and its dependency ratio. Both trends are easily spotted in Figure 1 below.
Figure 1 – Dependency ratio by local authorities’ degree of urbanisation, unweighted average
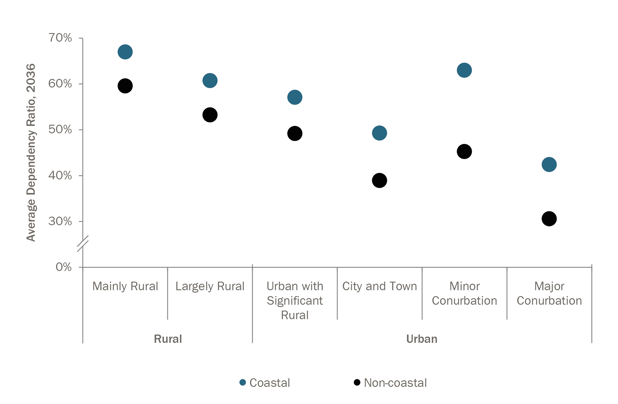
Source: ONS, NRS, Statistics for Wales, NLP analysis
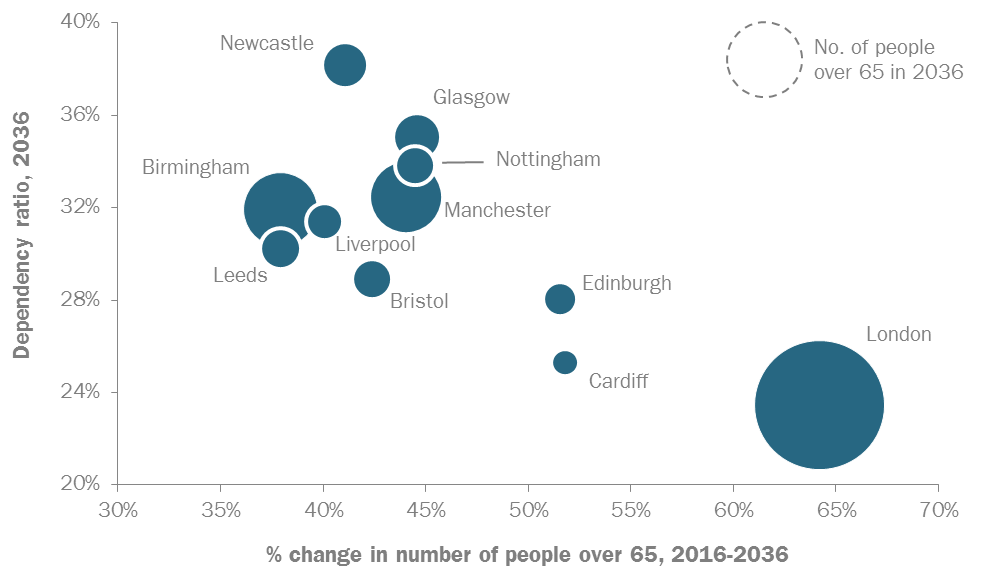
This rural-urban trend is even more evident in Figure 2 below, which shows how all local authorities in Britain will score in terms of their dependency ratio in 2036 and the proportional increase in number of people over 65 in 2036, compared to 2016 levels. Broadly, a higher degree of urbanisation corresponds to lower dependency ratios, despite higher proportional increases in people over 65 by 2036.
Figure 2 – Dependency ratios and increase in older people in Britain’s local authorities, by rural-urban classification
In short, what is expected to be a national demographic shift will have diverse implications at the local level. Crucially, public finances in rural authorities may have more difficulties in providing adequate adult social care in the future, given that in some areas there will be an average of 7 older people for every 10 people of working age. Also, all other things being equal, coastal areas’ finances could be under greater pressure than their non-coastal counterparts.
In theory, adult social care costs should not be as pressing for urban areas. Given their relatively lower dependency ratios (a good proxy for economic activity) and the ability to increase Council Tax by up to 2% each year and to retain business rates from 2020 (see page 4,
here), urban areas’ finances could be better placed to meet the increasing pressures of adult social care expenditure – if not comfortably, potentially more so than rural authorities would.
However,
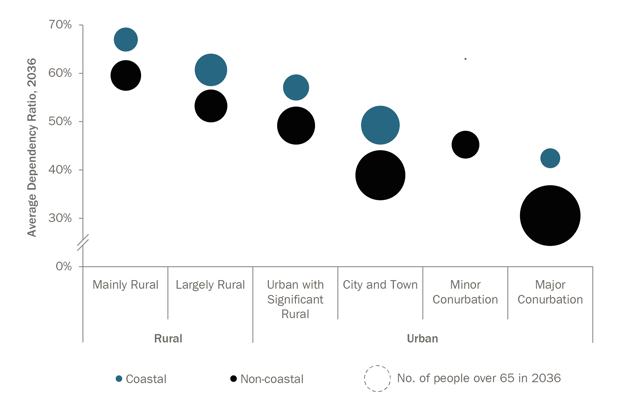
cities will likewise face the pressure of planning to house an ageing population. Both in relative terms (see Figure 2 above) and absolute terms (see size of bubbles in Figure 3 below), urban areas will experience the strongest growth in the number of people over 65.
Figure 3 – Average dependency ratio by local authorities’ degree of urbanisation and number of people aged over 65 (expressed via area size of the bubbles)
 Source: ONS, NRS, Statistics for Wales, NLP analysis
Failure to meet the housing needs of this older cohort could lead to future increases in adult social care costs for urban local authorities, which have already been hit by budget cuts since 2009/10 and have almost unanimously increased Council Tax by 2%, once given the opportunity to do so, to meet the rising costs of adult care (again, see page 4
here).
Ageing cities
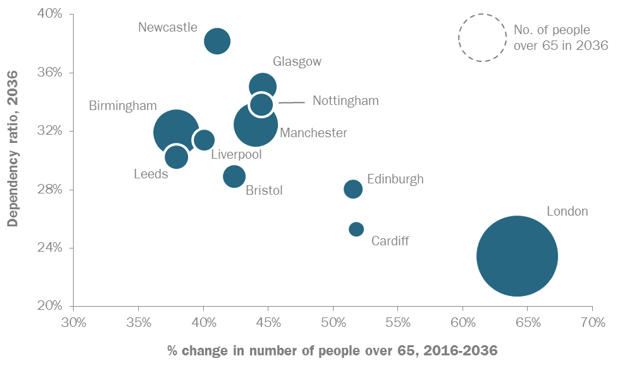
As Britain grows older its cities age too. Dependency ratios will increase in all of the largest urban areas in Britain between 2016 and 2036. Despite this and the substantial absolute increase in the number of older people (from +38% in Birmingham and Leeds to +64% in London, see Figure 4), the influx of younger, working people would keep the increasing dependency ratios relatively low (between 23% in London and 40% in Newcastle) even by 2036.
Figure 4 – Dependency ratios and increase in older people in selected urban areas
 Source: ONS, NRS, Statistics for Wales, NLP analysis
One of the main challenges of this increase will be meeting older people’s specialist housing needs, especially at a time when housing costs are rising for all age cohorts and all tenures (albeit at different rates in the
North, the
Midlands and the
South of England).
Almost 4.3 million people over 65 will live in Britain’s largest cities by 2036 (up from around 2.9 million today). National and local governments must ensure that the housing stock will be large enough (and of ‘good enough’ quality) to accommodate them all, as the cost of not meeting these needs would be borne by local authorities via adult social care expenditure.
In sum,
the same demographic shift is expected to impact differently on cities than it will on rural areas (and on coastal locations compared to non-coastal ones). Urban areas are likely to see pressure on their housing market increase, while rural areas will need to find solutions to cover rising adult social care costs, as older people will make up an increasing share of the local population.
This challenge highlights the difficulty of devising a national housing policy, since any intervention by the government will have implications for local governments’ finances and for the housing market. Building more homes may not be the single solution to solve Britain’s ageing-related issues, but it does seem a very sensible starting point.
Methodology
The analysis is based on dependency ratios, a measure of social support need expressed as a ratio of the number of people aged over 65 to that of people between 16 and 64. (A value of 0% means that there are no people over 65 in an area, while a value of 100% means that there are as many people over 65 as there are between 16 and 64.) These are calculated using ONS, NRS and Statistics for Wales’ population projections for 2036, the furthest year common to all datasets.
I also distinguish between coastal and non-coastal areas. Coastal areas are all those UK local authorities whose territory meets the sea, for whatever length or proportion of the total. I identified 109 coastal local authorities. The remaining 271 areas are non-coastal areas.
Each local authority is assigned a Rural-Urban Classification score, calculated by the ONS for England and Wales. Using the same approach, it is possible to estimate a score for Scottish local authorities.
Urban areas data are based on
Primary Urban Areas.
To gain a fuller picture of the implications of an ageing population in Great Britain, you can also read our
Research Note.