On 29 September 2016 Welsh Government published its 2014-based local authority population projections. This data will inform the next set of official household projections, which will be used by local authorities in setting future housing requirements as part of Local Development Plan preparation
[1].
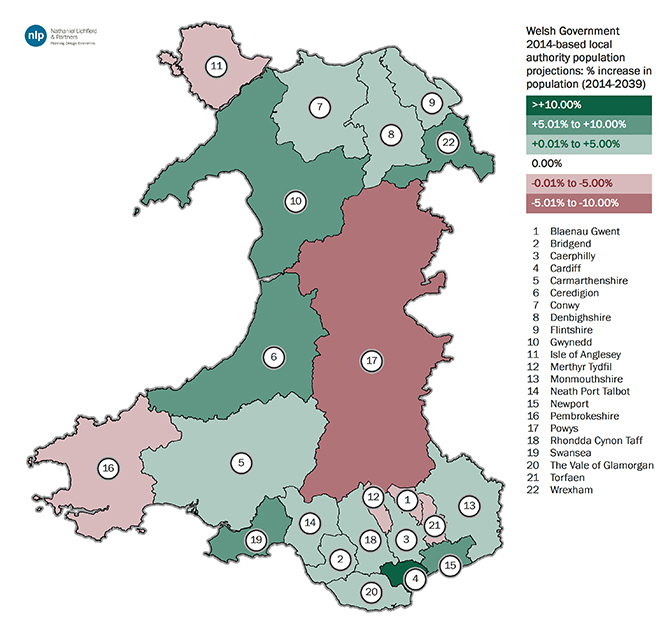
The 2014-based projections indicate that the population of Wales is likely to increase by 167,500 people from 2014 to 2039, with over half of this growth (54%) to be based in Cardiff and 70% in South East Wales. This trend illustrates the significant pressure on Cardiff’s housing market, which will need to be addressed either within the city or in neighbouring areas.
Table 1: Top 5 population growth areas in Wales

Source: Welsh Government 2014-based local authority population projections | * South East Wales: Cardiff, Newport, Rhondda Cynon Taf, Bridgend, Caerphilly, Vale of Glamorgan, Monmouthshire, Torfaen, Merthyr Tydfil, Blaenau Gwent
The projections indicate a varied picture of change across Wales. Of the 22 local authorities in Wales (excluding National Parks), 17 are expected to experience population growth over the 25 years to 2039 and 5 are expected to shrink. The scale of change ranges from +26% in Cardiff to -8% in Powys. These differences reflect the complex range of factors that influence population change in Wales, including the growth of urban areas, the ageing population and the availability of new housing.
Figure 1: Scale of population increase (2014-2039)

Source: Welsh Government 2014-based local authority projections
The ageing population
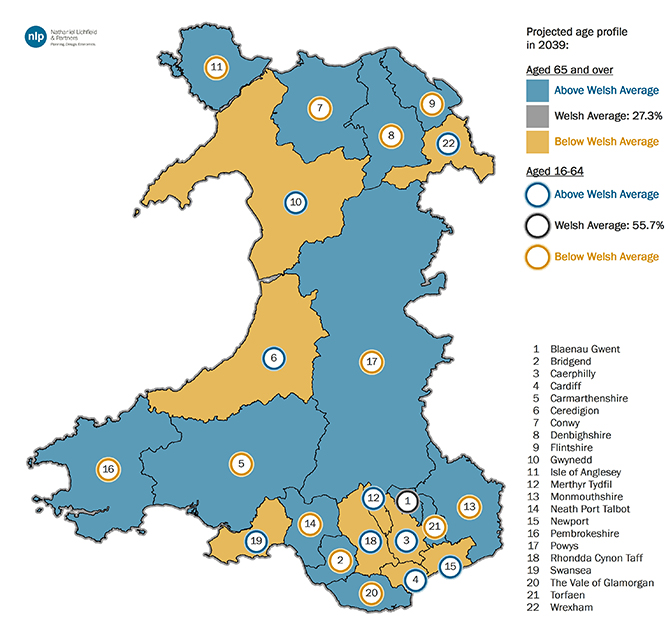
The 2014-based local authority population projections emphasise the recognised trend of a rapidly ageing population. People aged 65 and older account for a total of 45% of the projected population increase, and by 2039, 27% of the population of Wales is expected to be aged 65 and older, compared to 20% in 2014. Powys is set to become the “oldest” local authority in Wales, with 39% of residents expected to be aged 65 and older in 2039, and Monmouthshire close behind at 38%.
In 2039, working age people (aged 16 to 64) are anticipated to account for 56% of the population in Wales, compared to 62% in 2014, indicating that there will be 107,700 fewer people in this age group by the end of the projection period. This data presents a concerning picture for Wales, as the economy relies upon the availability of labour. While economic activity rates are increasing amongst older people, in part reflecting changes to the state pension age, these rates will be significantly lower than for younger workers. It will therefore still be important for local authorities to consider how to attract and retain young and middle-aged workers over the coming years. Increasing the supply of suitable housing can form a powerful part of this strategy.
Figure 2: Projected age profile in 2039

Source: Welsh Government 2014-based local authority population projections
The driving factors of population change
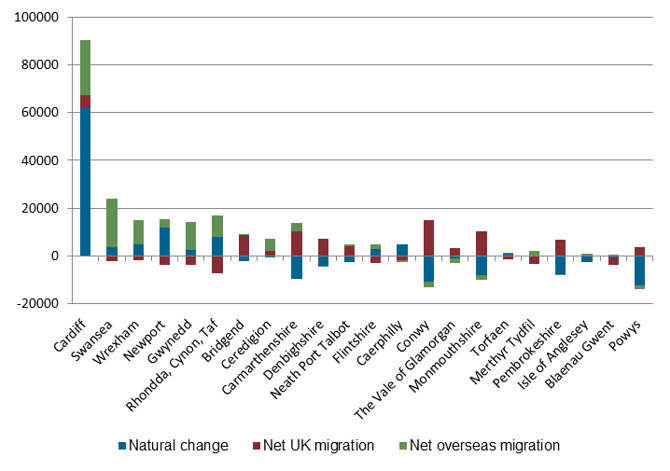
In order to understand the projected population change in Wales, it is necessary to explore its two key components: natural change (the difference between births and deaths) and net migration. These factors are interconnected, as the age profile of people migrating into and out of an area will influence numbers of births and deaths. Areas with more migrants of child-bearing age will have more births, and retirement destinations will experience more deaths.
Migration is expected to play a significant role in shaping the future population of Wales. A total of 77% of the projected population change is assigned to net migration (27% UK and 49% overseas) between 2014 and 2039, while only 24% is due to natural change. Rural areas tend to attract a higher level of UK net migration, although Conwy is expected to receive the largest number of net UK migrants (598 per annum). Net UK migration is comparatively low in urban areas such as Cardiff, which to some extent could be due to large numbers of people moving out in response to high house prices (partly due to an inadequate supply of housing). Meanwhile, overseas net migration is generally focused on urban locations, with Cardiff attracting the largest number of net overseas migrants (920 per annum).
Almost half of Welsh local authorities (10 areas) are expected to experience positive natural change (more births than deaths) over the 25 year period to 2039. In five of the local authorities where population growth is forecasted, natural change accounts for over 50% of this change. Four of these local authorities are located in South East Wales (Caerphilly, Newport, Rhondda Cynon Taf and Cardiff), showing that the region is expected to remain popular with families. This trend is likely to reflect the younger age profile of the existing population and also the number of overseas migrants, which are more likely to be of child-bearing age.
Figure 3: Components of population change (2014 to 2039)

Source: Welsh Government 2014-based local authority population projections
Comparison with the previous set of projections
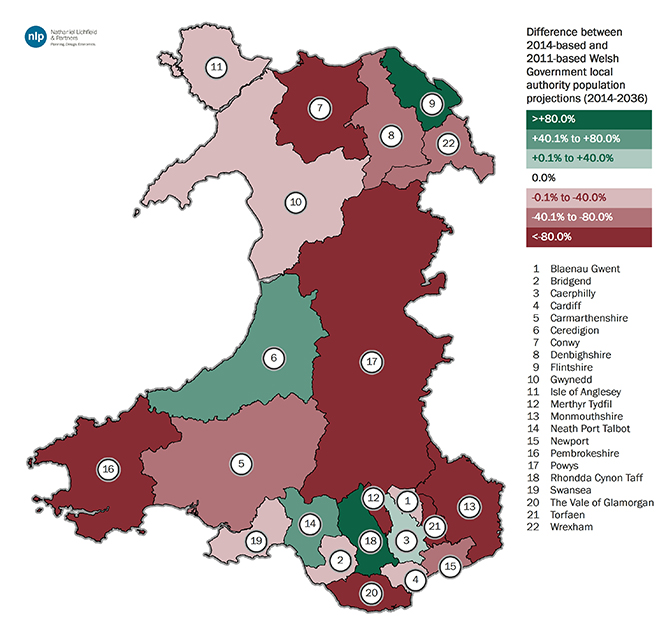
The 2014-based projections anticipate an overall level of growth for Wales that is 32% lower than that indicated by the previous, 2011-based projections for the years 2014 to 2036 (the common period covered by both sets of projections). Projected growth is higher in only five local authorities.
Figure 4: Difference between the 2014-based and 2011-based Welsh Government local authority population projections

Source: Welsh Government 2014-based local authority population projections
It is important to bear in mind that the Welsh Government projections are calculated based on trends that occurred during the five years preceding their base date. In this case, the basis period for the 2014-based projections (2009 to 2014) followed in the aftermath of the recession (2008 to 2009), while its impact was still very much in evidence in the housing market.
Population change is influenced by many different factors, one of which is the number of new homes available. This makes sense when you consider that any household moving to a new location will need to find somewhere to live. Positive net migration therefore relies partly upon an adequate supply of new homes. During the recession, housing delivery reduced drastically in Wales. In comparing the rates of housing delivery on which the 2011 and 2014-based projections are based, it is notable that 8,250 fewer new homes were completed between 2009 and 2014 (the period on which the 2014-based projections are based) than between 2006 and 2011 (the basis for the 2011-based projections). This factor alone is expected to account for a significant reduction in the projected future population change from the levels indicated in the 2011-based projections.
It is also important to consider that the relationship between population change and household growth is driven not only by the number of people who need homes but also by household size. This in turn is related to the age profile of the population, with older people tending to live in smaller households. Therefore, the fact that the 2014-based projections indicate a lower level of population growth overall than the previous set obscures the expected increase in the number of older people. As such, it cannot be assumed that a reduction in the overall level of population growth will translate into a reduced need for housing.
Summary
The 2014-based local authority population projections indicate the following key trends and issues:
- Significant pressure on Cardiff’s housing market, which will need to be addressed either within the city or in neighbouring areas;
- The need to accommodate our rapidly ageing population across Wales but particularly in areas such as Powys and Monmouthshire;
- The need to attract and retain working age people in order to support the economy, partly through the provision of suitable housing;
- Although the 2014-based projections are lower than the 2011-based projections for most local authorities, they have been shaped by significantly reduced housing delivery during the recession and therefore must not be relied upon as the sole basis for assessing housing need; and,
- It is essential that account is taken of the age structure of the population when setting local housing requirements.


