Our blog -
'Mangling the Mutant' - provided thoughts on the implications of the revisions to the Standard Method for assessing local housing need when it was released just before Christmas, and charted the Government’s retreat from its original proposals of August last year.
For most local planning authority (LPA) areas, the Government simply reverted to its 2018 version of the Standard Method, with the only change being a 35% uplift to the 20 largest Cities and Urban Centres in England. Applying this uplift magically elevates the combined national local housing need figure to just shy of 300,000 per annum; fancy that!
The general merits of this approach are debated elsewhere. In this blog we look specifically at the top 20 cities/urban areas selected for the uplift, which are currently: Birmingham, Bradford, Brighton and Hove, Bristol, Coventry, Derby, Kingston upon Hull, Leeds, Leicester, Liverpool, London, Manchester, Newcastle upon Tyne, Nottingham, Plymouth, Reading, Sheffield, Southampton, Stoke-on-Trent, and Wolverhampton
[1].
There are two things to note when considering the top 20 cities/urban areas. First, the top 20 cities/urban areas can change over time based on population growth. Second, with the exception of London
[2] the uplift is applied only to the LPA in each city/urban area with the largest population; for example, in Manchester the uplift is only applied to Manchester City Council (being the Manchester LPA with the greatest population) not the whole urban area of Manchester (including Salford, Trafford etc.).
The selection of the top 20 gives rise to many questions. In this blog we look at four:
- How were the top 20 determined and is there a logic to the threshold?
- The top 20 can change, but is this likely? and
- Urban vs administrative boundaries?
- What is the rationale for the uplift?
How were the top 20 determined and is there a logic to the threshold?
There is no background data set that shows the full workings out of how the Government arrived at the top 20 list. The PPG simply states:
“The cities and urban centres list is devised by ranking the Office for National Statistics list of Major Towns and Citiesby population size using the latest mid-year population estimates (nomis, official labour market statistics).” (2a-004)
When the updated PPG was first published it linked through to a Freedom of Information (FOI) request. That link seems to have been updated over the Christmas break, now directing to a list of towns and cities defined by the ONS. From the original FOI link, buried away in the data requested, was a dataset matching Middle Layer Super Output Areas (MSOAs) to the list of towns and cities which can be found
here. Using this data and the matching the MSOAs against the latest 2018 mid-year population estimates we get the 20 cities/urban areas which matches with the Governments own list (the list of the top 40 and current population is presented later in this blog).
We can’t be sure if the Government used best-fit MSOAs as the FOI data also included cities matched at the smaller output level. But since there are no workings from MHCLG and we reach the same 20 cities with our approach (see below for the list), we think we are on the right track.
Of note, Portsmouth is number 21 and is the closest LPA to being subject to the uplift; dodging the 35% bullet by virtue of just 12,000 people. Also of note - as was highlighted in our previous blog - all of the OxCam corridor’s urban areas fell outside the top 20; however, four of them feature in the top 30 (with a further two – Oxford and Cambridge - in the 31-40 band)
[3].
Whatever the merits in principle of applying the cities/urban centres uplift, questions arise as to the logic of a fixed percentage uplift to just 20 areas, creating a 'cliff edge' with comparable places falling either side of a threshold that might be perceived as arbitrary; the fact that - outside the top 20 - there are four other cities/urban areas with a population over 200,000 (including Portsmouth and Norwich) or places - like Milton Keynes - with obvious potential to grow, does make it seem a blunt approach. An alternative would have been to mirror the formula approach of the affordability adjustment, with a sliding scale or bands based on size, so the uplift is in some way proportionate to the size of centre. This would have captured an uplift to other locations that are undeniably major urban centres.
The top 20 can change, but is this likely?
The PPG (ID: 2a-004) says:
“Whether a cities and urban centres uplift applies depends on whether the local authority contains the largest proportion of population for one of the 20 cities or urban centres in England within the list.”
So, the 20 LPAs currently might change if the population of these areas changes relative to other centres down the list. But is this likely?
Probably not.
We have looked at the ONS 2018-based population projections up to 2043. Applied to the current defined urban areas (which may change given possibility for urban growth etc.) and calculated at MSOA
[4] level. Presented in the table below, these show that, even with differing rates of growth, areas are not projected to grow (or shrink) to the extent the places falling within the top 20 will change. In simple terms, barring some dramatic population shifts (such as a baby boom in Portsmouth and a mass exodus from Wolverhampton), no urban area outside the top 20 is projected to grow at such a rate, relative to those above it, that it breaks into the top tier. The LPAs that have the 35% uplift now are most likely stuck with it until a new system for binding housing requirements (as heralded by the White Paper) comes along
[5].
If there are any changes to the top 20, it is more likely to come about as a result of ONS amending the defined urban areas by best fit MSOAs, although this would mean the ONS methodology for such a technical exercise carrying a policy-making burden it was not designed to bear.
Urban vs administrative boundaries
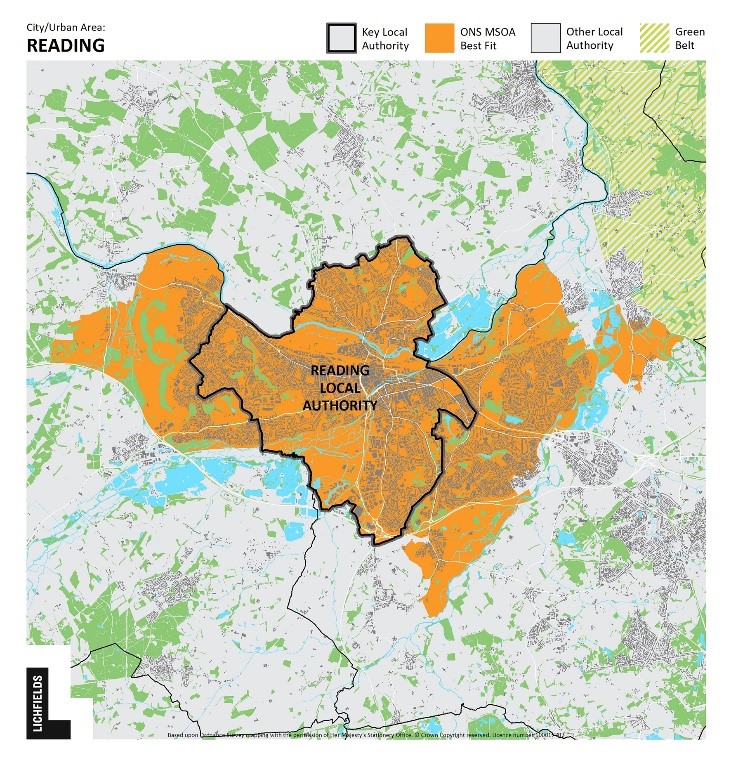
With the exception of London, the uplift is applied to the LPA with the highest population in each defined top 20 cities/urban area. The Government’s aim is to apply the uplift to the most populous areas to encourage more sustainable and brownfield development. However, this principle does not take account of how the urban areas of cities align with the LPA boundaries. It also does not take account of the practical constraints on development potential each of those LPAs might have (flagging how the assessment of need for these cities is now contaminated by policy factors).
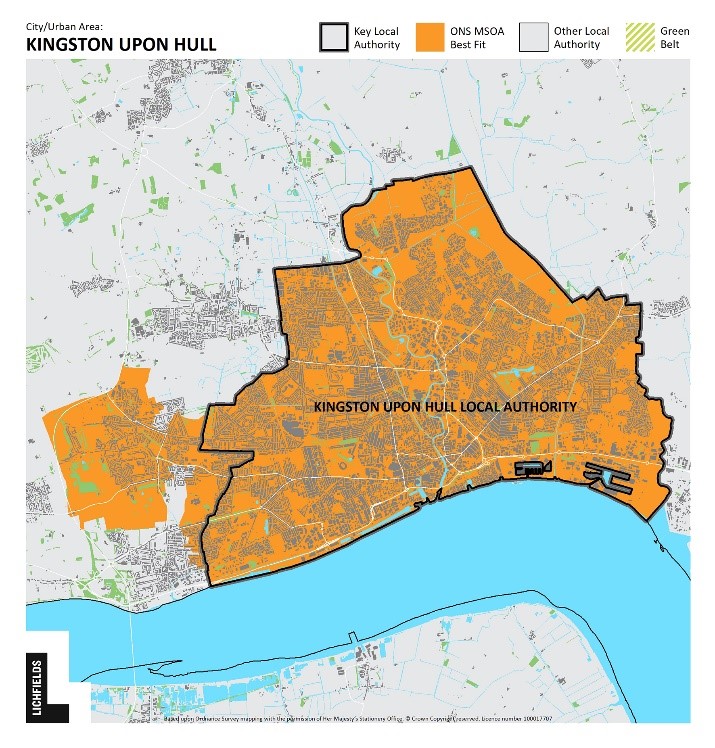
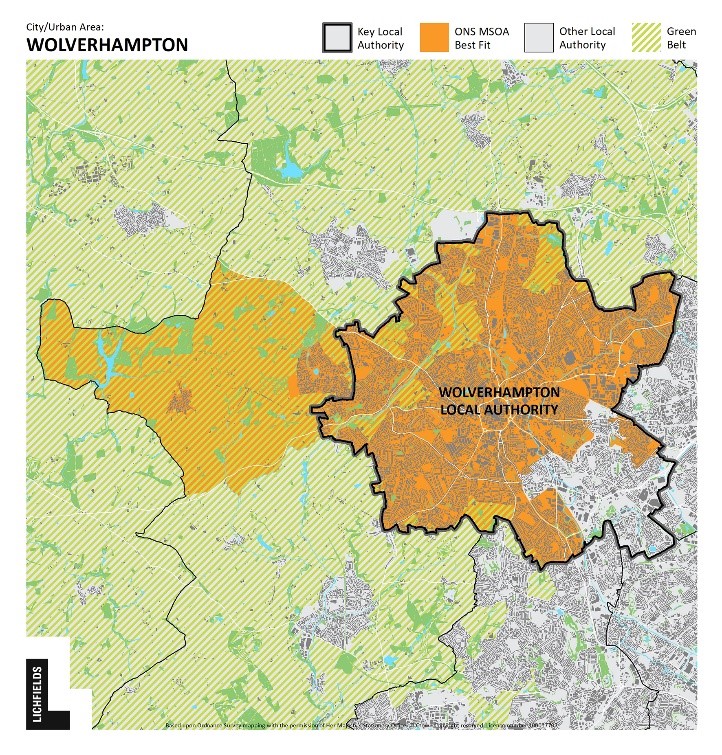
For some cities, the approach does make some sort of sense. For example, the urban area of Hull is more or less wholly within the LPA of Hull City Council as shown below. The same goes for Wolverhampton. In these cases, the uplift is applied to (in the main) the whole of the city/urban area and is neither applied to large areas outside of the urban area nor to areas that form part of the functional city but are outside of the LPA's control.
 |
 |
However, for others it is less logical. Take Manchester: only Manchester City Council gets the 35% uplift. While this LPA does cover the central area of Manchester, applying the uplift just to the City means that other areas close to the centre (such as parts of Salford and Trafford) are not subject to the same uplift. That is despite them potentially having more brownfield land or central locations for development than areas in the very south of Manchester City’s boundary. Equally, what is it that makes the Greater Manchester urban area (comprising Manchester City, Bolton, Bury, Rochdale, Salford and Stockport) different from the way in which all 33 of London's Boroughs and the City were treated by the method?
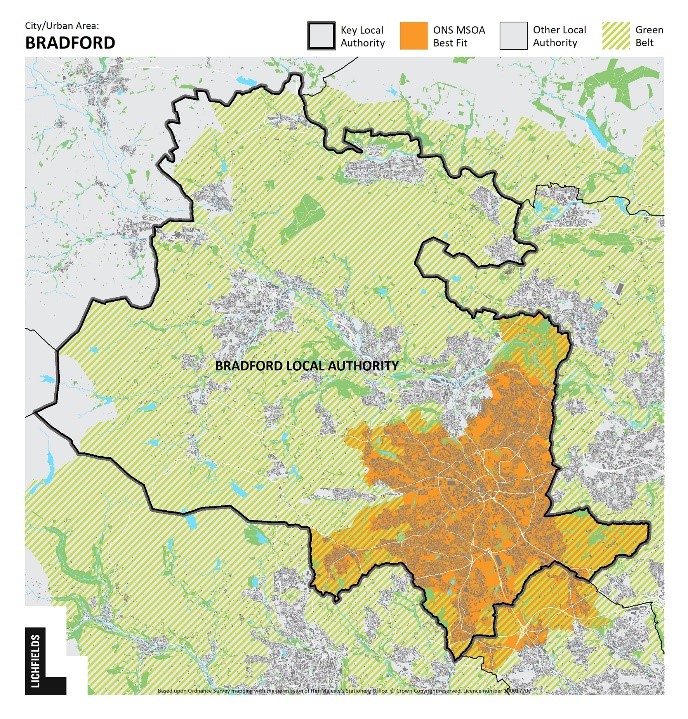
Bradford is at the other end of the scale to Manchester; the LPA is far larger than the defined urban area itself. With a blanket 35% uplift to the whole LPA, the city has options – subject to its Green Belt – to address the uplift by releasing land on its periphery or rural hinterland.
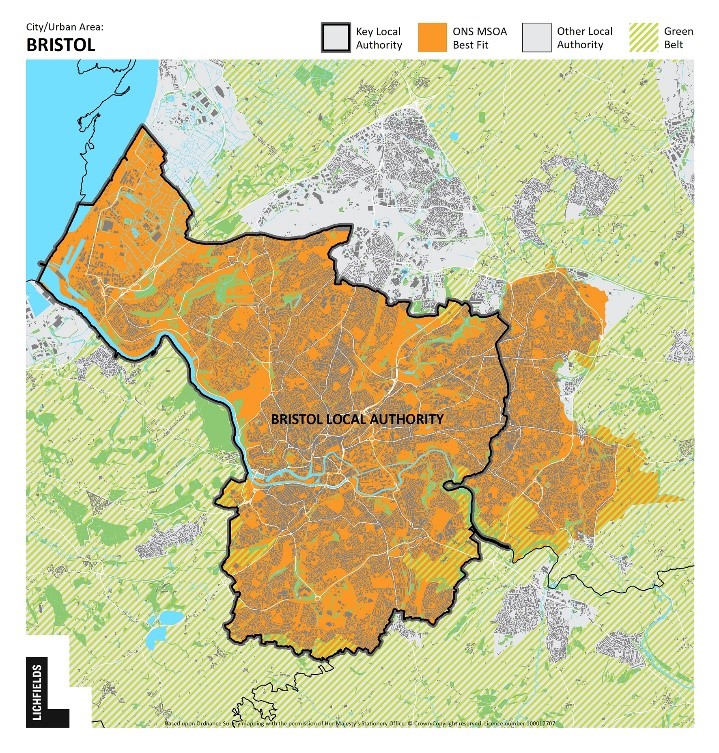
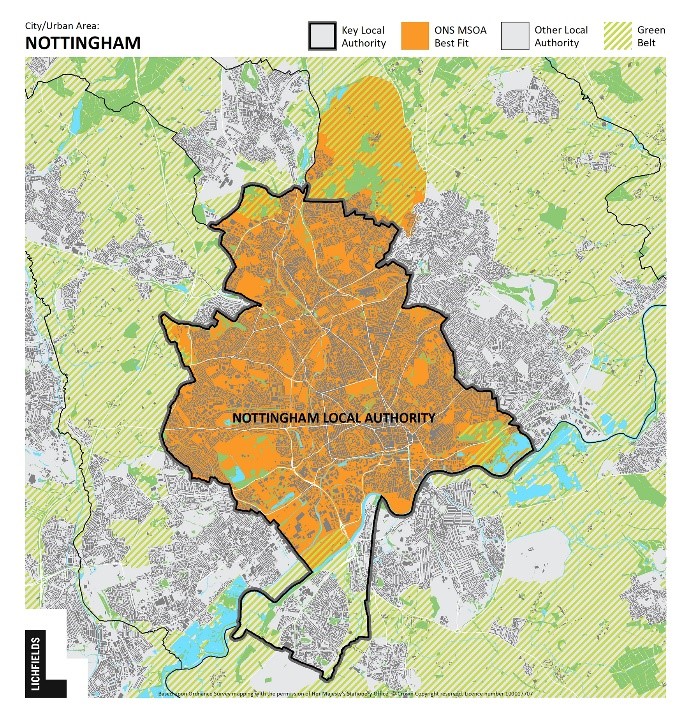
Another issue arises where large parts of a functional city are not within an LPAs boundary (akin to Manchester in many respects). In Bristol a large chunk of the eastern part of the city (an area of Green Belt release where a considerable portion of the city’s previous housing needs have been met) is not subject to the uplift as it is outside the Bristol City area. Nor is a large part of Bristol’s northern extent within in its own boundaries (albeit not captured by the ONS best fit). Nottingham is similar where large parts of its wider urban area (also not captured by the ONS best fit) are not in control of the City Council.
This obviously highlights both the limitations (and idiosyncrasies) of the ONS ‘best fit’ exercise (in terms of defining what is or is not part of a main city or urban area) but also the variable approaches available to some LPAs for delivering 35% extra housing.
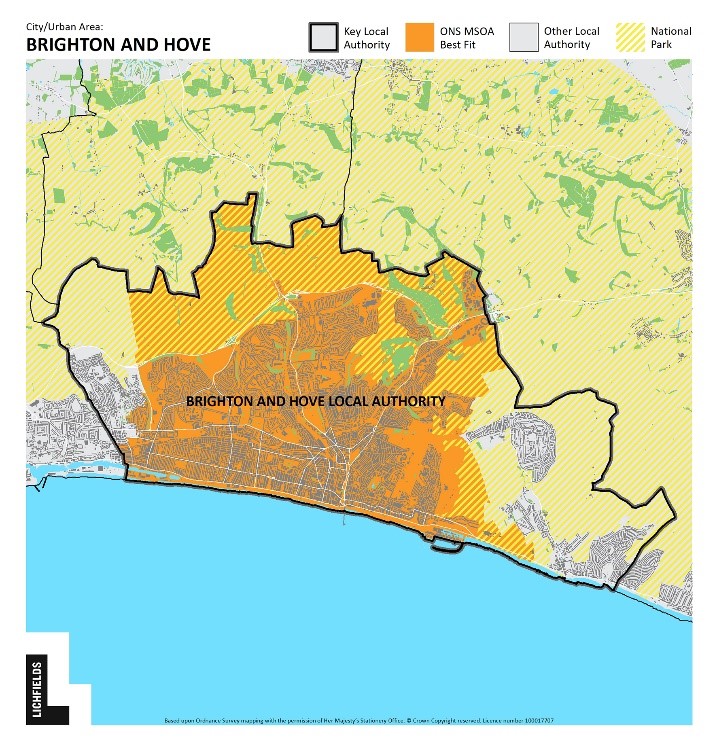
This takes us to land constraints: the 35% uplift bears no relation to the availability of land in the area. Two obvious examples are Brighton & Hove and Reading. As highlighted in our previous blog, Brighton is bounded by the sea to the south and a National Park to the north while Reading has already built up to its boundaries with much of its development needs already being met on adjacent land in neighbouring LPAs. The same can be said of Coventry, Leicester and Southampton to differing extents. So, where can the extra 35% be met? The duty to cooperate will have to do some heavy lifting here to redistribute uplifted needs in plan preparation. Whilst it can work - Coventry is an example of relatively successful (if not exactly speedy) redistribution under this regime
[6] - we know from experience elsewhere it creaks (as do other strategic planning mechanisms) when faced with big numbers and multiple local authorities across complex urban areas.
What is the rationale for the uplift?
In our previous blog we set out the Government's rationale for the uplift was based on three factors: maximising existing infrastructure; responding to the availability of land arising from structural change in retail and commerce, thereby maximising brownfield rather than greenfield development; and responding to climate change by reducing high-carbon travel. The approach set out by Government raises two points of discussion:
First, is one of principle. Housing need is a concept that has long been untarnished by policy factors that should promote or constrain the delivery of housing in different areas
[7]. This was made very clear by the Courts in
Gallagher Estates Ltd v Solihull MBC[8] where, at paragraph 37 of the judgment, the housing
requirement was clearly delineated from the objective assessment of housing
need as follows:
“ii) Full Objective Assessment of Need for Housing: This is the objectively assessed need for housing in an area, leaving aside policy considerations….
iii) Housing Requirement: This is the figure which reflects, not only the assessed need for housing, but also any policy considerations that might require that figure to be manipulated to determine the actual housing target for an area. For example, built development in an area might be constrained by the extent of land which is the subject of policy protection, such as Green Belt or Areas of Outstanding Natural Beauty. Or it might be decided, as a matter of policy, to encourage or discourage particular migration reflected in demographic trends. Once these policy considerations have been applied to the figure for full objectively assessed need for housing in an area, the result is a "policy on" figure for housing requirement.”
This distinction between 'need' and 'requirement' means plan makers (and in due course the Local Plan Inspector) would take the local housing need (‘policy off’) and determine the appropriate requirement (‘policy on’) based on spatial policy factors that would include judgements about the desirability to focus development on brownfield sites, in proximity to transport infrastructure, and the desirability of reducing high-carbon travel (all three being longstanding components of national planning policy).
The updated standard method now incorporates these three spatial policy judgements into the assessment of need. Of course, the NPPF para 11 b) still applies, so the housing need figure remains a minimum starting point, and capacity factors may justify setting a requirement figure below the level of 'need'. The practical problem arises because the 35% uplift does not take account of constraints, with locations like Brighton (and London, Birmingham, Coventry etc.) all having very recently demonstrated to Inspectors that are they do not have realistic urban capacity to meet previous (even lower) estimates of need.
The urban priority is being 'double handled' in both the assessment of need and in the 'policy on' exercise of setting the requirement, with the evidential foundation for the former bearing no relationship to the proper exercise that will need to be undertaken in the latter.
This creates a problem of perception (the numbers are unlikely to be achieved in the areas identified) and practicality (in that unmet need is then difficult to redistribute to neighbouring areas), which makes it less likely the Government will hit its 300K per annum national ambition or address growth needs in areas of greatest economic and affordability pressures.
This takes us to the second point. If we are crossing the Rubicon to include spatial ‘policy-on’ elements into the assessment of need, why stop here? Could a lesser uplift have been applied to the next tier of cities (21-30)? Why did the Government not also apply an uplift to urban areas where development would help meet its own aspirations such as the OxCam Arc (e.g. by applying an uplift to Milton Keynes, Oxford, Cambridge and other Arc urban areas) to reflect the National Infrastructure Commission? The PPG (ID: 2a-010) already provided a conceptual framework for this in explaining the basis on which 'actual need' might be higher than the standard method:
“Therefore, there will be circumstances where it is appropriate to consider whether actual housing need is higher than the standard method indicates.
This will need to be assessed prior to, and separate from, considering how much of the overall need can be accommodated (and then translated into a housing requirement figure for the strategic policies in the plan). Circumstances where this may be appropriate include, but are not limited to situations where increases in housing need are likely to exceed past trends because of:
- growth strategies for the area that are likely to be deliverable, for example where funding is in place to promote and facilitate additional growth (e.g. Housing Deals);
- strategic infrastructure improvements that are likely to drive an increase in the homes needed locally”
Taken as a whole, the 35% uplift to the top 20 urban areas and cities invites more questions than it answers. It will be perceived as a blunt tool with a potentially messy application in many of the cities/urban areas to which it applies. And having blurred the concept of need for policy reasons, it appears not to have fulfilled its potential – for reasons on which we can all speculate – to deliver the uplift in areas where it will deliver the most benefit.
[1] ID: 2a-004[2] ID: 2a-034[3] Northampton (22), Luton (23), Peterborough (27), Milton Keynes (29), Oxford (34), Cambridge (40).[4] MSOA = Middle layer Super Output Area[5] Some initial thoughts on the challenge of this new White Paper system for setting binding requirements can be found here[6] Based on the Memorandum of Understanding between Coventry and the Warwickshire authorities, which has been taken through Local Plans in both Coventry and its surrounding areas.[7] This 2010 research provides a good summary of the concepts of housing need. PPS3 (2006 and subsequently) defined housing demand and need respectively as: “The quantity of housing that households are willing and able to buy or rent” and “The quantity of housing required for households who are unable to access suitable housing without financial assistance.” [8] The judgement is available here
Image credit: Pollard Thomas Edwards