The issue of housing need and the number of homes being planned for is really important and it’s great to see it getting more airtime and column inches in the mainstream media. But has this led to yet another kneejerk reaction that will result in harmful outcomes for the North East?
When reading the news of the Government’s latest proposals for the Standard Method, I was reminded of an episode of The Thick of It where beleaguered MP, Nicola Murray, pleads “That WAS a U-turn! If I do another U-turn it’s an O-turn.”
The latest iteration of the Standard Method, which has been causing consternation (albeit for different reasons) amongst planners, developers, MPs and the general public since its proposal in 2017, will largely return to the approach suggested previously, with a single modification that falls considerably short of those which its various critics advocated during the recent consultation.
As set out in Lichfields’
recent blog, the Government has now announced that the Standard Method will largely remain that which was first introduced in 2017. The only difference is that an uplift of 35% is applied to the 20 largest cities across England. For the vast majority of LPAs, including 65 of the 72 LPAs in the North, there will be no change in their housing need figure. As a result, it is hard not to feel that a great deal of time and effort has been expended to arrive back at somewhere very close to where we started out over three years ago – and there was broad consensus that that approach wasn’t fit for purpose!
How does the Standard Method work and why is this a problem in the North?
The formula which underpins the new (SM3 - the third and what now seems likely to be the final) version of the Standard Method uses the 2014-based household projections to identify a demographic baseline for each local authority (LPA), which is then uplifted to address local affordability and is finally capped (if needed) based on the age of the LPA’s Local Plan. The ‘cities and urban centres uplift’ is then applied to this figure.
The problems (particularly for the North) with basing the Standard Method on the household projections, has been extensively
discussed by Lichfields. The projections are based on historically low population growth which was followed by suppressed household formation rates experienced during the 2008 recession. As a result of the projections being based on past trends, these are perpetuated in future projections. This is acute in the North, where the recession had a particularly significant impact. Given that the newest version of the formula is, for most LPAs, unchanged, it is unsurprising that these issues remain. The increased age of the projections still being used in the SM only compounds these problems.
As a result of the artificially and excessively low baseline, the affordability uplift is largely irrelevant for most northern LPAs, where affordability ratios are typically lower than in the South of England. The third stage of capping the resulting Standard Method figure is irrelevant in the North, as the Standard Method outputs are lower than housing requirements set out in Local Plans.
An opportunity missed?
SM3 results in an overall national figure of 297,600, which is closer to, but still below, the Government’s target of 300,000 new homes each year. It is also significantly less than the figure of 337,300 dwellings per annum generated by the version of the formula consulted on in August 2020 (SM2). The reason why that figure was so high was to ensure that even after some LPAs had justified the use of a housing requirement lower than their SM2 figure, the 300,000 home target could still be achieved.
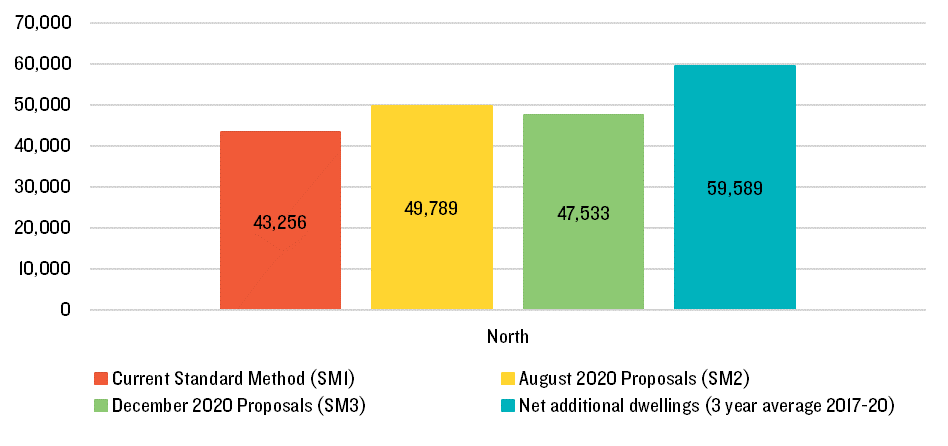
The difference between the two methods is stark in the North; SM3 results in a figure of 47,500 dpa, higher than the figure of 43,300 dpa generated by SM1 (the current version of the Standard Method), but significantly less than the 49,800 dpa identified by SM2. More significantly, and worryingly, the SM3 figure is over 20% less than the average number of homes actually delivered across the North in each of the past three years - 59,600 dpa.
Figure 1 Comparison of Standard Method approaches for the North
Source: Lichfields
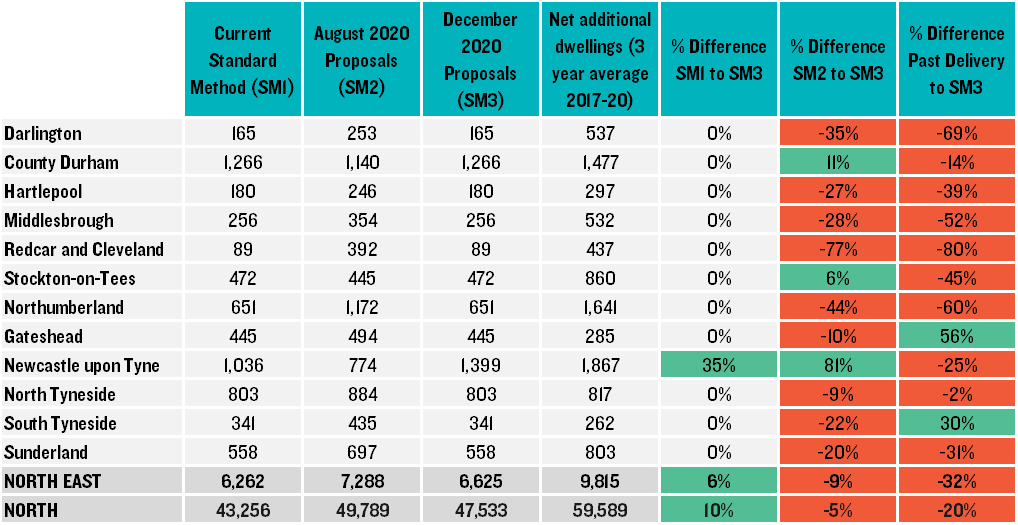
In the North East, the discrepancy between SM3 and past delivery levels is even greater; SM3 results in a total of 6,625 dpa, compared to the average delivery levels of 9,815 dpa, a decrease of 32%. Indeed, SM3 exceeds past delivery levels in only two of the 12 North East local authorities (Gateshead and South Tyneside), even with Newcastle’s ‘cities and urban centres’ uplift.
Table 1 Comparison between original Standard Method, August and December proposals and past delivery
Source: Lichfields (Figures correct as of Dec 2020)
SM2 was considered a moderate improvement on the original approach when applied in the North East (although a number of
issues remained unaddressed). The major difference was that the revised approach used the higher of the 2018-based projections or 0.5% of existing stock as the baseline. As a result, the proposed figure across the North East was significantly closer to past delivery rates than when projections alone are used (as in SM1 and SM3).
Additionally, a stock-based approach provides a much more stable method to identifying a baseline position, as it is based on the number of existing homes in an area which does not experience the significant fluctuations observed through projections, which are updated every two years.
Finally, SM3 reverts to using the 2014-based projections, despite the fact that two sets of projections have been released since. In their rationale for retaining the current (SM1) approach, the Government state that although use of the 2018-based projections has been carefully considered, “
due to the substantial change in the distribution of housing need that would arise as a result, in the interests of stability for local planning and for local communities” the 2014-based projections should be used instead
[1]. This approach seems counter-intuitive given the importance of using up-to-date evidence, including within the Standard Method itself (affordability ratios) and does not seem like a long-term solution as we move further away from 2014. In the North it causes decline rather than stability.
20’s plenty…or is it?
As shown in Table 1, in the North East only Newcastle sees a difference in SM3 when compared with SM1. For every other LPA, the Standard Method is back where it started, with all the associated problems. This is because only Newcastle is within the 20 cities to which the 35% cities uplift is applied. Looking more broadly, seven (Newcastle, Manchester, Liverpool, Leeds, Bradford, Sheffield and Hull) of the 20 cities are found within the North.
The uplift is only applied to the LPAs which contain the largest proportion of the population for each of the 20 cities identified (with the exception of London, where an uplift is applied to all Boroughs). This approach is problematic for a number of reasons, as discussed in my colleague
Harry’s blog. Specifically in the North East, Newcastle is part of a much larger functional economic and market area that extends into Gateshead, which shares a local plan with Newcastle, and North Tyneside. Both areas play key roles in supporting the wider city. However, under the proposed method, these authorities will receive no uplift to their housing need figure.
Although Newcastle appears able to accommodate the entirety of the uplift, concerns have been raised previously about the proportion of housing delivered in Newcastle that is student accommodation and city centre apartments compared to family housing.
It is also unclear why the Government has chosen 20 cities and a 35% uplift. At face value, both would seem to be arbitrary figures. Why not apply a lower percentage uplift to a larger number of cities, which would help to ensure figures remained deliverable, whilst maintaining the Government’s aspiration to direct more growth to cities and urban areas? This might have the added benefit of directing a greater proportion of the national housing need to cities in the North, supporting the Government’s levelling up agenda.
Finally, the Government’s strategy behind the SM3 is that the urban centres are the most sustainable locations for large amounts of new housing, they have the largest supply of brownfield land and often the most acute affordability problems. That appears laudable in theory but, in reality, there could be problems:
- Is there enough brownfield land to meet these needs? Is it in the right locations? Is it suitable for the type of housing that is needed? Can it be developed viably? If plenty of suitable, viable and available brownfield land exists, why has it not already been developed?
- 14 of the 20 cities are constrained by Green Belt[2] or Metropolitan Open Land. Newcastle took the bold decision in their Core Strategy to release land from their Green Belt which has supported their recent healthy supply and balanced the city centre student and apartment accommodation with family housing.
- Can the physical and social infrastructure cope with this additional concentration of demand?
- Will there be sufficient supply to address the affordability in other areas?
- Will there be sufficient supply to address the other reasons why more housing is needed? In the North these are often more significant than affordability.
One size simply doesn’t fit all
One of the key criticisms levelled during the consultation on SM2 in August 2020 was that imposing centralised local housing need figures, dictated by national Government, would significantly weaken local democracy by taking decision-making away from local people and Councils.
Further criticisms highlighted the apparently arbitrary inputs to the formula. It was also stressed that reliance on a single formula was no substitute for local knowledge and expertise taking into account constraints and opportunities and does little to address the vast range of housing challenges and local strategies in different areas of the country. In the North East, many discussions focused on the continued absence of an economic uplift factor within the formula, reflecting the importance of providing sufficient quality and choice of housing to support the North’s economic aspirations by attracting and retaining young people.
SM3 does nothing to address these problems. It still only takes account of a very narrow range of factors (if anything the removal of a stock component is a backwards step for the North East). It focuses solely on affordability, which, though a key factor, is just one of a number of challenges that drive housing need and, particularly in the North, fails to recognise other factors which are at least as important. It applies a one size fits all approach and imposes a housing need figure on local Councils. It uses arbitrary inputs and, indeed, has increased these. Lastly, far from ‘levelling up’, it continues to funnel housing development towards London and the South East, at the expense of the North East.
After three attempts, is it time to accept that local housing needs simply cannot be calculated using a simple national formula? A broader debate is needed to consider alternative approaches that recognise the importance of this country’s rich local diversity and actually facilitates ‘levelling up’.
[1] Government response to the local housing need proposals in “Changes to the current planning system”
[2] Local authority green belt statistics for England: 2019 to 2020 | #planoraks: Well, now we *really* need to talk about the Green Belt