The Government is currently consulting on proposals to make changes to the NPPF
[1], much of it focused on how Local Plans go about addressing housing needs and on the measures that apply to maintaining a supply of housing.
Recent rate of housing delivery has seen around 233k net additional homes provided in England annually. Although the Government has re-stated its commitment to increase this to 300,000 homes per annum,
analysis prepared by Lichfields for the HBF and LPDF concludes that the NPPF changes are more likely to have the opposite effect, with a drop of 77k per annum taking supply down to around just half the Government’s target. This is before accounting for the restrictions on house building caused by water and nutrient neutrality ruling, which are currently holding up over 100,000 homes.
Our
previous blog explains why the specific provisions in the draft policy will reduce the number of homes being planned for, make it more difficult for unmet need to be addressed elsewhere and remove or dilute the obligations on local authorities to maintain a five year housing land supply or respond to past under-delivery. It also explained how reduced housebuilding will hit the economy to the tune of £34bn of GVA and 386k jobs. There will be consequential reductions in tax revenue.
In this blog we explore some of the potential social impacts of the proposed changes, notably how the fall in supply compounds the symptoms and consequences of the current housing crisis.
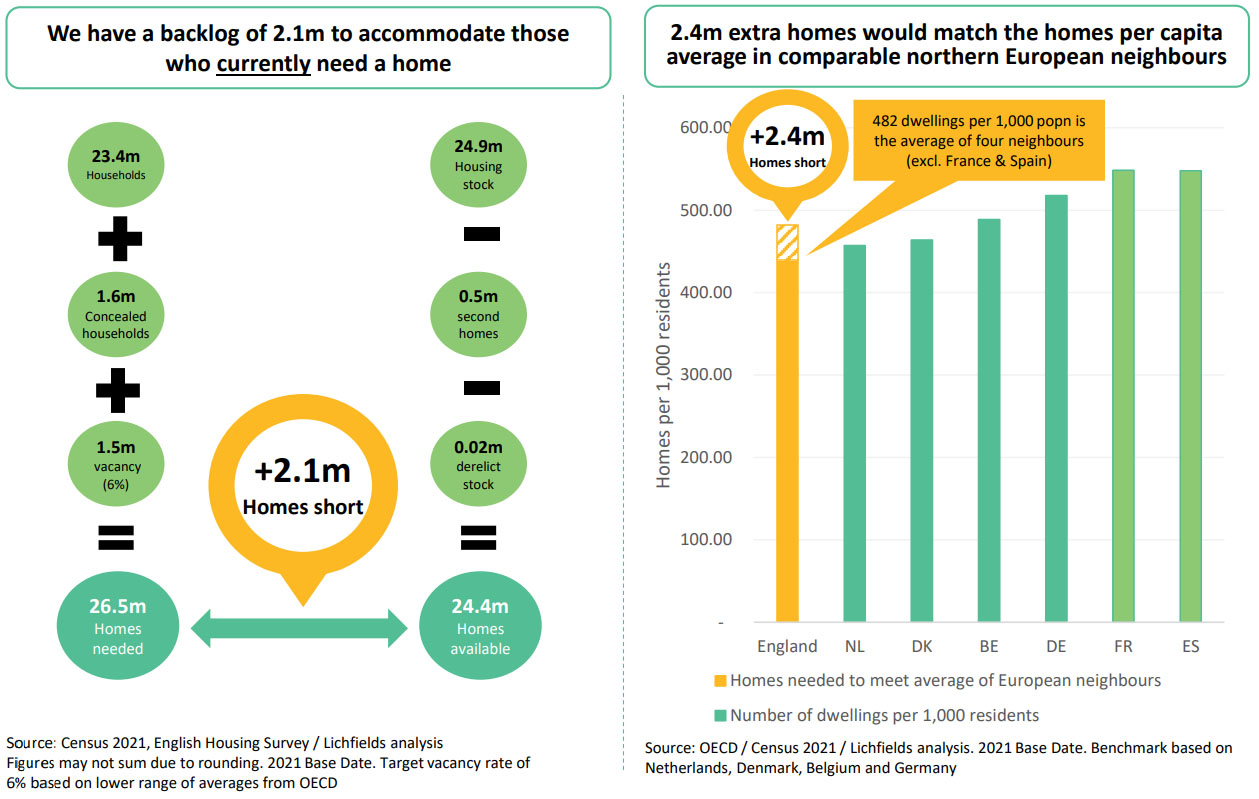
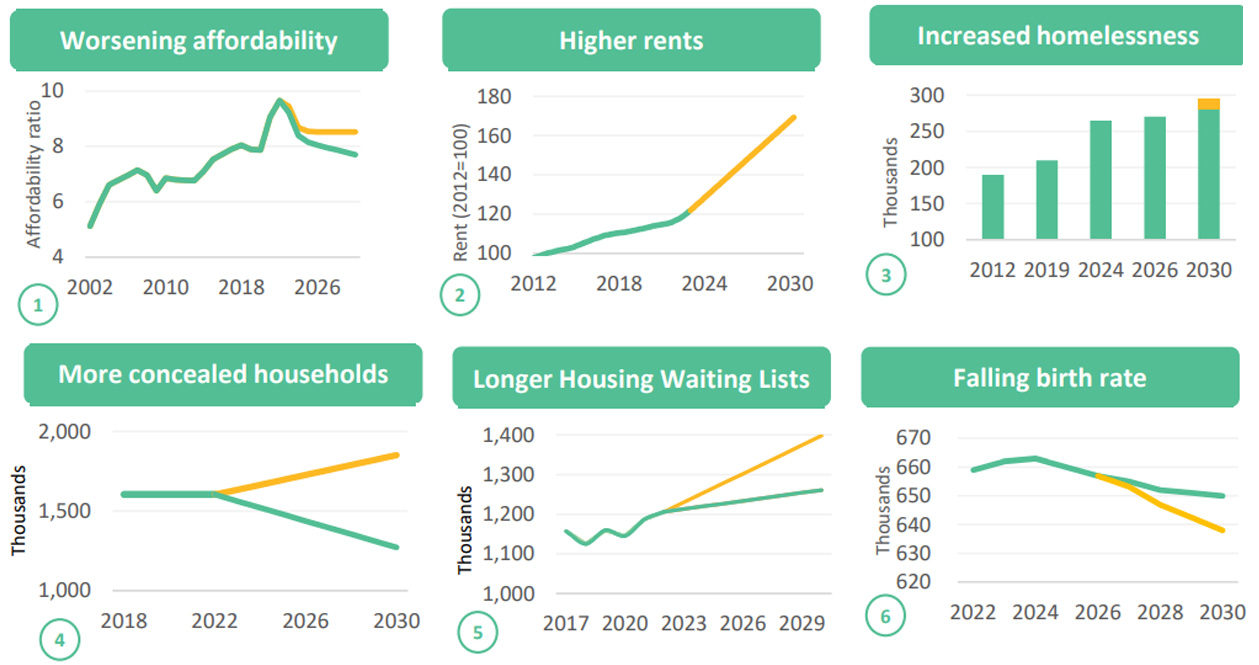
We already have too few homes to house our current population; a conservative estimate is that there around 1.6m ‘concealed households’ that are pushed into sharing homes or are ‘sofa surfing’, unable to move in to a home of their own
[2]. Vacancy rates in England are also low, with fewer empty properties than would be typically expected in a functioning housing market
[3]. Looked at from that perspective, we are 2.1m homes short of what is needed to accommodate our current population.
That England is ‘under-housed’ is readily apparent if one looks elsewhere in Europe. We would need to build 2.4 million extra homes to match the average number of homes per capita of the Netherlands, Germany, Denmark or Belgium
[4]. Even after second homes and derelict stock are accounted for, we fall well over 2 million homes short of housing our current population, and this will be compounded if we do not build enough homes to match the projected growth in the number of households.
Since the Government set its ambition for 300,000 homes per annum, the rate of housing delivery has been undershooting by some margin, and if current rates were maintained, the shortfall would be 0.75m short by 2030.
The proposed NPPF amendments seem likely to make this bad situation even worse, leading to building just half the 300k the Government says are needed each year. Given the water and nutrient neutrality barriers to housing delivery already holding back housing delivery, the 77k drop in output is a best case; it is quite likely the cut will be deeper.
What impacts would a fall in housing supply have on society?
Lichfields has drawn upon existing research and datasets to model potential outcomes. One key input to the analysis is the OBR’s approach to forecasting house prices
[5] and its assessment of house price elasticities drawn from the literature. This can be used to flex what might happen to house prices under different supply-based scenarios, taking into account demographics, mortgage rates and credit conditions derived from other parts of the OBR forecasts, as produced in its Economic and Fiscal outlook in November 2022. This model shows us that building 330,000 homes per annum would peg average prices to 2021 levels by 2030 at the same time as incomes are forecast, thereby gradually improving affordability. These prices forecasts enables us to identify financial implications for different members of society of different levels of supply by 2030. We can also use the literature and official datasets to identify the implications for their lives.
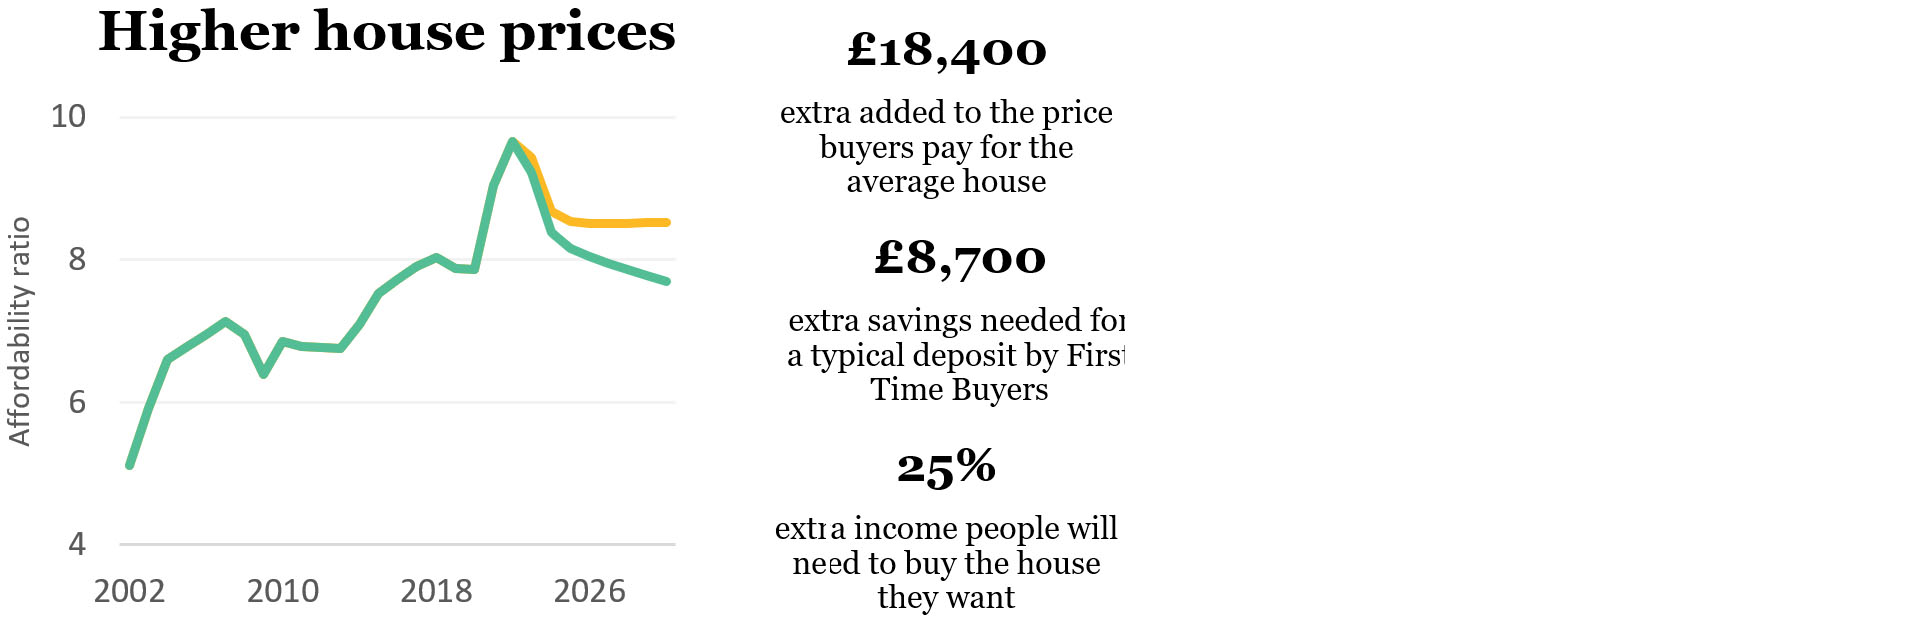
For First Time Buyers. The average homeowner already spends 22% of their income on mortgages (the EU average is 15%) and renters spend even more, 33% (the EU average is 20%)
[6]. This means they have less money to spend on other things.
Lichfield’s analysis finds that by 2030 the changes would add £18,400 to the average house price compared to maintaining current levels of supply, equivalent to the entire take home pay for a £22,000 job such as a nursery practitioner or Education Support Assistant.
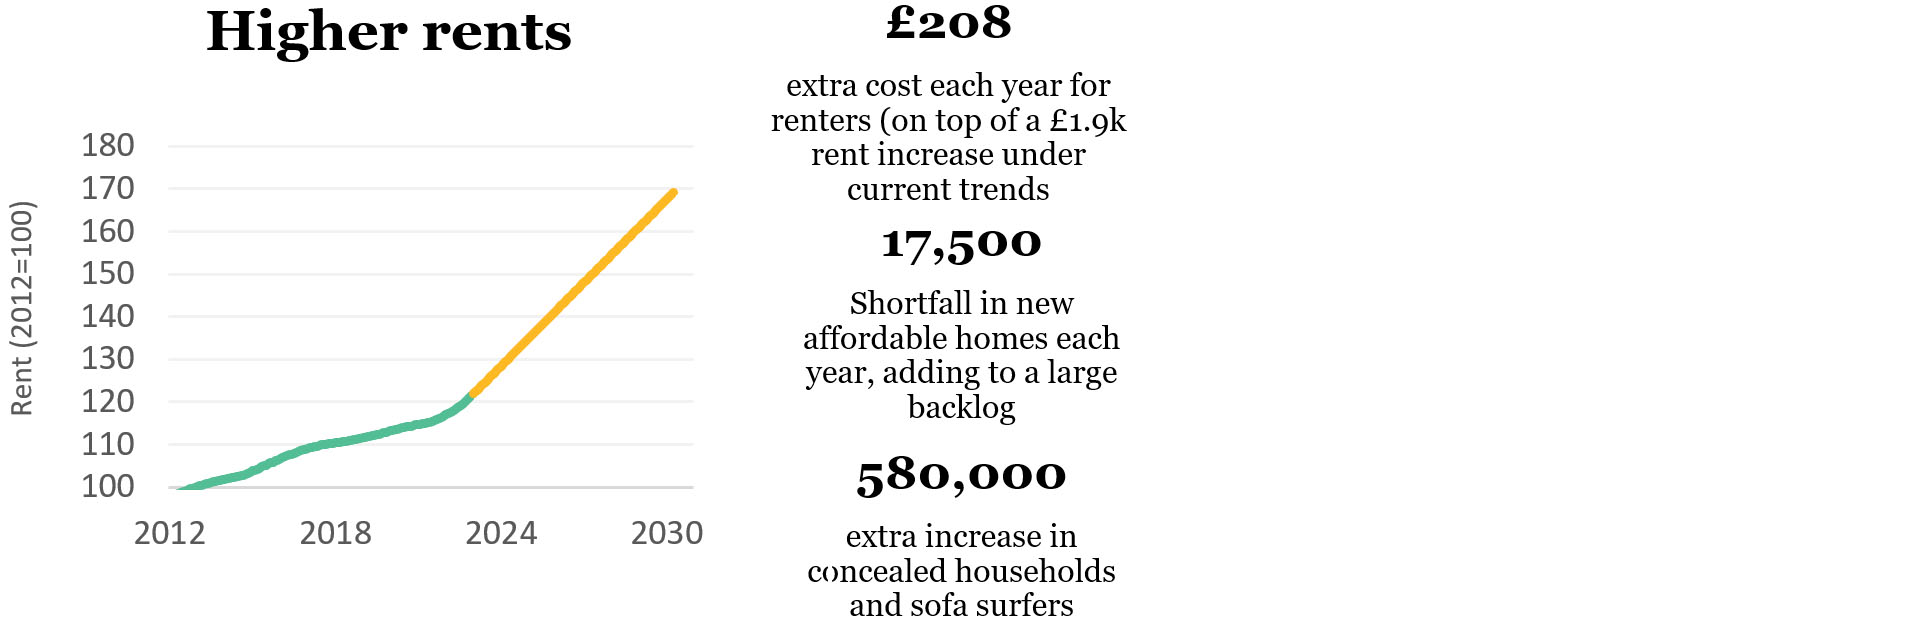
For Renters. More people are renting their homes (more than one in five), almost all of whom are frustrated potential homeowners (89% want to buy). Our assessment is that a cut in housing supply of 77K per year, will act to reduce opportunities for ownership even further.
Each renter will face an additional £208 extra cost each year (on top of the sky high £1,900 p.a. rent increase forecasted under current trends). This means wages will need to increase 25% just for people to buy a home at the historically unaffordable levels they are now.
Because England has amongst the lowest vacancy rates in the developed world, building fewer homes immediately acts to supress household formation. We estimate 580,000 extra concealed households and sofa surfers will be unable to form a household by 2030 – equivalent to the population of Liverpool – just due to the proposed changes.
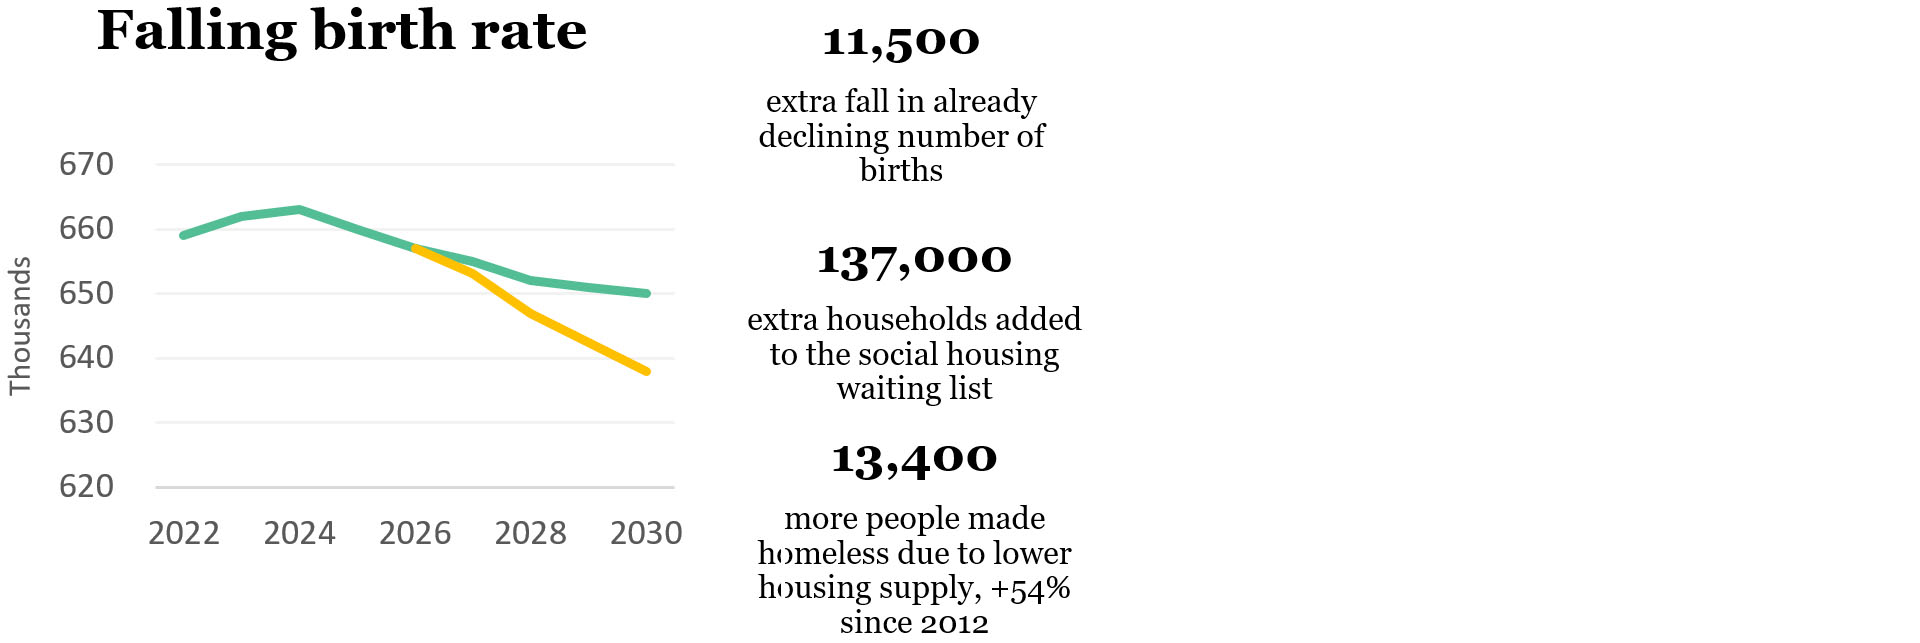
For Families. Research has found that house prices directly affect the ability for families to form and has a direct impact on the birth rate
[7]. Our assessment is that the reduced supply of homes would mean 11,500 fewer births by 2030 that would be expected under current (already declining) trends, adding almost the equivalent of a Wembley Arena of empty seats to the emerging fertility crisis
[8].
A cut in supply will also hit the poorest in society hardest. We estimate it means 13,400 more people expected to be made homeless - equivalent to the capacity of Wimbledon’s Centre Court, and 137,000 added to the social housing waiting list – equivalent to a city the size of Cambridge. This is in part due to 17,500 fewer affordable homes that would be built each year, compared to current rates.
The housing crisis is already having a significant adverse effect on the lives of many – typically younger - people, and the problem is growing. Many of these adverse outcomes are directly related to the Government’s Levelling Up Missions set out in the White Paper
[9]. For example, the mission for housing includes:
“By 2030, renters will have a secure path to ownership with the number of frst-time buyers increasing in all areas. “
Other Levelling Up Missions focus on boosting productivity, pay, jobs and living standards all influenced by the availability of housing, whilst other proposals for education, health and wellbeing are likely to be undermined if areas are unable to recruit and retain key public sector workers.
The Government identifies 300,000 as a national estimation of the minimum requirement to meet housing need; even the current under-shooting of this target means fewer homes, more expensive homes and significant knock-on societal impacts. But the proposed changes to planning policy announced in December seem set compound this shortage, cutting the supply of new housing to just half the minimum level of need. On top of the current barriers to supply arising from the nutrient and water neutrality restrictions, the NPPF changes risk making a bad situation even worse.
[1] The NPPF consultation is available here
[2] As found by the 2018 English Survey – a summary of which is here. This found 541,000 (2%) households reporting that they had someone living with them in the last 12 months who would otherwise be homeless, whilst there were 1.6 million households containing an adult who would prefer to buy or rent their own accommodation but cannot afford to do so, with 2 million adults living in these circumstances. 1.6m for both groups is therefore a very conservative figure.
[3] The position of vacancy rates is explained by Centre for Cities here
[4] Based on analysis using OECD / Census 2021. Base Date 2021.
[5] More information on the OBR’s approach to house price forecasting is here
[6] DLUHC, 2022 English Housing Survey, OECD, Housing Costs over income, 2020.
[7] See for example, this 2017 research – Children of When - by the Adam Smith Institute here
[8] As reported in the Guardian here
[9] The Levelling Up White Paper Executive Summary is here