Update 16 December 2020:
The launch of the proposed new standard method for local housing need on 6th August 2020 unleashed a media and political storm. An unfortunate cross-over with the problems of A-levels and GCSEs led to it being dubbed the ‘mutant algorithm’.
On 16th December, the Government sought to resolve matters, making a series of announcements across four publications:
- A written Ministerial Statement
- Response to the Consultation on Proposed Changes to the Current Planning System
- Updates to the Planning Practice Guidance on Local Housing Need to set the new standard method approach
- A spreadsheet with the indicative figures from the updated method
What are the headlines and what does it mean?
Simplifying how local authorities calculate their housing need number for the purposes of plan-making has been a key element of improving efficiency in plan-making and will continue to be as Government proceeds to ‘overhaul’ the planning system. The current standard method (introduced in 2018) was a step in the right direction, but it became quickly evident that it was not without its issues:
- It relies upon authorities doing more – much more – than their minimum figure (which was a collective 270,000 nationally) to achieve 300,000 homes a year. There were too few ‘carrots and sticks’ to get authorities to do more, and little evidence that enough authorities were doing this voluntarily;
- The method also relies heavily on household projections – in theory a sensible measure of housing need. But these are published every two years (much more frequently than a plan-making cycle), can be subject to significant fluctuations (creating real uncertainty over long-term prospects) and have a reinforcing negative cycle whereby housing under-supply in areas has the effect of lowering the trend (for migration and household formation) that in turn drives future projected growth;
- At a national level the projections have recently yielded progressively lower figures, further undermining the 300,000 ambition (this led government to direct authorities to continue using 2014-based figures, even after more recent projections were published). More delay, more uncertainty; not the outcome government wanted from this method; and
- The projections were also at odds with the desire to help ‘level up’ the midlands and north. It piled need into London and the wider south east where projected household growth was high and affordability was worse, whilst doing the opposite in the north. Significantly boosting housing supply across the country? Clearly not.
What’s changed?
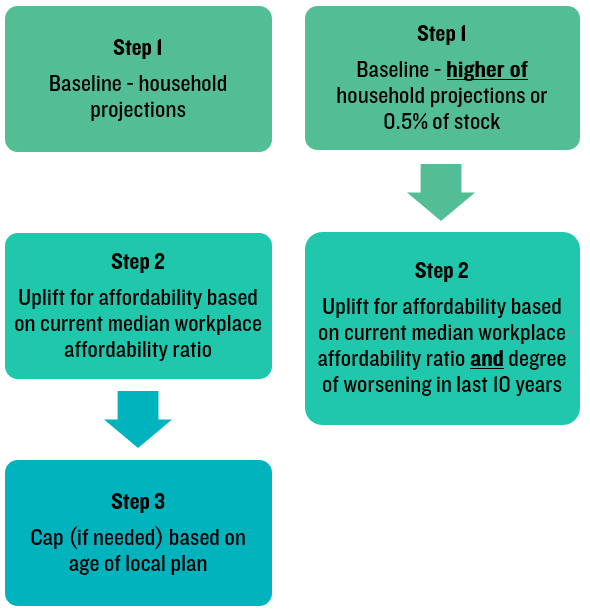
It became clear that government needed to set the bar high – really high - if it wanted anything close to 300,000 to be delivered. Aiming high and delivering fewer homes deemed far more likely to yield the desired result than setting the bar low and asking them to jump higher. Government has responded; in its consultation on Planning Reform published on 6th August it set out a new standard method which now yields 337,000 homes a year nationally. It follows a similar approach to the current method (Figure 1), but with some important changes:
- The baseline was previously solely based on household projections. It now uses the higher of the household projections or5% of stock growth. This helps level up authorities where projections are unduly low and implies a ‘fair share’ approach where each authority does its bit;
- The affordability uplift is now designed “deliver greater overall emphasis on affordability than in the current standard method”. Instead of uplifting solely based on how unaffordable an area currently is, the method now also uplifts based on the change in the ratio over last 10 years.
The removal of the cap has also had a significant impact; previously in place to ensure the numbers were ‘deliverable’, Government now believes the cap is ‘not compatible’ with the objective to boost housing supply quickly (an interesting change of tune). This open-ended approach has now led to some significantly higher numbers across London and the south where affordability has significantly worsened since 2009. This will no doubt be a difficult pill to swallow for some areas, but Governments’ intention to concentrate need in areas of poor affordability is abundantly clear.
Figure 1 – Difference between current standard method and proposed standard method for assessing housing needs (simplified)
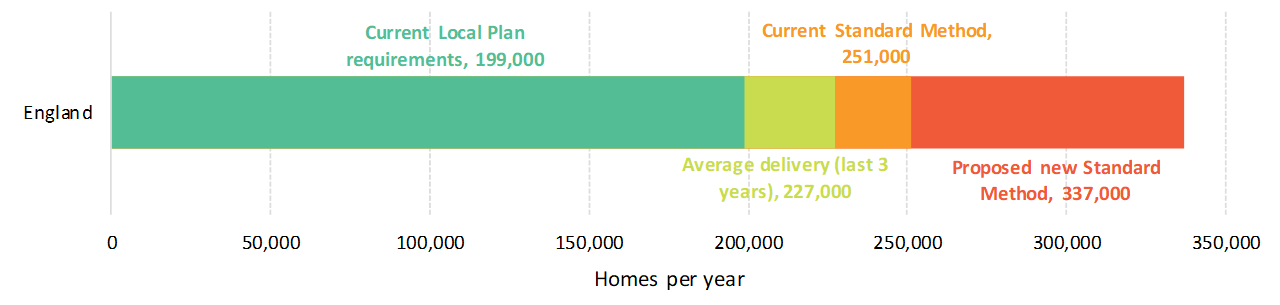
This new method is clearly meant to induce a step-change in delivery (indeed it needs to); it’s around 140,000 more homes per year than planned for existing local plans and around 100,000 homes homes than were delivered last year (Figure 2). All this suggests there could still be land needed for around 4 million homes required by 2040*, but this assumes the method remains in place for the foreseeable future (and we already know that may not be the case due to White Paper proposals). But what can we actually expect to see, on the ground?
Figure 2 – National totals – Current Local Plan requirements, recent delivery, current standard method and proposed standard method. Source: Lichfields analysis/MHCLG. Current Standard Method figure calculated as of August 2020 – this is lower than the 270,000 figure yielded when the current method was initially published for consultation in September 2017 due to changes in the underlying data
London calling….for yet more housing
It cannot be ignored that London’s needs – at over 93,000 – account for almost a third of the national figure. This alone tells us that the 337,000 won’t be delivered, because London will fall short by at least around 50,000 homes per year (and that’s assuming it can sustain the recent peak in delivery of 40,000). Without the duty to co-operate to redistribute this need across the wider south east, this shortfall certainly won’t be picked up elsewhere. Read more about our thoughts on the implications for London in
Harry Bennett’s blog.
We do like to be beside the seaside… (and the Green Belt, the AONB, the SSSI and the national park)
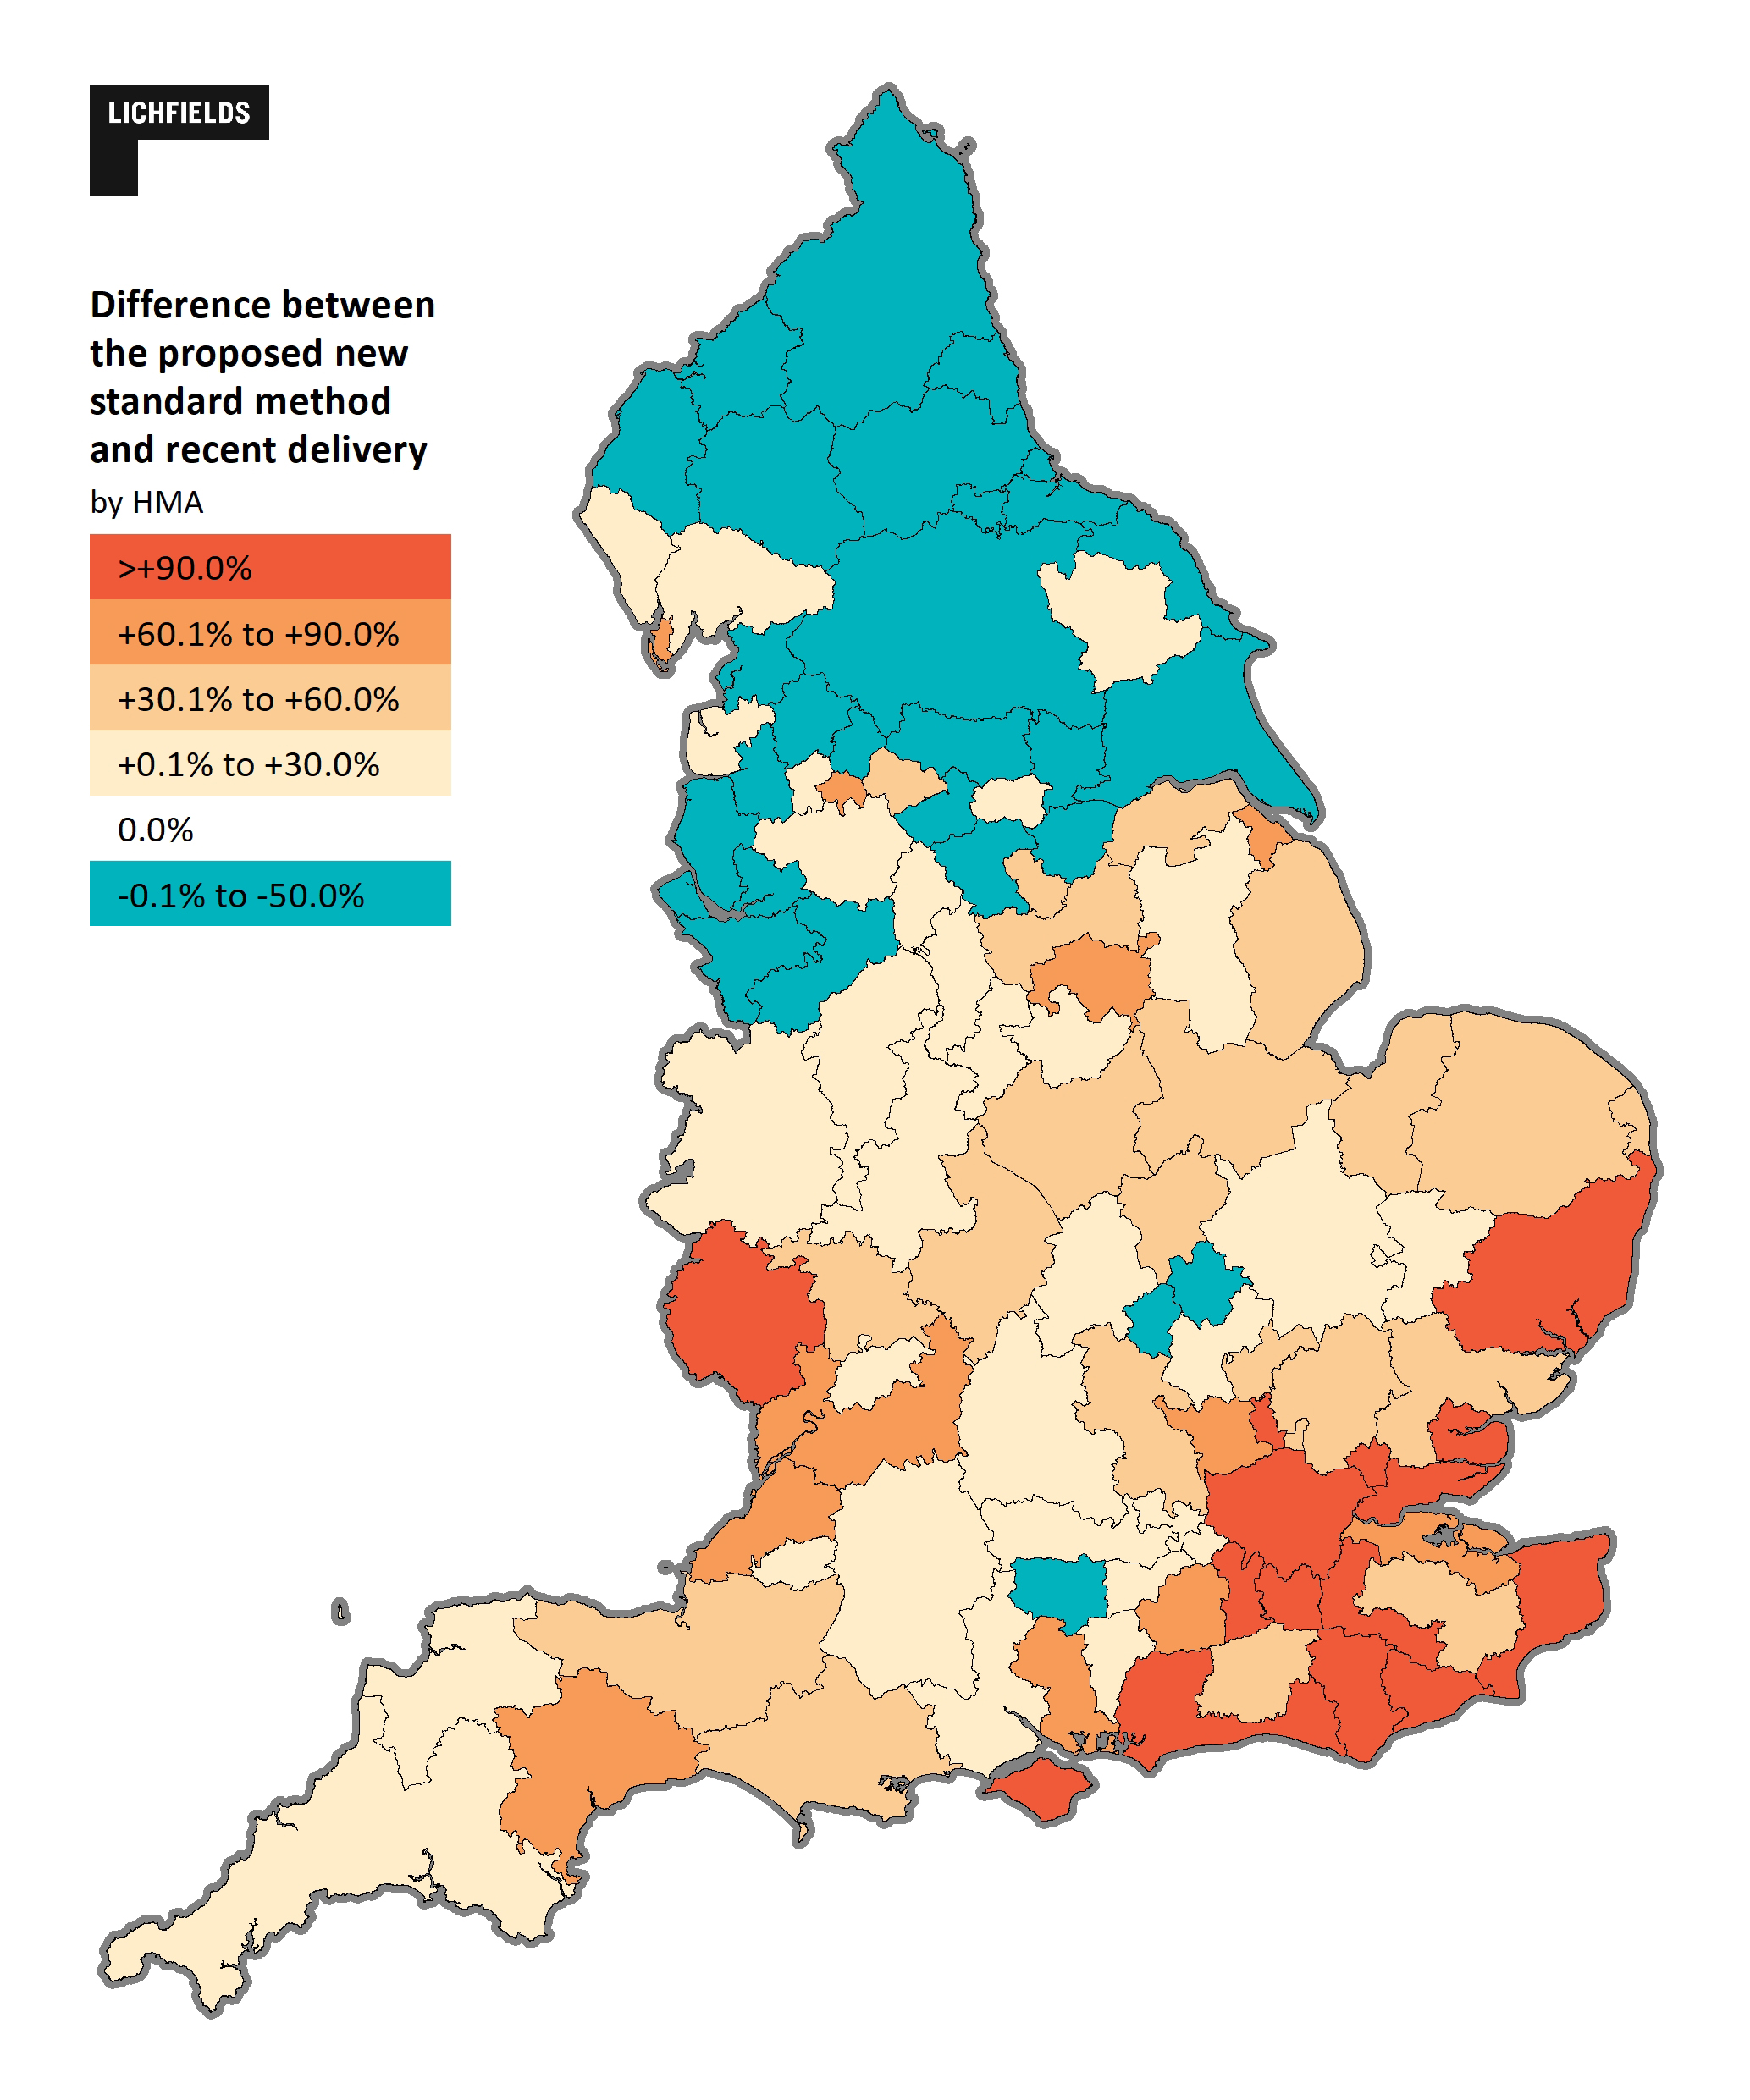
The even greater emphasis on affordability has inevitably led to the greatest impact in the wider south east (in terms of the proportional difference between the new method and recent delivery rates, as shown in Figure 3). Many parts of the home counties would need to see the biggest step-change in housing delivery (shown in Table 1). But in many cases, these are highly constrained areas, be that in relation to the sea, Green Belt, flooding, environmental or heritage designations or a combination, for example Coastal West Sussex, Surrey and South Essex. With these scales of change needed in areas of such high constraint, coupled with commitments from Government to continue protecting such areas, further questions are raised in relation to whether 300,000 will be delivered. The message from Government remains a clear though – poor and worsening affordability = greatest need for housing.
Table 1 – Top 10 increases by housing market area between proposed new method and recent delivery. Source: Lichfields analysis
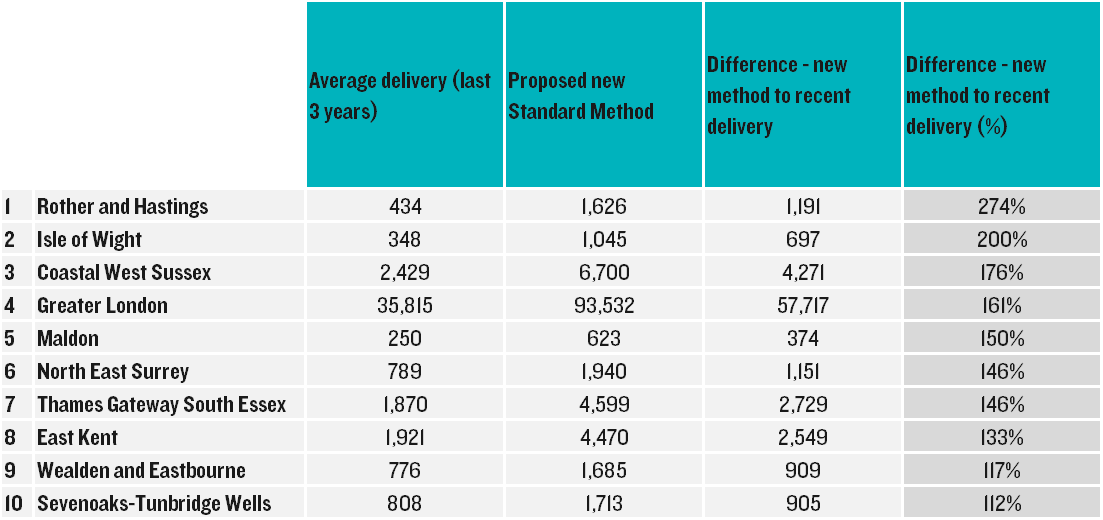
Figure 3 – Difference between proposed new standard method and recent delivery (%) by housing market area. Source: Lichfields analysis. Recent delivery refers to 3 year average up to 2018/19 from MHCLG Live Table 125
Moving on up… to higher numbers in the midlands and north
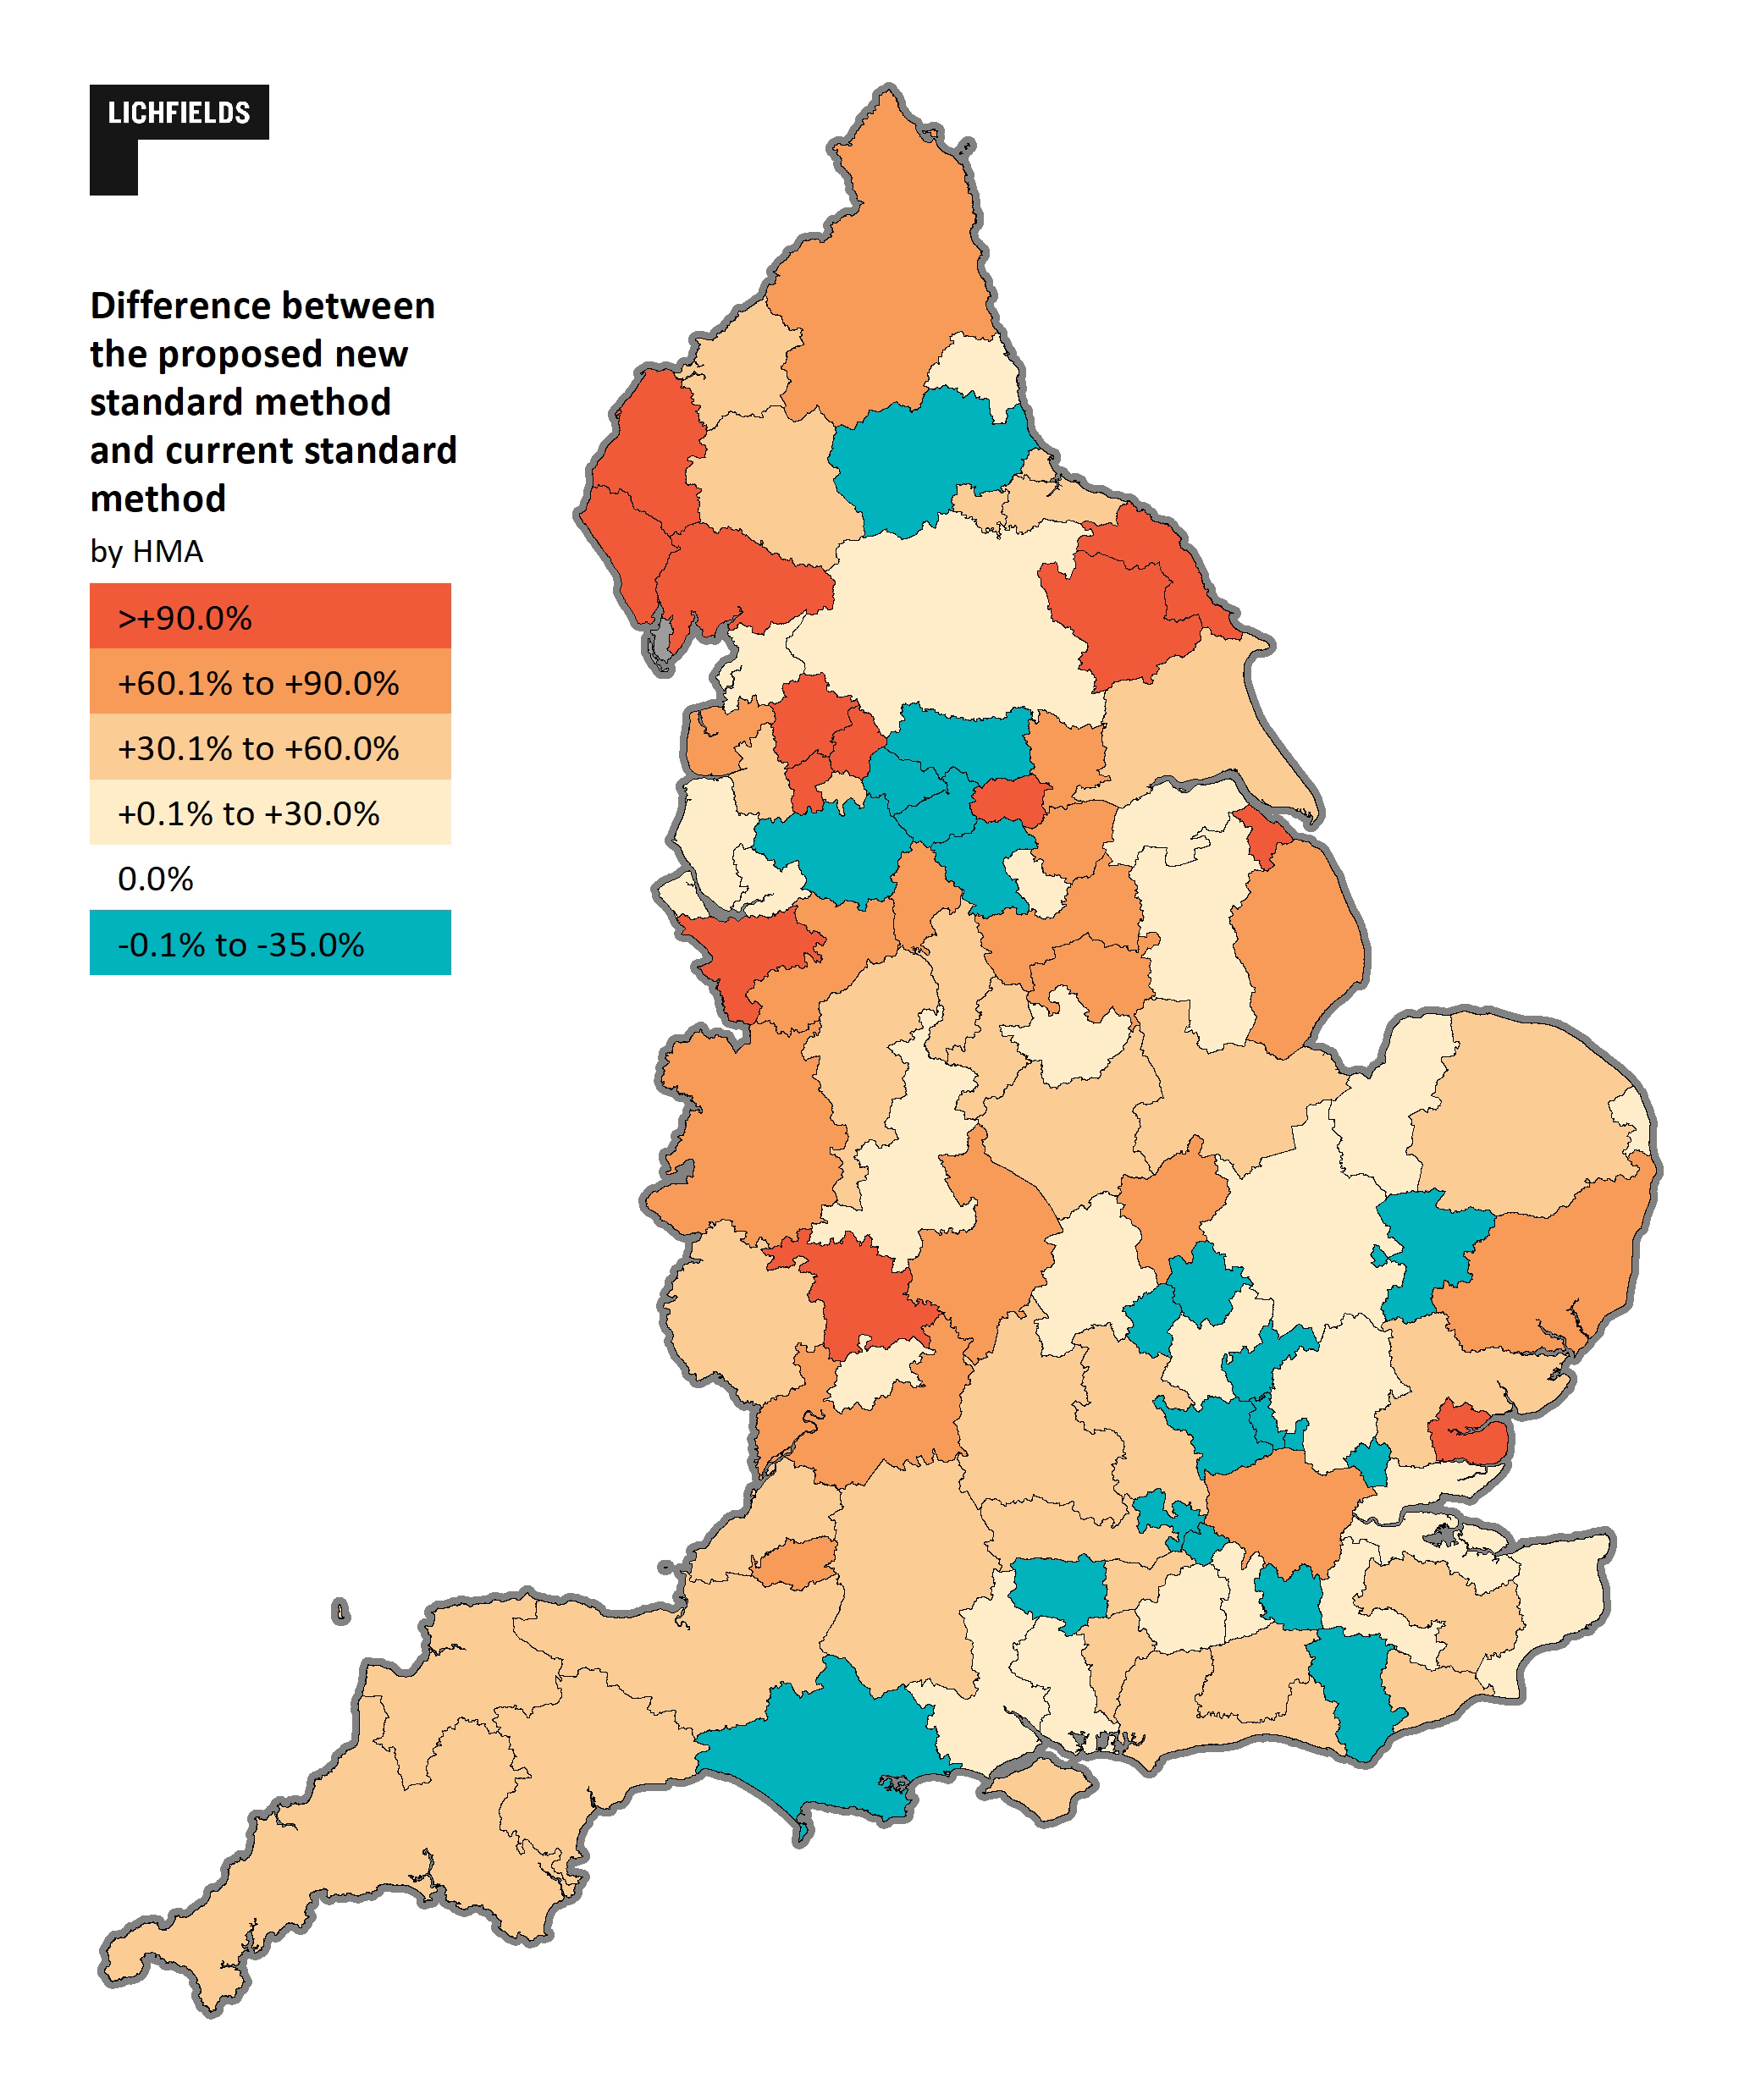
With its reliance on projections and affordability, the current method resulted in a strange and undesirable situation across the midlands and north, suggesting that in the future many parts of those regions needed to deliver fewer homes than had actually been built in recent years. Although the new method does not completely resolve this issue (as evident from Figure 3 above), it does take a step in the right direction. In the North East, North West and Yorkshire, the proposed method yields a higher number than the current method across many areas. In the East and West Midlands though, the proposed method is higher than the current method and is a boost on recent delivery levels across virtually all areas, as shown in Figure 4.
Figure 4 – Difference between proposed new standard method and current standard method (%) by housing market area. Source: Lichfields analysis. Current standard method figure calculated as of August 2020
The third (and final?) step
As I’ve already said, the introduction of the current standard method was a step in the right direction, helping shift debate away from number and on to how needs are addressed. The new method? It looks set to be another – potentially bigger – step in the right direction, creating an ambition somewhat more in line with the overall objective to build 300,000 homes a year. The message from Government is clear; it expects many areas to be faced with difficult decisions on how to significantly increase their housing delivery. Yet at the same time, there remains the perenial tension between the objective of really boosting housing supply and the physical, environmental, policy, fiscal and political barriers which lie in the way of doing so.
But not for long. Because just as quickly as Government proposed this new method, it is laying the groundwork for a third (and hopefully final?) approach to housing numbers. Proposal 4 of the White Paper proposes a futher new standard method which distributes the national target of 300,000 homes, taking into account both need and constraints, removing the need for authorities to debate whether they can meet their need at all. In effect, it will do the balancing exercise to apply the ‘policy off’ estimate of need and review of constraints to arrive at the ‘policy on’ requirement That balancing exercise is the one that vexed regional planning, it has vexed localism, and now Government proposes a standard method to resolve it all nationally. All this of course creates more questions; not least around the practicalities of how this would even be calculated; but there is a feeling of coming full circle, away from true localism’ and back to the ‘top-down’ approach vilified just 10 years ago…
Find out what the proposed method yields for individual local authorities and housing market areas, including how this compares with current plan requirements and recent housing delivery,
here. Follow our blog for upcoming updates on what the consultation means for local regions across the country.
For implications of what the New Standard Method means for other regions, see below perspectives:
*For the period 2025-2040, assuming 5 years of current plan requirements (for the period 2025-30, yielding roughly 1m homes) and 15 years’ worth of need based on the proposed standard method (yielding 5m homes). Does not take account of increases in delivery due to stepped trajectory or backlog, thus true number may be lower.