In planning, the use of workplace-based affordability ratios [ARs] in the standard method for assessing local housing needs has meant that the publication of new ratios each April has garnered considerable attention. With fast house price growth and near flat wages, average house prices nationally are now 9.1 times earnings; up from 7.9 last year and higher than any historical level.
Our table here provides an overview of the new local housing need [LHN] figures by local authority across England. The question of whether these new affordability ratios - and any increase in housing need they may yield - have any real impact ‘on the ground’ depends on a number of other factors, which may limit their effectiveness form a planning perspective in many areas.
However, with plans needing to look over at least a 15-year horizon, even relatively small increases in housing need can create significant increases in overall plan requirements, putting authorities which are preparing new plans under pressure to find additional housing sites.
This is the second of
two blogs which examines the implications of the newly released AR on the standard methodology [SM2] for calculating housing need. The first examines those districts in the south of England where the substantial changes in affordability over the past year are likely to have the greatest impact from a planning perspective. It particularly focuses on those districts where the local plan is more than five years old (or soon will be), where the SM2 yields a greater housing need annually than the current plan requirement and where housing need has increased by more than 5% as a result of the new ARs.
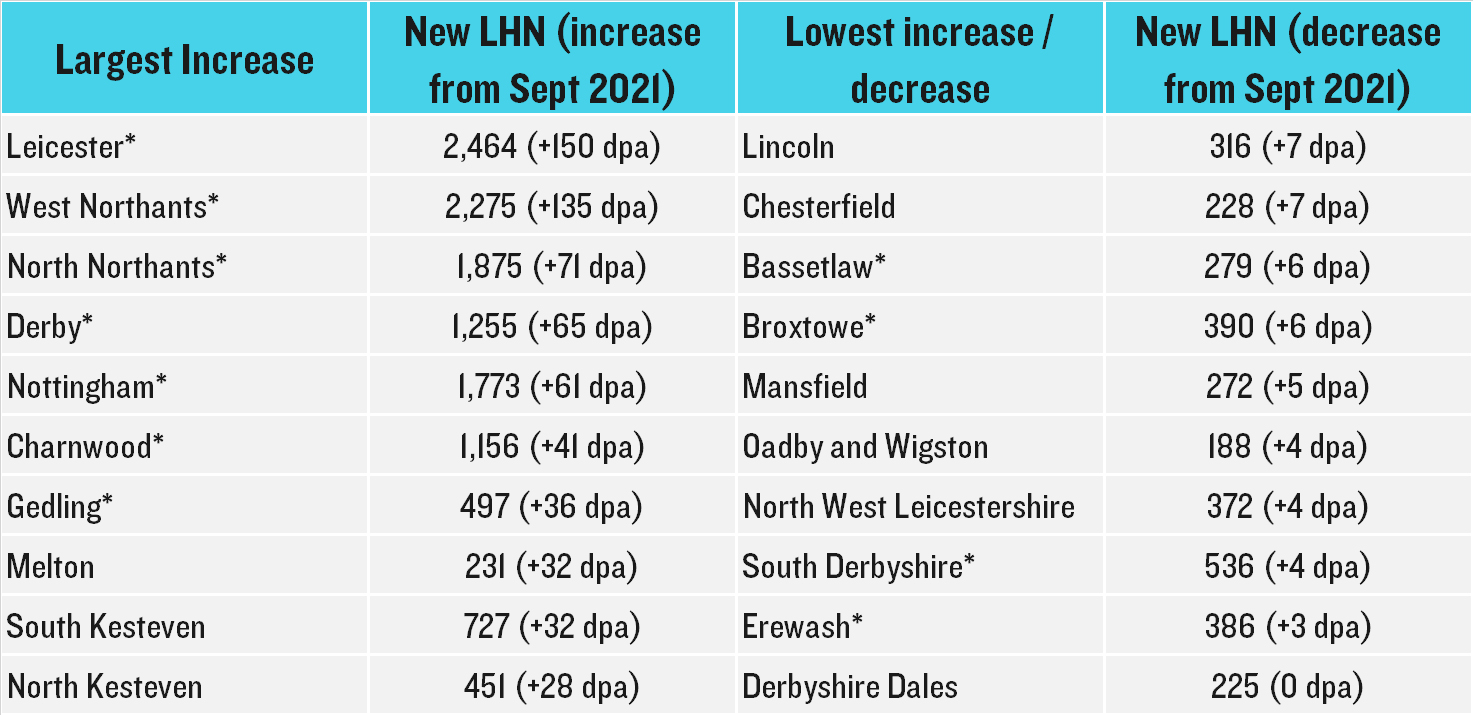
This second blog turns to the likely implications of the new AR figures on the SM2 calculations for authorities across the north of England and the Midlands, and what the new Local Housing Need [LHN] figures could mean from a plan-making perspective. Starting with the East Midlands, it is notable that all but 1 of the 36 districts have an increase in their LHN based on the latest March 2022 AR data. Collectively, there is an increase of 958 dwellings per annum [dpa] as a result of applying a revised median workplace-based affordability ratio.
As can be seen in the Table below, the largest increase is for Leicester City, with its LHN increasing from 2,314 dpa to 2,464 dpa (an increase of 150 dpa, or 6%). This is particularly notable given that Leicester’s Plan is over 11 years old so it should have an immediate impact. Its AR has increased from 6.37 to 7.57 in a year (due to workplace-based earnings declining by 3%, whilst house prices increased by 15.4% - one of the highest rates of increase in the whole of the East Midlands).
This is followed by West Northamptonshire, a new Unitary Authority comprising the former districts of Daventry, Northampton and South Northamptonshire, which has an increase of 135 dpa, followed by North Northamptonshire with an increase of 71 dpa.
Also of interest is Melton, which has a very high proportionate increase of +14% on its 2021 LHN figure, to 231 dpa. This is entirely due to an extremely high AR of 12.27 which is the highest in northern England and the Midlands, and which represents a huge increase of 3.4 points from the 2020 position (an uplift of 38%). Reference to the Office for National Statistics [ONS’s] base calculation indicates that this leap is a combination of a 19.1% increase in median house prices over the past year to £262,000, combined with what is apparently the sharpest fall in median earnings across the whole of England (from £24,793 in 2020 to £21,358 in 2021 – a fall of 13.9%). It is also interesting to note that seven of the top ten East Midlands districts have a Local Plan over five years of age.
East Midlands

*Plan close to (or over) 5 years old
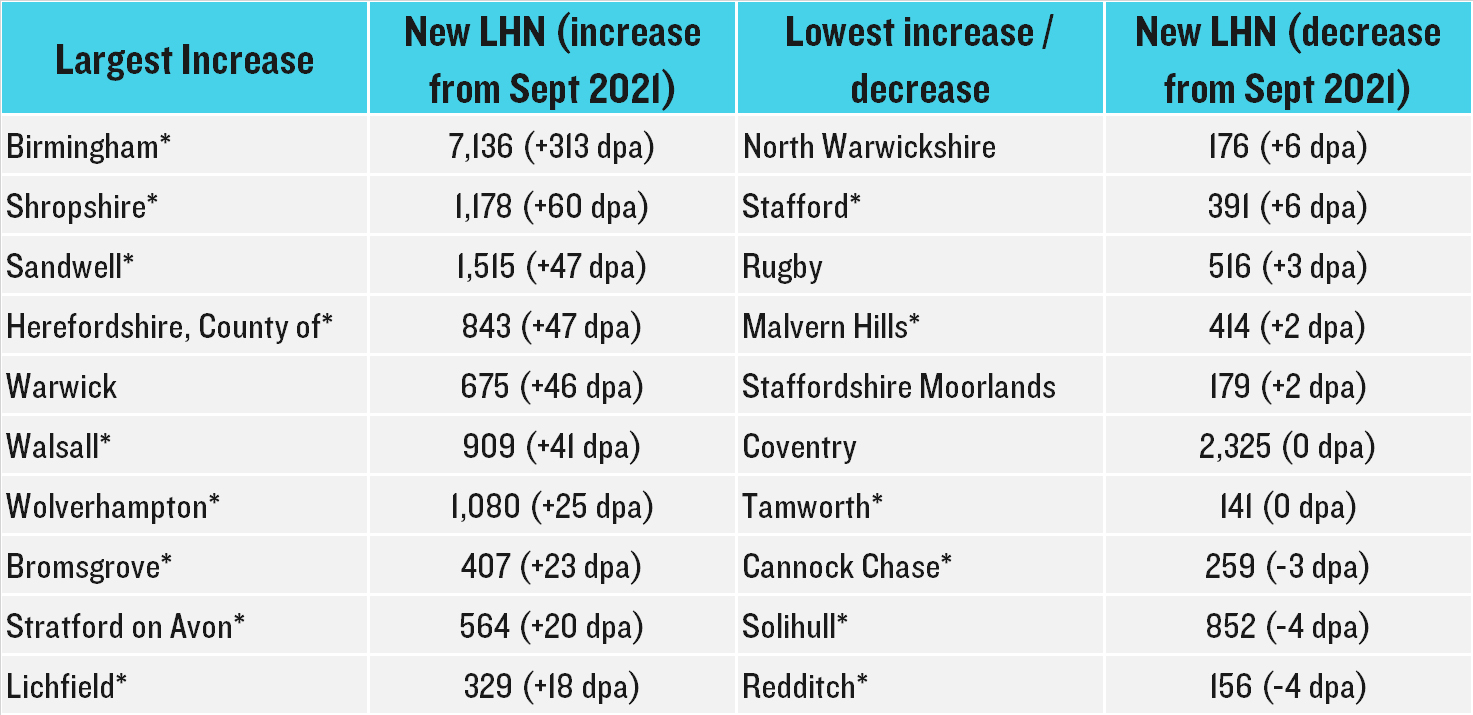
Moving on to the West Midlands, by far the most striking figure relates to the City of Birmingham, which now has an LHN of 7,136 dpa, an increase of 313 dpa (+4%) on the 2020 AR-generated figure of 6,823 dpa. However, this somewhat masks the point that up until the 10th of January this year the figure was ‘just’ 4,829 dpa. The reason for this huge change is down to the fact that the City’s Local Plan was adopted on 10th January 2017 and hence it is only very recently over 5 years old. This time last year, the LHN was capped at 40% of the Local Plan target of 2,555 dpa, i.e. 3,577 dpa, plus the 35% urban uplift (bringing the LHN to 4,829 dpa). Now that the Local Plan is over 5 years old, that cap no longer applies. As a result, the annual household growth figure of 4,574 (2022-32) has an AR uplift of 15.7% applied, plus the 35% urban uplift taking us to 7,136 dpa. Given that the Council has long struggled to accommodate lower housing numbers in the City and has relied on the Duty to Cooperate [DtC] to redistribute much of that need elsewhere, this is likely to have profound implications for the West Midlands Metropolitan area and beyond going forward.
Nine of the top ten West Midlands districts have a Local Plan that is over five years of age although some (such as Shropshire) have an advanced emerging draft Local Plan that has already been submitted to the Secretary of State [SoS] for Examination.
Regarding the lowest increase/decrease, Redditch has a revised LHN that is 4 dpa lower than before, which represents a 3% fall, followed by Solihull and Cannock Chase which also have a slightly lower figure than previous LHNs using the 2020 AR.
West Midlands

*Plan close to (or over) 5 years old
As for the North East region, the LHN for its 12 districts has changed little due to the 2021 AR, with only Newcastle upon Tyne seeing a change of more than 20 dpa. The City now has an LHN of 1,451 dpa compared to 1,423 dpa using the 2020 AR, an increase of 28 dpa or 2%. This is due to the 2021 AR increasing to 5.9, from 5.52 in 2020.
Unlike much of the rest of the north and midlands, the impact of the LHN changes (modest though they are) may have a very limited impact across most of the region as 10 of the 12 local authorities have up-to-date Local Plans that are less than five years old. Only Middlesbrough (with a Plan that was adopted in November 2014) and South Tyneside (with a Plan last adopted in 2007) may be concerned about the likely impacts of these changes in LHN. South Tyneside Council is working towards a new draft Regulation 18 pre-publication Local Plan following public consultation in 2019 and a review of Spatial Options. Middlesbrough is further behind in its Local Plan preparation. The new LHN figures will therefore be a key consideration for both areas as a result, although the change is relatively modest (+15 dpa to 333 dpa for South Tyneside, which is close to its current 325 dpa Local Plan requirement, and +2 dpa to 262 dpa for Middlesbrough, well below its current Local Plan housing target of 410 dpa).
North East

*Plan close to (or over) 5 years old
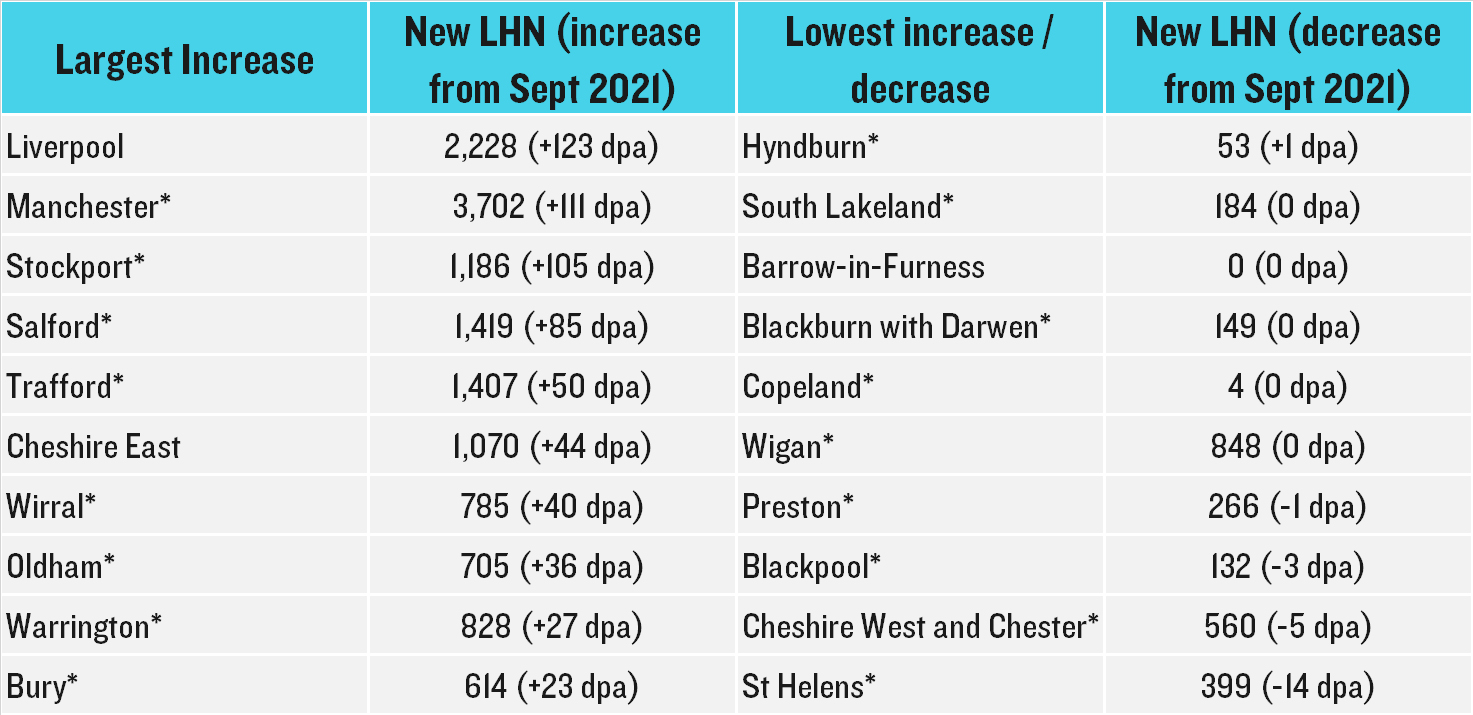
Regarding the North West, some of the largest urban areas of the region (perhaps unsurprisingly) have the most substantial increases in LHN in the most recent iteration of the calculation. The cities of Liverpool and Manchester have the highest numerical increases of 123 dpa and 111 dpa respectively. Manchester City for example, sees its AR ratio increasing from 5.91 to 6.67. Liverpool’s level of AR increase is even greater, from 4.06 to 5.05. However, neither is likely to be adversely impacted by the increase in LHN in the short to medium term at least. Liverpool City Council adopted its Local Plan in January of this year with a housing target of 1,739 dpa (well below its 2,228 dpa 2022 LHN figure), whilst the Greater Manchester Combined Authority [GMCA] recently submitted its Places for Everyone [PfE] Plan to the SoS for Examination. This is a long-term plan for nine of the ten Greater Manchester districts (Bolton, Bury, Manchester, Oldham, Rochdale, Salford, Tameside, Trafford and Wigan [GM9] but not Stockport) for jobs, new homes, and sustainable growth and identified a housing target of 10,305 dpa overall of which 3,533 dpa was identified for Manchester City – below the revised 2022 LHN of 3,702 dpa.
The PPG recognises that the housing need figure generated by SM2 may change as the inputs are variable and this should be taken into consideration by strategic policy-making authorities. However, LHN calculated using SM2 may be relied upon for a period of two years from the time that a plan is submitted to the Planning Inspectorate for examination
[2]. This means that the GM9 districts (including Salford, Oldham, Trafford and Bury which also have some of the highest increases in the region) may argue that they do not need to revisit their housing targets despite the overall GM9 figure seeing a cumulative LHN of 10,658 dpa, up from 10,313 dpa based on the 2021 AR.
One district which is likely to be significantly affected by the 2022 LHN adjustment is Stockport. Stockport Council withdrew from the Greater Manchester Spatial Framework [GMSF] in December 2020, which prevented the strategic development plan from proceeding to Regulation 19 Publication stage and instead work was undertaken to prepare PfE with the other GM9 districts. Stockport Council’s stated reason for leaving the process related to concerns around infrastructure provision, housing need and the significant proposed loss of Green Belt. In a letter to Stockport Councillors ahead of the decision, Greater Manchester mayor Andy Burnham wrote that: “
the GMSF allows the 10 Greater Manchester boroughs to share out the numbers of homes that each individual borough needs to build. As a result, the GMSF allows Stockport to cut the number of planned homes by over 5,000 – 25% less than its Government target…Conversely, if Stockport was to opt out of the GMSF, it would have to find land for all these 5,000 homes”[3].
At the time, the GMSF housing target identified for Stockport Borough was just 793 dpa, with much of its 1,079 dpa LHN redistributed to other districts across the conurbation. It is interesting to note therefore that the latest 2022 LHN for Stockport is now 1,186 dpa, a 50% increase on the GMSF target and a 9% increase on the previous LHN figure of 1,081 dpa (based on the 2020 AR). This has been driven by a very substantial increase in Stockport’s AR, from 8.02 to 10.01 (itself a function of soaring house prices, which increased by 17% between 2020 and 2021, and falling workplace-based earnings). We await with considerable interest to see how the Council will find sufficient land to meet this higher LHN in full within its boundaries.
Cheshire West and Chester, Blackpool, Preston and St Helens all see modest declines in their LHN figures under the new 2021 AR calculation, which will be of particular note to Planning Officers in those districts given that all four have Local Plans that are over 5 years old (notwithstanding the GM caveat for Wigan mentioned above).
North West

*Plan close to (or over) 5 years old
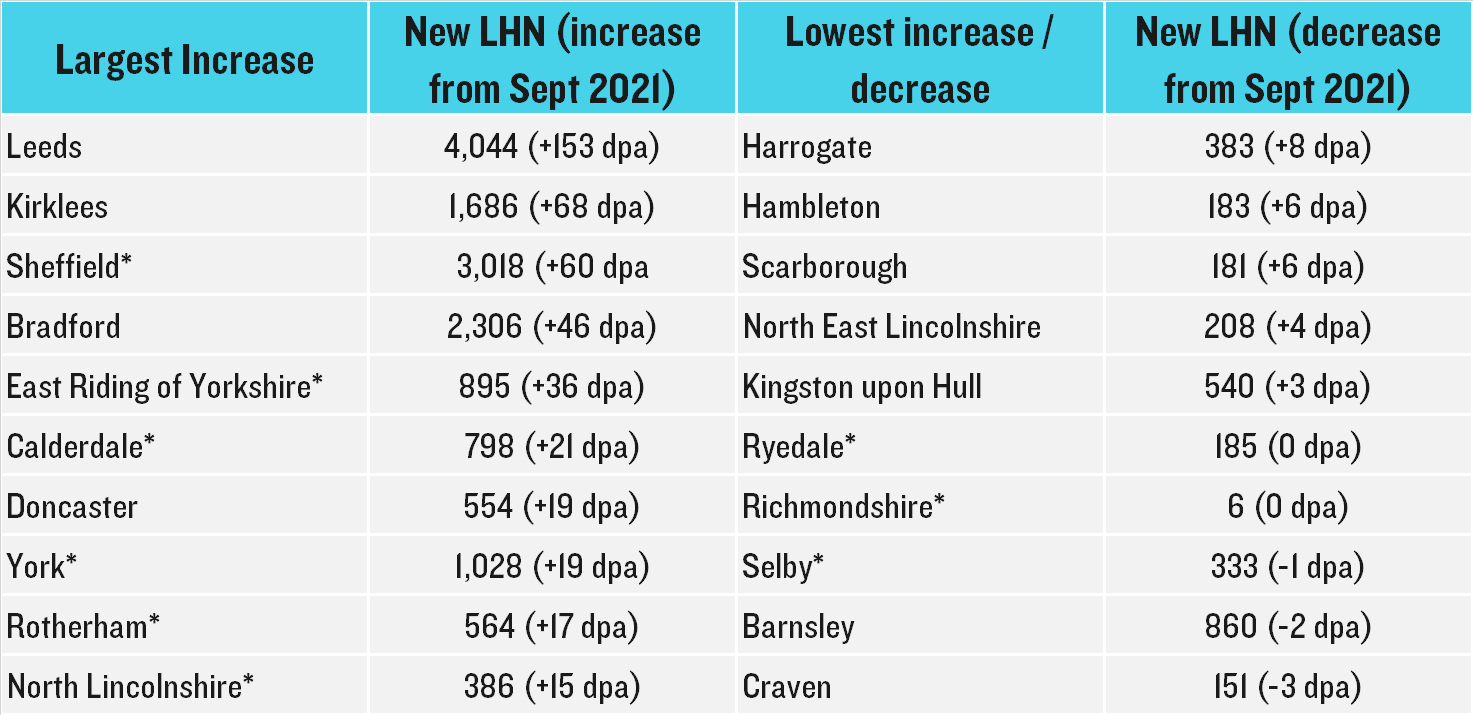
Finally, for Yorkshire and The Humber, by far the largest increase in LHN (both in absolute and percentage terms) is for Leeds City, which has an increase of 153 dpa (or +4%) to 4,044 dpa. This is driven by a strong growth in its AR, from 6.34 to 7.08, although the Local Plan was only adopted in September 2019. It is still important to note that the Local Plan housing requirement of 3,247 is around 20% below the baseline starting point LHN. Sheffield is in a more difficult position given that it has a Local Plan that is over 13 years old and has an LHN that has increased by 68 dpa to 3,018 dpa, 223% higher than the current Local Plan housing requirement figure of 1,352 dpa.
Most of the remaining districts in Yorkshire and the Humber’s top ten either have an adopted Plan (i.e. Doncaster) or have a Local Plan that is currently at Examination (Calderdale and York), albeit York’s new LHN is significantly higher than the requirement the Council currently believes is justified.
As for those Yorkshire and the Humber districts with the lowest rate of change based on the 2021 AR, it is notable that with the exception of Barnsley, these are either predominantly rural or coastal/estuary districts, with weaker household growth tending to counteract the often very high AR issues the more affluent parts of North Yorkshire in particular face.
Yorkshire and The Humber

*Plan close to (or over) 5 years old
Concluding thoughts
With affordability in 2021 worsening at a faster rate than any year in the last two decades, and with it forming an integral part of the current standard method for assessing LHN, one might initially expect it to have a direct impact on many areas. However, when we look in more detail at the areas which might be affected, it is far from clear that there will be any immediate, or even long-term, consequences for those districts which have an up-to-date plan.
That said, it is clear that for many local authorities that are reviewing their Local Plan in the north of England and the Midlands in particular, the generally higher figures generated by the rapidly rising AR (which counters often declining household growth over the longer term) could have significant consequences. This is particularly so when combined with other factors, such as the end of a cap to an extant Local Plan requirement (Birmingham) or the need to meet LHN in full without having the ability to redistribute unmet need across a wider HMA (Stockport).
Whether this has the effect of further delays to the Plan-making system, or whether it encourages the Department for Levelling Up, Housing and Communities [DLUHC] to bring out a new SM3 that is less reliant on AR sooner rather than later, remains to be seen.
[1] ONS (2022): Ratio of house price to workplace-based earnings
[2] PPG ID: 2a-008-20190220
[3] https://www.placenorthwest.co.uk/news/gmsf-burnham-begs-stockport-tories-to-accept-plans/


