Much has been made of the latest affordability ratios published by ONS recently, with the ratio of house prices to local earnings up by as much as 25% or more in the last year alone across some parts of the country. With fast house price growth and near flat wages, average house prices nationally are now 9.1 times earnings; up from 7.9 last year and higher than any historical level.
In planning, the use of affordability ratios in the standard method for assessing local housing needs has meant that the publication of new affordability ratios each year in April has garnered attention (our
tables here provide an overview of the new local housing need figures by local authority). But the question of whether these new affordability ratios - and any increase in housing need they may yield - have any real impact ‘on the ground’ depends on a number of other factors, including:
- How old is the current local plan in the district? If less than five years old, the plan requirement will continue to be the basis for assessing five year land supply, so any increase in the housing need figure (due to an increase in the affordability ratio) will not have an effect. By the time a local plan review is needed, the data for assessing local housing need (household projections and affordability) may have changed again;
- Does the standard method yield more homes than the current plan requirement? If not, authorities are likely to be planning for more homes than the standard method suggests already, and any increase in housing need due to affordability ratios is unlikely to put any significant pressure on housing supply;
- To what degree has the updated affordability ratios increased the standard method figure? If only minor, authorities are likely to have a sufficient buffer – at least 5% - in their housing land supply to respond to this; and
- In the places that were already the least affordable, whether the ratio simply increases the level of need above the 40% uplift cap and thus has no impact on the minimum number of homes needed. Our analysis has found 64 authorities (one-fifth) where affordability worsened but where the local housing need figure was shielded to some degree by the uplift cap.
In this context, whilst many areas may have seen substantial changes to affordability over the last year, there may be limited to no effect from a planning perspective in many areas. We have therefore looked at authority areas where the local plan is more than five years old (or soon will be), where the standard method yields a greater housing need annually than the current plan requirement and where housing need has increased by more than 5% as a result of the new affordability ratios. This is the first of two blogs, and explores the authorities in the south of England which may be affected; a second blog looks at the potential impacts across the midlands and north.
Plan-making
With plans needing to look over at least a 15-year horizon, even relatively small increases in housing need can create significant increases in overall plan requirements, putting authorities which are preparing new plans under pressure to find additional housing sites.
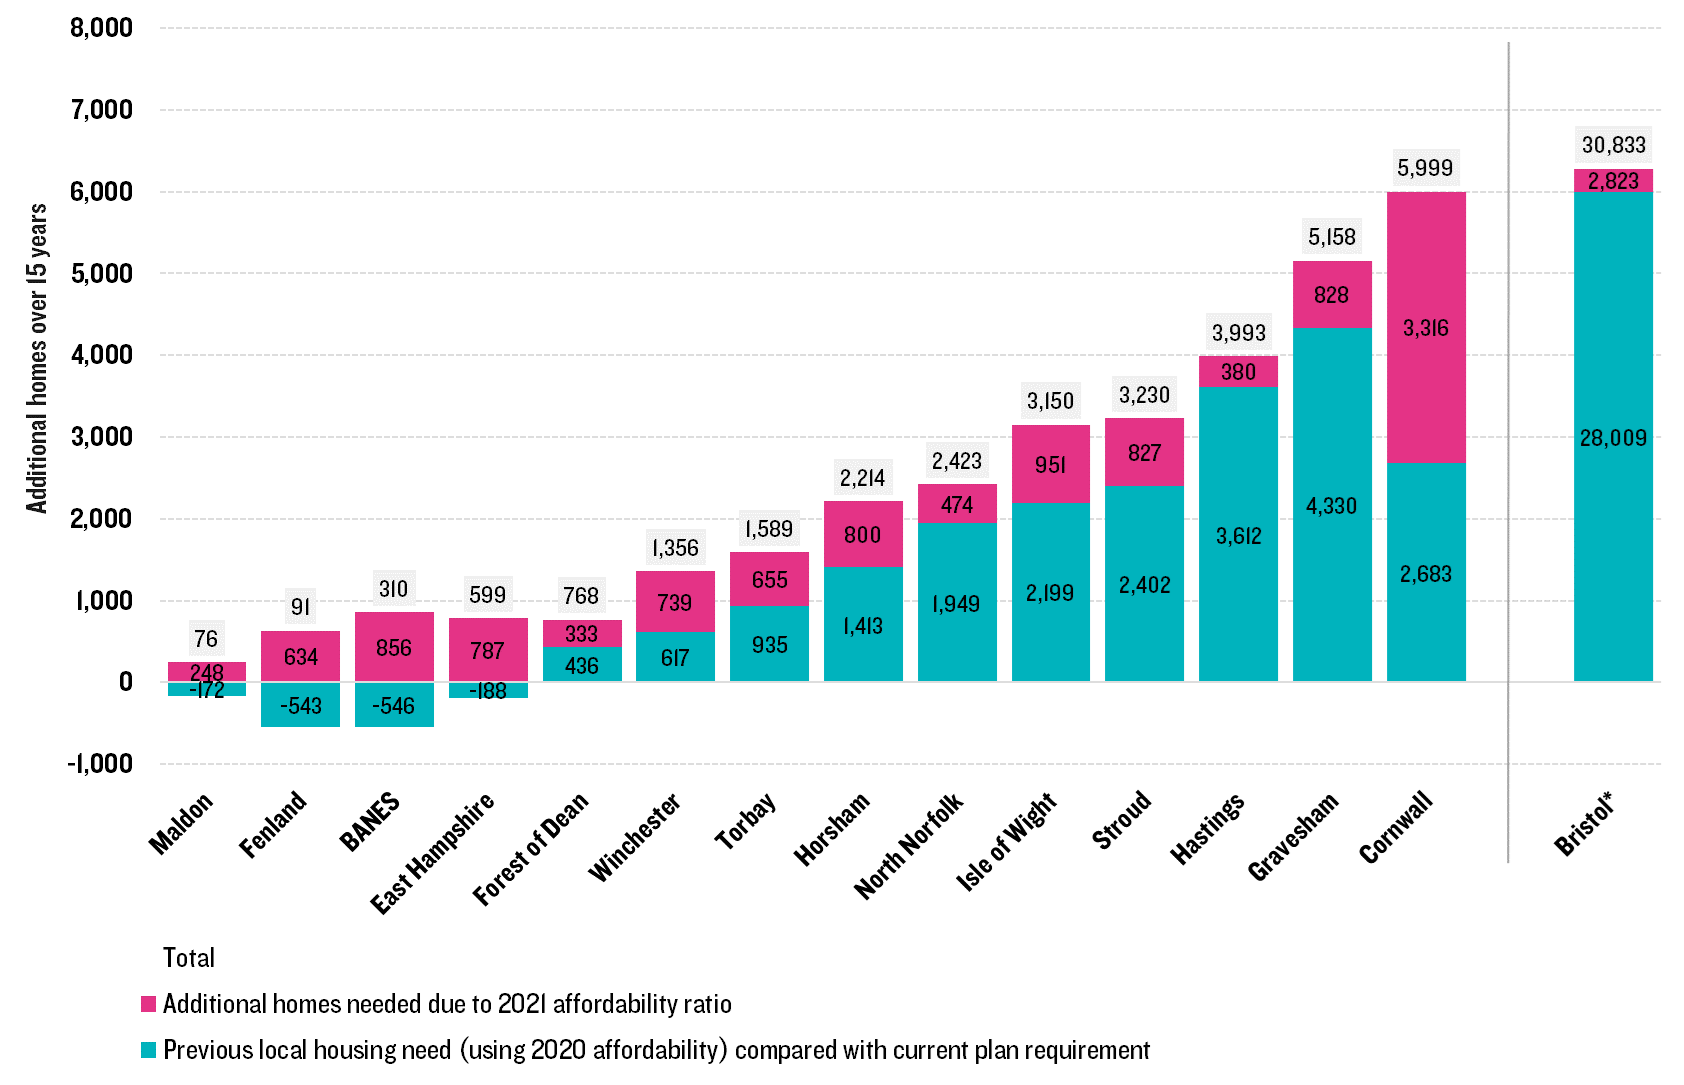
Almost all of the authorities in our analysis were already facing an increase in plan requirements before the new affordability ratios were published (shown in blue in Figure 1), for example with Horsham needing to find an additional c.1,400 homes over 15 years compared with its current plan requirement. But worsening affordability in these areas has led to even more pressure – for example, in the case of Horsham, the updated affordability ratios equate to a further 800 homes over a 15 year period (2,200 in total, over and above its current plan requirement).
Cornwall has seen the greatest absolute increase; already needing to find c.2,700 homes over 15 years compared with its current plan requirement, with the new affordability ratios it needs to find a further c.3,300 homes – so nearly 6,000 in total.
Of course, there is speculation that the current standard method will be revised or replaced entirely in the near future
[1], which has seen many authorities nationally – including some of those shown in Figure 1 - pause plan-making whilst they await more certainty on the amount of housing for which they will be asked to plan. Increases in local housing need due to the new affordability ratios is likely to further delay the preparation of new plans in these areas especially, simply because there is now a political expectation that a new approach for assessing local housing need could reduce numbers in these areas (alongside a change in how need is addressed in plan making).
Figure 1 Additional homes needed over 15 years as a result of changes to local housing need.
Source: Lichfields analysis of ONS. *Bristol not shown to scale
Decision-taking
Changes to the standard method can have a more immediate impact in authorities where local plans are more than five years old because it forms the basis for assessing five-year land supply. Relatively unconstrained areas which previously had a position only just above five years might now find themselves below – and therefore subject to the presumption in favour of sustainable development - in light of their increased housing need.
But looking at where these authorities already stood in terms of housing land supply, shows that there are only a few authorities where the increases to local housing need will tip them over.
Of the 15 authorities shown in Figure 1:
-
Four – Gravesham, Bristol, Hastings and Bath & North East Somerset - are almost entirely land constrained. Any change to the housing land supply position as a result of changes to local housing need is unlikely to have any effect on decision-taking because the presumption in favour of sustainable development would not apply in most parts of these areas anyway, as per NPPF11(d)(i);
-
Four – Stroud, Winchester, Cornwall and Fenland – currently have a comfortable surplus (6+ years) based on their latest published five-year land supply. Whilst increases in local housing need, due to the new affordability ratios, may slightly worsen the position it’s unlikely to drop below the 5 years which would trigger th presumption in favour of sustainable development;
-
Two – Isle of Wight and Forest of Dean – currently do not have a recently published five-year land supply position. Were one to assume they therefore do not have a five-year land supply – and therefore the presumption is already triggered - increases in local housing need would only worsen this position;
-
Three – Torbay, Maldon and Horsham – currently report positions already well below five years. Again, whilst increases to local housing need may worsen the position, the presumption was already engaged; and
-
Two – East Hampshire and North Norfolk – had recently reported positions which were somewhere between 5 and 6 years. It is possible that in these areas, increases in local housing need, as a result of the recently published affordability ratios, could result in the position tipping from above 5 years to below 5 years, potentially triggering the presumption in favour of sustainable development for the purposes of decision-taking. Of course, this will not be known until these authorities undertake a full update, but from an initial review these two areas appear to be most ‘at risk’ from a real change in their five year land supply position as a result of increases in local housing need.
Concluding thoughts
With affordability in 2021 worsening at a faster rate than any year in the last two decades, and with it forming an integral part of the current standard method for assessing local housing need, one might initially expect it to have a direct impact on many areas. However, when we look in more detail at the areas which might be affected, it is far from clear that there will be any immediate, or even long-term, consequences:
Whilst increases in local housing need could add hundreds – or potentially thousands – to plan requirements in some areas, there is already widespread evidence, especially across the south of England, of plan-making being paused in anticipation of a revised or entirely new approach to housing need and how it is addressed. Where Councils expect their local housing need to reduce due to this reform, it is unlikely they will progress plans on the basis of these higher numbers;
- Many authorities already cannot demonstrate a five year housing land supply, thus the presumption is already engaged in those authorities, before the new affordability ratios were published. Increases to housing need may worsen this, but are unlikely to fundamentally change the position (from one of above to below five years). Some authorities are able to report a comfortable surplus with enough of a buffer to balance this increase in local housing need; and
- On published data, there are only two potential areas where the currently five year land supply position is more marginal, and where increases to local housing need may tip the position from one of surplus to shortfall – East Hampshire and North Norfolk.
[1] See this Planning Magazine article here (£)