ONS’s latest population projections represent the fifth set of projections published since the 2014-based projections (which currently underpin the standard method for assessing housing need) were produced in 2016. After a progressively declining picture of population growth nationally, these latest figures suggest a return to higher levels of population growth anticipated in the 2014-based projections. In this blog, we look at how projections have influenced planning for housing in the last decade, what these latest projections are showing (and why), and what they could mean for housing need and plan-making more widely.
How did we get here?
For those professionals involved in planning for housing, the last decade has been somewhat of a rollercoaster. With ONS producing population projections on a two-yearly basis (although this has been even more frequently, in recent years) and with DLUHC (and subsequently ONS) producing accompanying household projections on a similar – but slightly delayed – cycle, planners had been on a continuous hamster wheel in attempting to ensure that housing needs assessment and local plan requirements are based on up-to-date evidence. Of course, the cycle of plan-making moves at a much slower pace than projections are updated, which has led to assessments of housing need being updating repeatedly during the plan-making process, or even in some cases, becoming out-of-date almost immediately upon adoption.
The introduction of the ‘standard method’ for assessing local housing need in 2018 was in direct response to recommendations of the Local Plan Expert Group (LPEG) which noted that debates around housing need were often the most time consuming and costly element of the local plan examination process, and recommended a more simplified, transparent and standardised approach to this. The ‘standard method’ is a simple formula which is based on the 2014-based household projections, plus a percentage uplift for affordability; the worse the affordability ratio is, the greater the uplift.
Just months after it was introduced however, ONS published updated household projections (2016-based) which suggested much lower household growth nationally, leading to debate around the suitability of the 2014-based projections for assessing housing need, particularly by local authorities. In response, in October 2018 Government consulted on whether the standard method should continue to rely on the 2014-based projections, ultimately concluding for a variety of reasons that it should. Importantly, the 2014-based projections were broadly consistent with achieving the target of 300,000 homes a year by the mid-2020s.
Subsequent household projections (2018-based) have continued to suggest lower growth more in line with the 2016-based figures, although there were no changes to national guidance which has continued to direct authorities to continue using the 2014-based figures in the standard method.
Further, interim, national population projections were published in January 2022 (2020-based interim projections), although these pre-dated the first findings of the 2021 Census which were published in June 2022. Commentators at the time highlighted that these projections suggested even lower growth than any of its predecessors (see Figure 1), but with no accompanying sub-national population projections or household projections, and with the Census findings being released just months later, these projections largely fell by the wayside in the planning sphere.
What are the latest projections showing?
In January 2024, ONS published the 2021-based interim national population projections; the first to post-date the 2021 Census and the first to reflect the stark increases in international migration seen since the pandemic – a factor we return to later in this blog. In contrast to the previous sets of projections, these are almost exactly in line with the 2014-based projections upon which the standard method is based, with England’s population projected to reach just over 63.5m by 2040. Over the next ten years, annual population growth is expected to be higher than any of the previous sets of projections, at 361,000 per year (Table 1).
Figure 1 Projected population – England – to 2040
Source: Various ONS Projections. Refers to principal projection.
Table 1 Projected population – England – to 2040
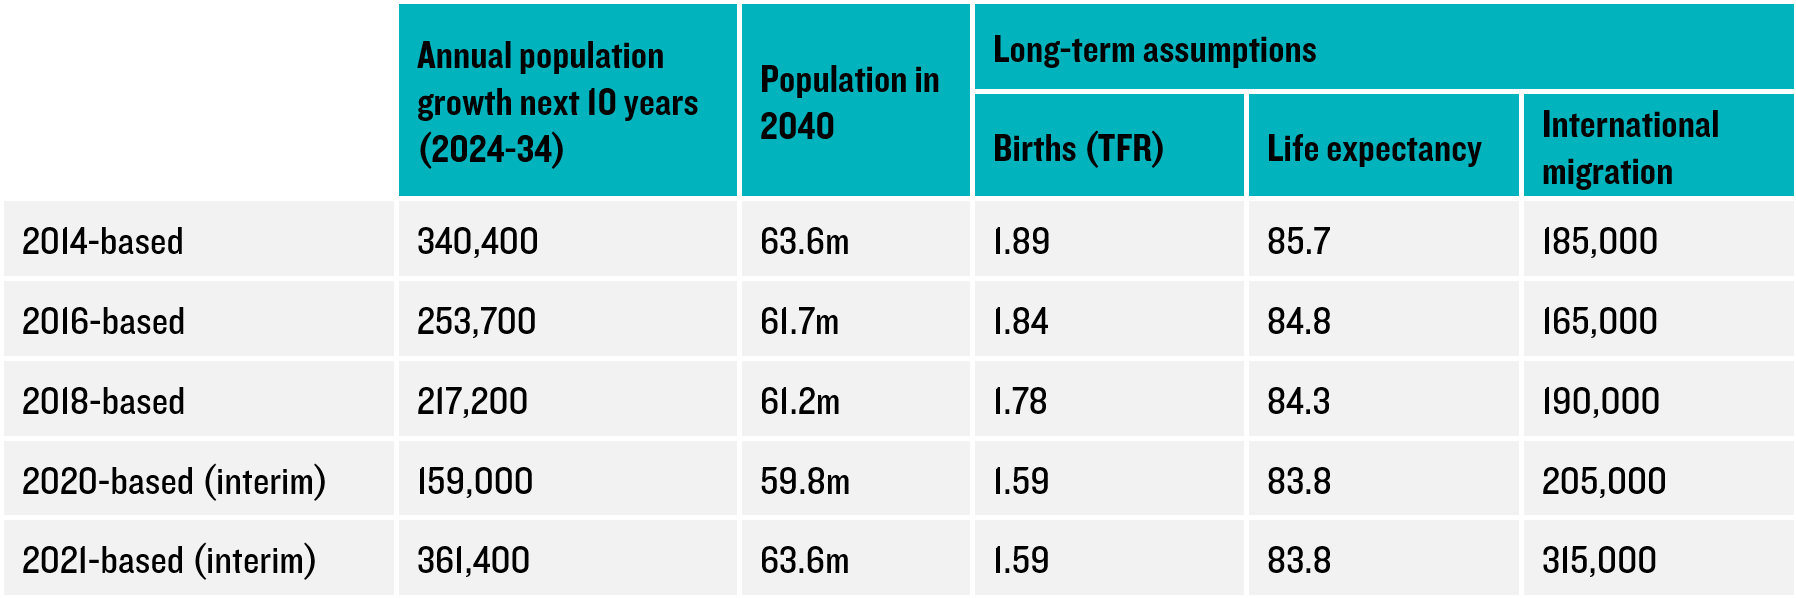
Source: Various ONS Projections. Refers to principal projection. Figures rounded. Life expectancy is average of males/females.
Clearly changes in international migration have had a significant impact, with the long-term assumption for migration now at 315,000 per year; nearly double that in the lowest projection (2016-based) and 70% higher than that in the 2014-based projections, even though the population projection for 2040 is the same in the latest projection as in its 2014-based predecessor. This shift – with more growth being driven by migration (rather than natural change – i.e. births and deaths - within the UK) - could also have implications for the types of housing needed, even if the overall number of homes remains the same.
Migration rose steadily from around 200,000 per year to 300,000 per year in the mid-2010s, and then fell steadily in the aftermath of the EU referendum (in 2016) and the onset of the pandemic (in 2020), as shown in Figure 2. But since then there has been a complete reversal of this trend, with news outlets even commenting on how migration was at record hights
[1] towards the end of 2023, reaching around 750,000 in 2022 and almost entirely driven by migration from outside the EU.
So, although ONS’s long-term projection of migration of 315,000 per year seems high in the context of previous projections, it still represents a fall of around half of current levels to a level broadly in line with what was seen in the mid-2010s immediately prior to the EU Referendum. Although forecasting long-term migration trends is somewhat of a ‘crystal-ball-gazing’ exercise, a fall to 165,000 per year from mid-2022 (which was expected in the 2016-based projections – the lowest in terms of migration) surely now seems highly unrealistic.
Figure 2 Net migration (UK) – June 2012-present
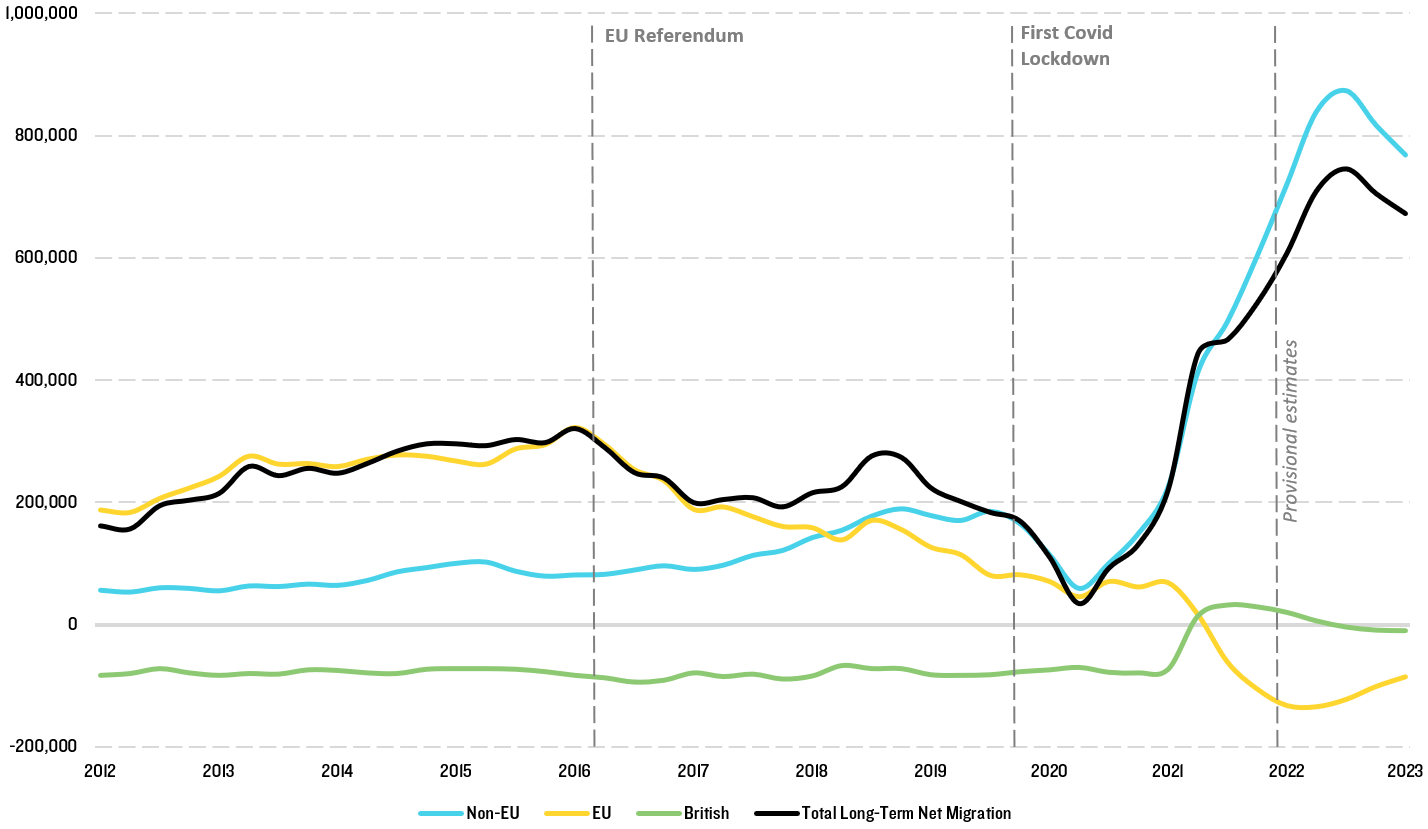
Source: Adapted from ONS here
What does this mean for housing need?
Of course, we will need to await ONS’s next set of sub-national and household projections
. But based on these interim projections outputs, we can still make some important observations on the direction of travel.
Perhaps most obviously, the latest projections place a renewed emphasis on the importance of planning for the standard method in line with the 2014-based projections, in order to support the aspiration of delivering 300,000 homes a year. At the national level, they are likely to suggest there are fewer (if any) circumstances in which authorities can suggest they have ‘exceptional circumstances’ which justify adopting a lower assessment of housing need.
They also highlight the importance of being able respond to changing circumstances in the plan-making context, particularly when it comes to housing needs. Projections of future population growth can evidently change rapidly in a short space of time, reflecting changes in current national trends particularly around migration, and it is vital that plans are equipped to deal with this.
Plan-makers will also need to keep an eye on how these projections affect economic growth forecasts, particularly forecasts where demographic change is an input. Whilst the 2014-based and 2021-based population projections have similar overall levels of population growth, the latter projections are far more driven by international migration than by natural change within the UK population (i.e. births and deaths). Growth driven more by migration is likely to yield an overall younger population, with growth in the labour force, in turn suggesting higher job growth. Plan-makers will need to ensure that enough homes are provided in the right places to support sustainable economic growth, reflecting these latest projections. Similarly, plan-makers will need to ensure that the changing age profile is reflected in assessments of housing mix, to ensure that the right types and tenures of housing (particularly those catering to working adults and families) are delivered.
[1] See BBC news here
[2] ONS’s release calendar suggests that it will next be producing a set of full 2022-based national population projections in Winter 2024, with associated 2022-based sub-national population and household projections to follow in Spring/Summer 2025.