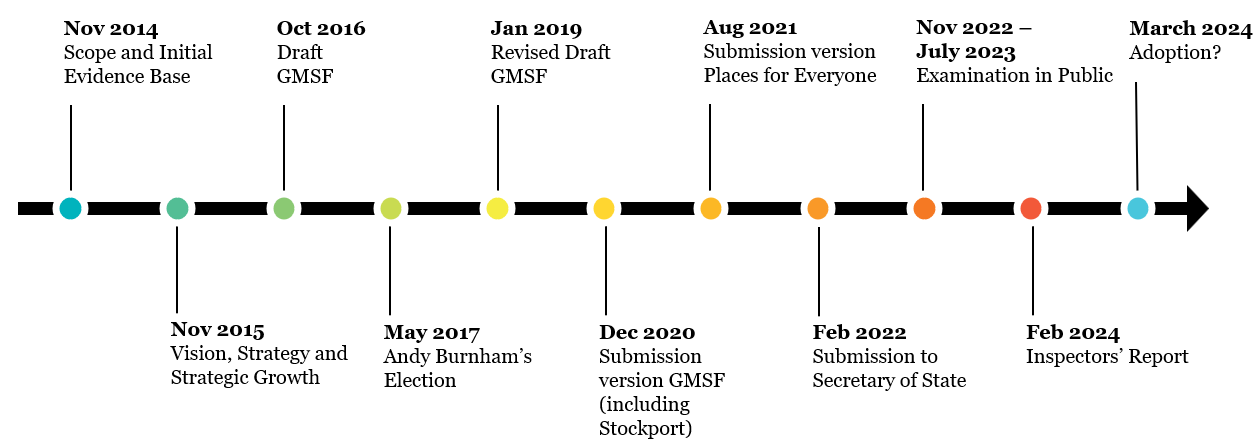
Greater Manchester’s Places for Everyone (PfE) has been formally adopted this week, following its protracted and highly contentious evolution. Since its inception, it has taken almost a decade for the Plan to be adopted (see timeline). The protraction in its preparation can be put down to many factors but the scale of the Plan – originally covering 10 districts
[1] – and how politically entangled it has become are significant factors.
Figure 1: Timeline of PfE Preparation
At the outset, it is important to recognise the significant achievement of the GMCA in persevering with the Joint Plan, getting it found sound by the 3 appointed Planning Inspectors and getting all 9 remaining districts to formally approve the document following the issue of the Inspectors’ Report on 14th February.
Although this brings to an end the chapter relating to the preparation of the PfE, it is clear to see from the content of the Plan and the Inspectors’ Report that there is a long road ahead for the 9 districts in the preparation of their individual Local Plans.
From a housing perspective, the Plan sets a minimum requirement over the Plan period of 175,185 net additional dwellings (an average of 10,305 per year). In terms of supply to meet this need, the GMCA claimed that there was sufficient supply to deliver 198,763 new homes. Although the majority of the focus of this Plan was on Green Belt releases, the total number of units which can be delivered on these Green Belt allocations is 19,997 units, just over 10% of the total supply. Therefore, the vast majority of housing delivered in the 9 districts over the period to 2039 will be on brownfield sites.
From an industry and warehousing perspective, the Plan sets a requirement to deliver at least 3,513,000 sq.m of new accessible, industrial and warehousing floorspace to 2039. The district’s strategic employment land availability assessment identified a supply capable of delivering 2,070,000 sq.m plus land released from the Green Belt being capable of delivering a further 2,001,585 sq.m. Therefore, just under half of the employment supply is on allocations released from the Green Belt.
It is very important to set out that during the Examination of the Plan, the Inspectors were clear that they were not going to examine the housing and employment land put forward in the Plan. Therefore, although the Plan itself sets out the claimed supply from allocations and brownfield sites, these figures have not been endorsed and will be subject to interrogation during the preparation of individual district’s local plans. The Inspectors’ Report (para. 161) states that ‘the supply is based on strategic housing land availability assessments carried out by each of the nine authorities in accordance with national guidance. It is not necessary for us to consider the detailed content of those assessments (or their subsequent updates) as that will be a matter for individual local plans’. This is a very important consideration as one engages with the individual district local plans and could potentially result in the claimed supply position being challenged and opening up opportunities for the need to identify new sites.
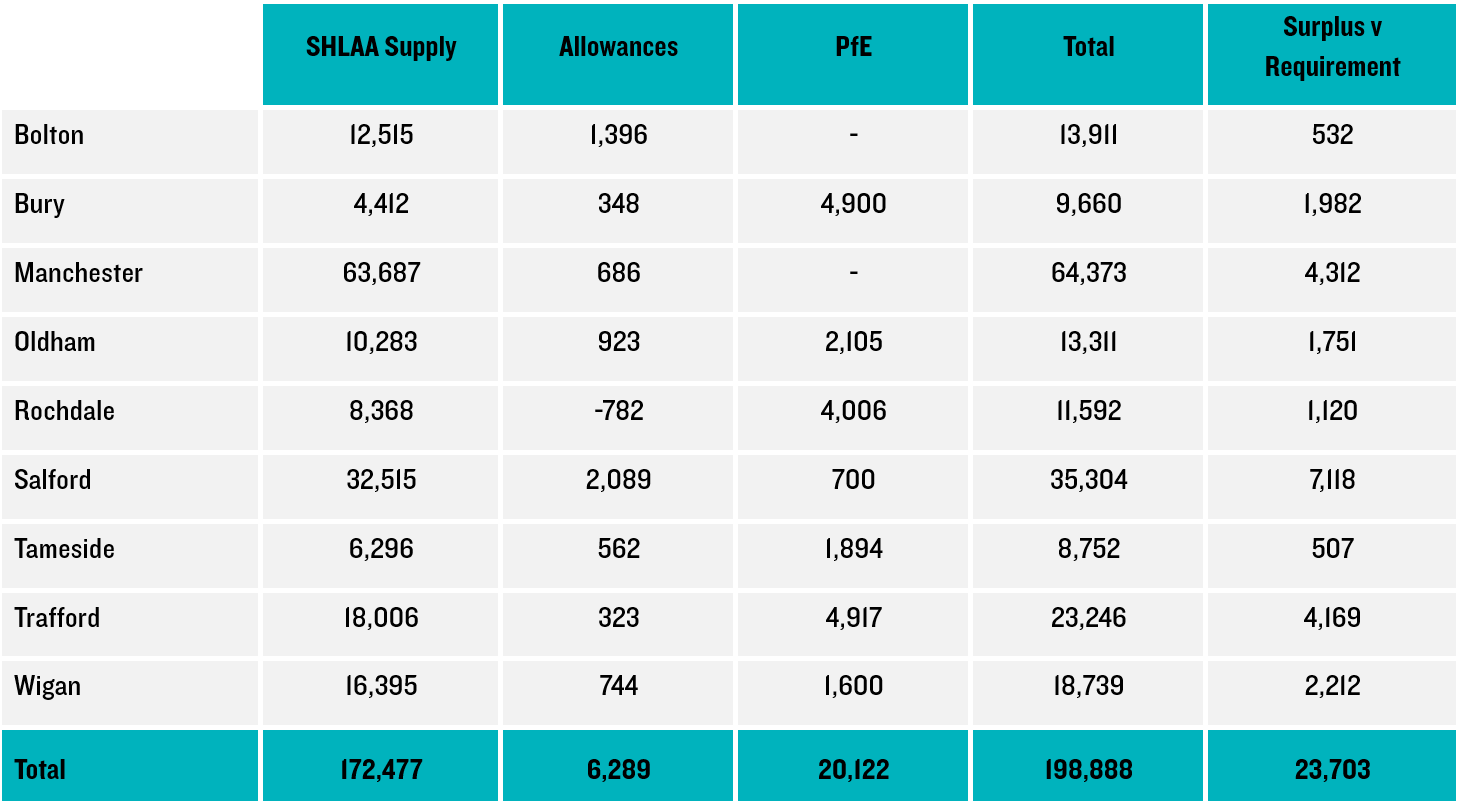
Table 1 sets out a breakdown of the claimed supply position versus the housing requirement to 2039. At best, assuming that all the sites identified by the Councils are deliverable and developable, there is a surplus of just over 23,500 units. However, at face value that surplus masks some of key issues as the majority of the surplus is located in Manchester and Salford.
For instance, Bolton has chosen to identify no Green Belt releases to meet housing needs in the PfE. Best case scenario, Bolton has a surplus of just 532 units which equates to a surplus in years of 0.67 and the windfall allowance in the plan is almost 3 times the surplus to 2039. To compound matters further in Bolton, it has no large-scale allocations which are planned to deliver beyond the plan period and its district Local Plan will need to plan for at least 15 years from adoption in line with para. 1.56 of the PfE.
The Local Authority with the smallest surplus in terms of housing land is Tameside. Although Tameside has allocated land to be released from the Green Belt to meet its housing need and offloading almost 200 units per year to other districts in Greater Manchester through the PfE, the Council only has a surplus of 507 units. This is a little over 1 years’ worth of supply.
Table 1: Housing land Supply v Requirement
The latest NPPF (December 2023) sets out at Para. 76 that LPAs are not required to identify and update annually a deliverable supply of sites sufficient to provide a five-year supply of housing land if their plan is less than 5 years old and
the adopted plan identifies at least a five-year supply of specific, deliverable sites at the time that its examination concluded’. Therefore, as the Inspectors have not reviewed and endorsed the Council’s claimed supply positions, in our opinion, the 9 Council’s are not protected under the provisions of Para.76 of the NPPF. This is particularly a problem for authorities in Greater Manchester in which the current published five-year supply position is challenging, for instance Bolton where their latest claimed position is 3.7 years
[2].
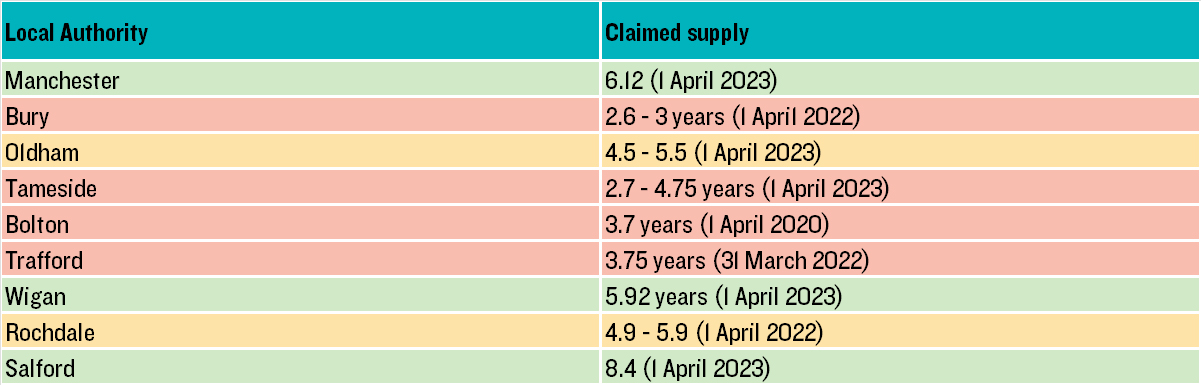
Table 2 sets out the latest claimed housing land supply positions in each of the 9 districts. As this demonstrates, only 3 of the 9 districts can demonstrate a deliverable supply of sites (Manchester, Wigan and Salford), with Bury and Tameside being in very precarious positions with claimed housing land supplies as low as 2.3 and 2.7 years respectively
[3].
Table 2: Housing Land Supply
Conclusions
PfE will now form part of the relevant Authority’s Development Plan and as such local plans will need to be consistent with it and plan (at least 15 years ahead). In the event that a local plan looks beyond 2039, the minimum requirement figures contained within the Plan should be used to inform local plan targets.
The availability of land and its deliverability and developability will continue to be a bone of contention as we move forward. Given the precarious 5-year housing land supply position in a number of authorities, the inability of Local Authorities from being able to utilise the provisions of Para.76 of the NPPF, the very small surpluses in terms of supply versus requirements across the conurbation and the untested nature of the claimed supply, there is every possibility that local authorities will potentially need to identify additional sites to meet their needs. Given the constraints to development in each Local Authority and the tightly defined Green Belt boundaries, there is every possibility that Local Authorities will again need to explore if Exceptional Circumstances exist to release further land from the Green Belt in Greater Manchester.
Whilst there is no requirement in the NPPF for Green Belt boundaries to be reviewed when plans are being prepared or updated, if an authority cannot identify sufficient land in their Local Plan to meet the needs identified in the PfE, it will not be consistent with the provisions of the PfE as required by Para. 1.56. Therefore, additional Green Belt releases may be required should there be a shortfall in housing land supply. However, we are aware of how politically contentious this would be particularly given the direction of travel with regards to Green Belt release in the latest NPPF. The saga continues…
[1] Stockport Council withdrew from the Greater Manchester Spatial Framework in December 2020 after which the Joint Plan became known as the Places for Everyone Plan. [2] Bolton’s latest published position on housing land supply has a base date of April 2020. [3] A note of caution is needed in relation to these figures as the approach to the housing requirement is inconsistent and some may have used the LHN figure which is different from the figures in the PfE. Some housing requirements may have increased whilst others have decreased.