Part 2: Households
Renown for being amongst the hottest and driest places on earth, California’s Death Valley is also famous for periodically bursting into life with a “super bloom”. This explosion of golden wildflowers relies on exactly right combination of heavy rains followed by warm temperatures and lighter rain showers. In an area that is as inhospitable as Death Valley, this blend of conditions is not a common occurrence. The super bloom takes place once a decade.
Just as it is with the super bloom, household growth in any area depends on the presence of the right combination of factors: in this case relating to demographic, housing and economic considerations. Fortunately, the conditions for household growth do not just occur once a decade although the decennial census does provide an opportunity to review the scale of change that has occurred and inform projections of future trends.
This blog –
the second in our series on the initial release of 2022 census data – considers the changing household trends in Wales and seeks to understand the implications of this for future housing need.
A greater number of smaller households
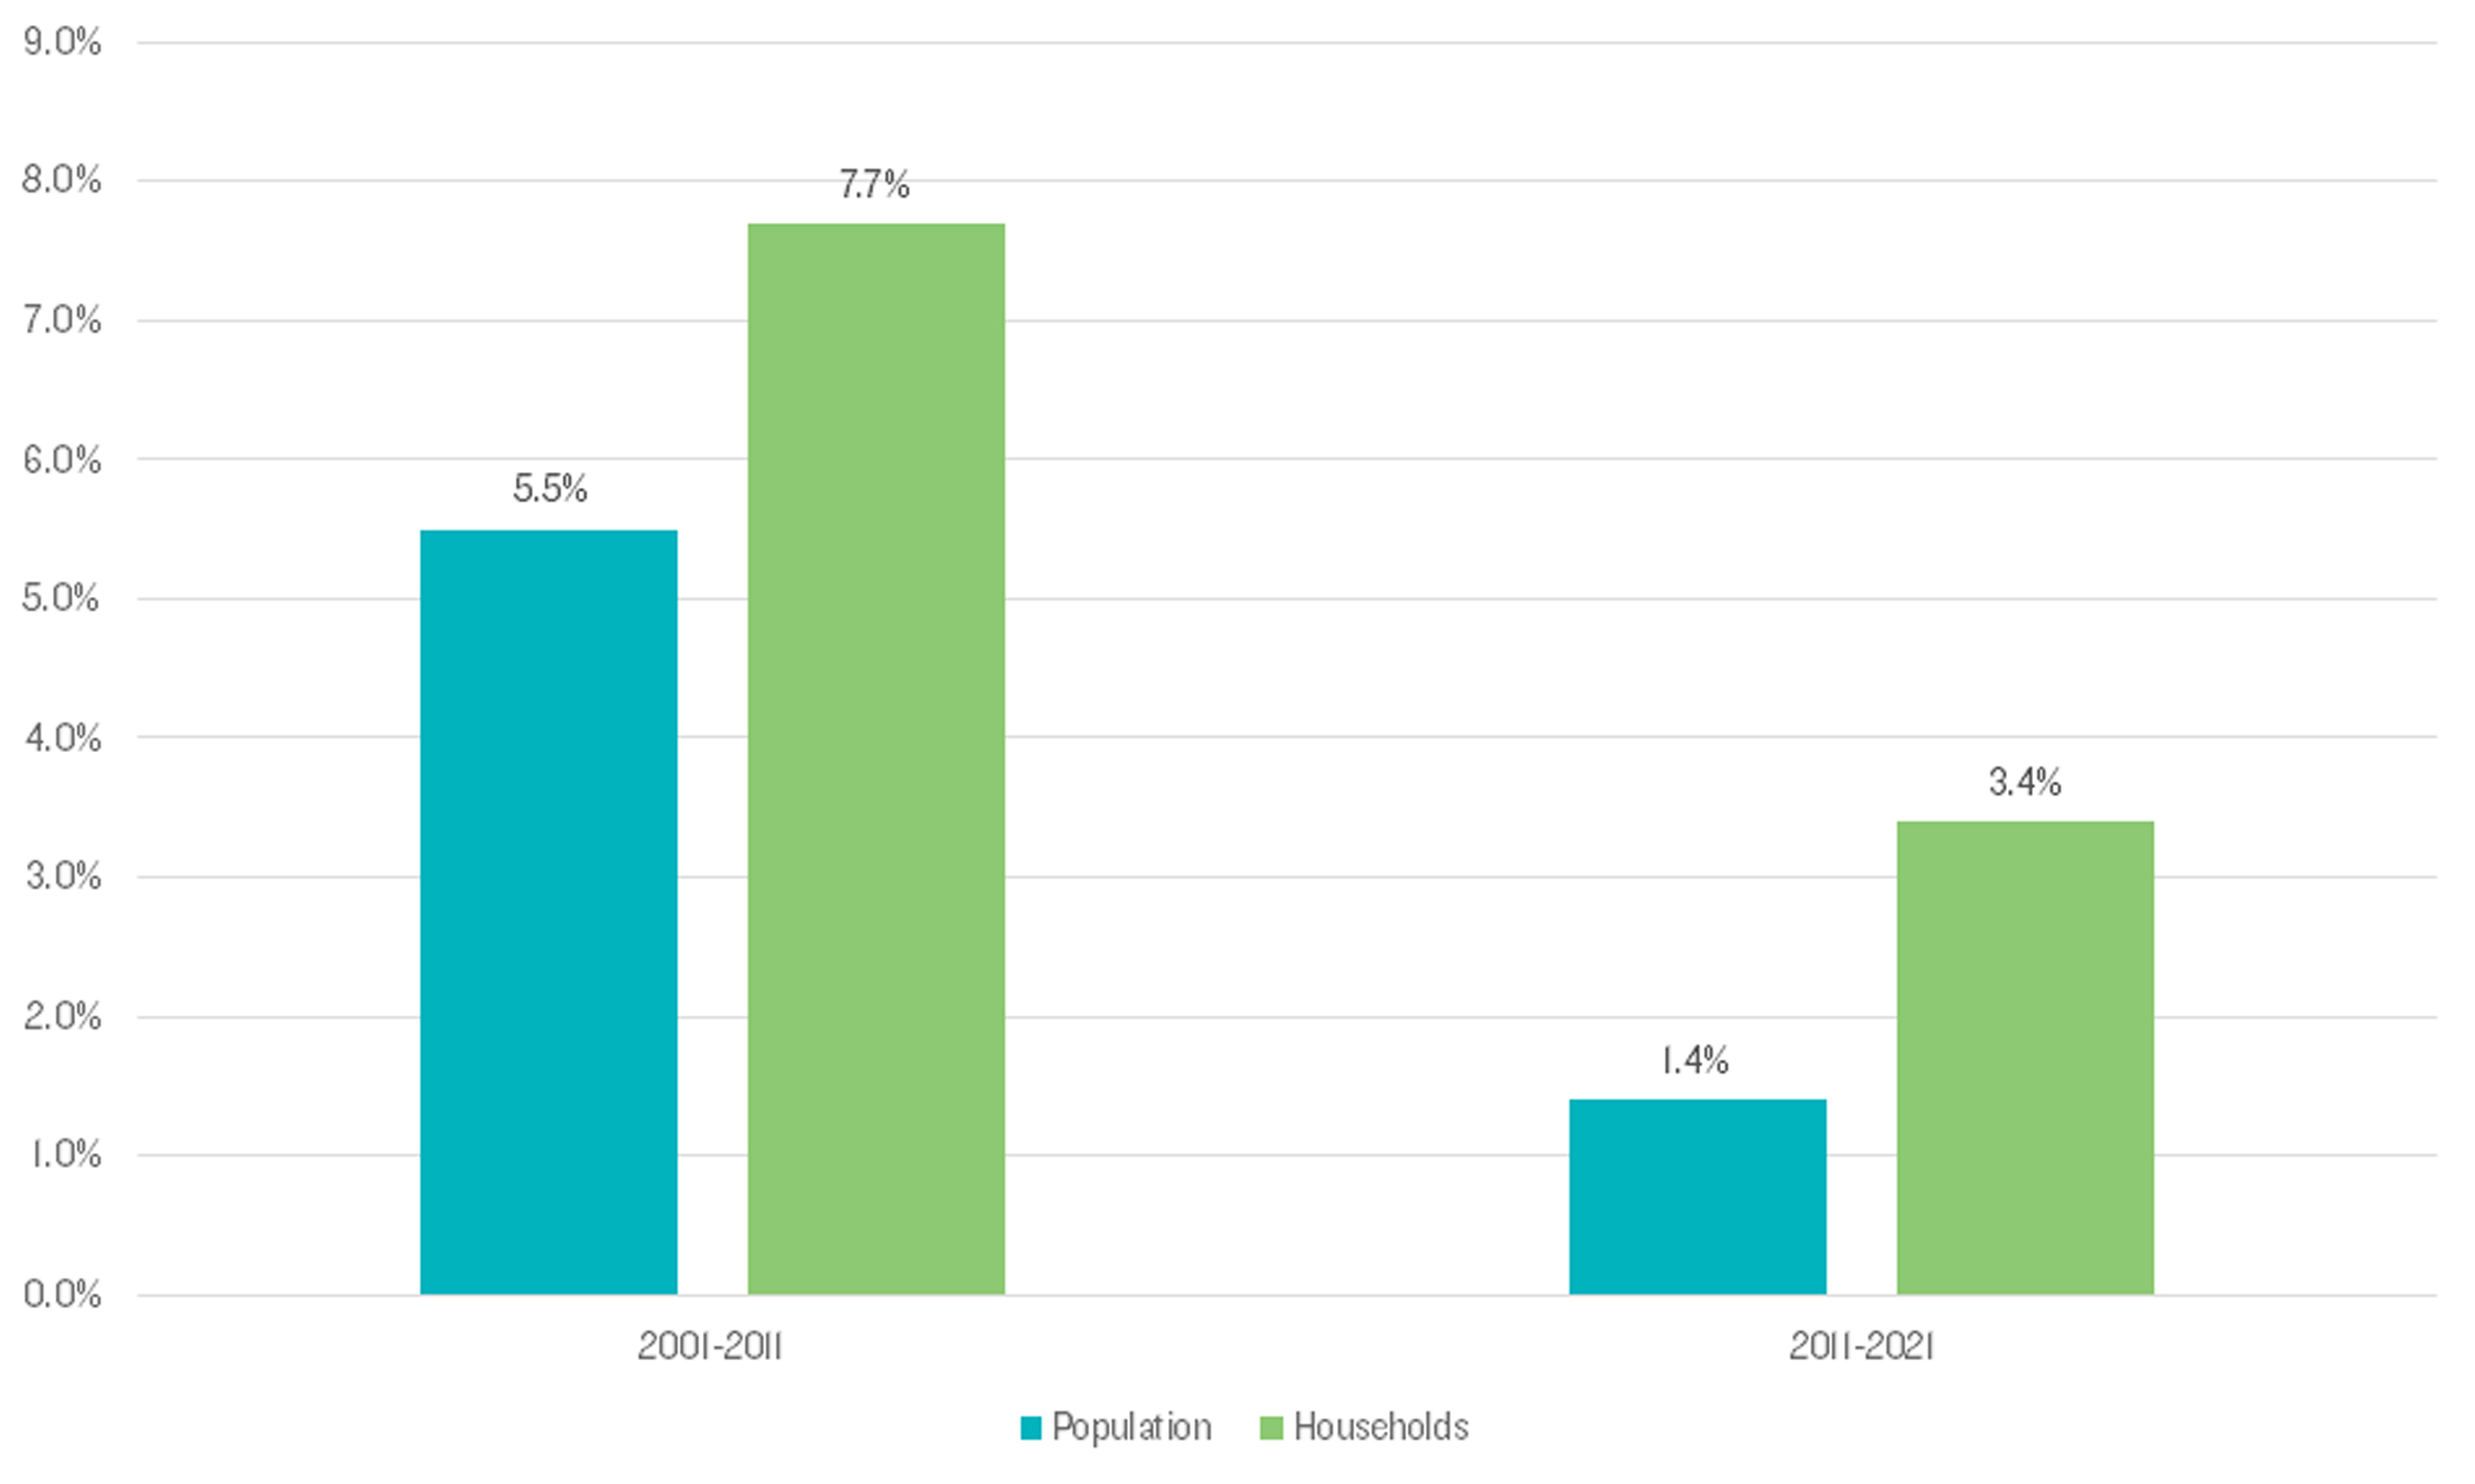
Between 2011 and 2021, the number of households in Wales grew by 3.4% from 1.3 million to 1.35 million. This shows that actual household growth has slowed substantially from the 7.7% increase experienced between 2001 and 2011. It also equates to approximately half the level of household growth that has been experienced in England since the last census. A comparison with population growth, however, shows that there has been a disproportionately high level of household formation in Wales. This is an important but unsurprising trend which replicates that seen between 2001 and 2011 (albeit at a lower level) and underlines the extent to which new households are forming from within the existing population as well as resulting from population growth.
Table 1 Relative population and household change in Wales
 Source: Lichfields analysis of Census results
The implication of the rates of population and household growth is that Wales has seen a 1.9% decline in average household size over the past decade to 2.35 in 2021. This contrasts to the situation in England where average household size increased 0.3% to 2.41 in 2021 (compared with 2.4 in 2011). This decline in household size reflects a continuation of long-term trends in response to a range of social trends. It underlines the continued need for housing to attract and retain working age population but it is important that falling average household size is not conflated with the need for smaller dwellings. The provision of a range of housing types and sizes is essential to tackling the reduction in the number of working age and younger people – a significant challenge in Wales that was discussed in our previous blog post.
Regional Disparity
Breaking down household change across local authorities reveals a more nuanced picture. Despite experiencing the highest population growth (accounting for 95% of the total population growth for Wales between 2011 and 2021) and being the only four counties not to suffer a decline in working age populations, Cardiff, Bridgend, Newport, and the Vale of Glamorgan only accounted for 40% of the total household growth in Wales – although three of these authorities (Bridgend, Newport, and the Vale of Glamorgan) were amongst the top five in terms of the level of household growth since the last census (along with Monmouthshire and Merthyr Tydfil). Despite experiencing the second highest population increase in the country (4.7%), the number of households in Cardiff increased by just 3.3%.
This shows that despite strong economic prospects in these four authority areas and their attractiveness for younger people, household formation is falling behind and cannot keep up with population growth. Reasons for this include a failure to deliver sufficient new homes, the relative (un)affordability of housing in these areas, and the potential (un)suitability of the housing stock for newly forming households. These issues were particularly pronounced in Cardiff and Newport which were the only local authorities in Wales to experience an increase in average household size since the last census.
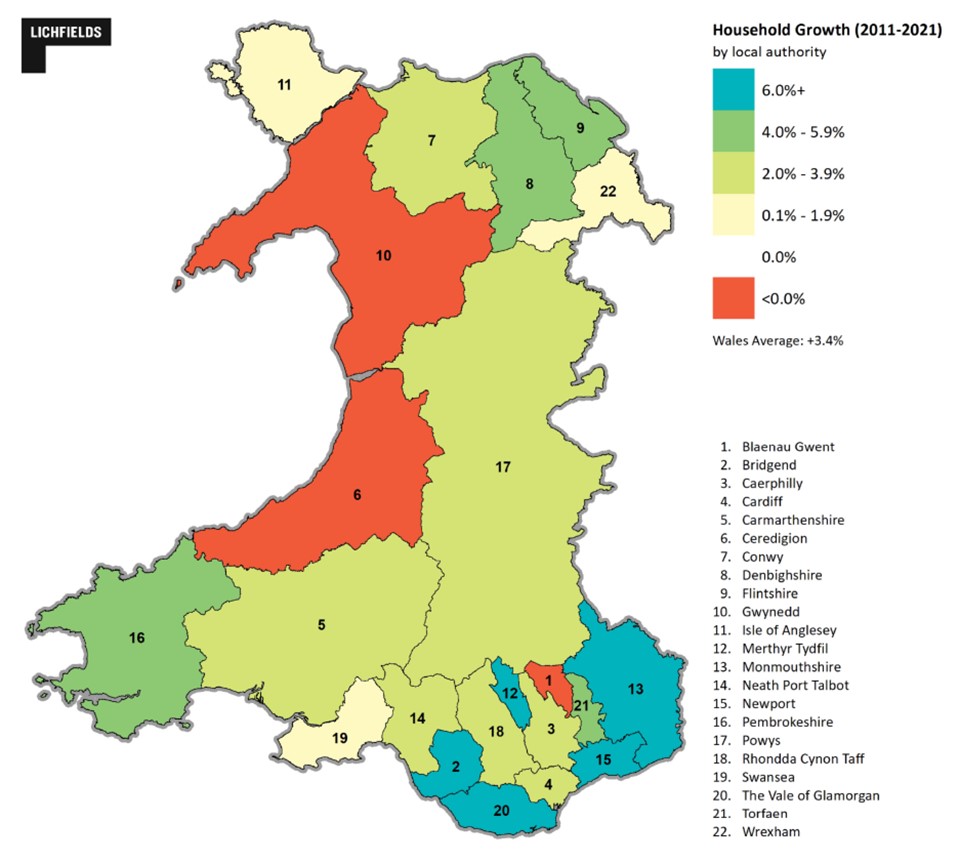
Figure 1 Household change between 2011 and 2021 by local authority
Source: Lichfields analysis of Census results
Three counties experienced negative household change: Gwynedd (-2.6%), Ceredigion (-2.1%) and Blaenau Gwent (-0.4%). This reflects the trend of these being the only authority areas to experience population decline since the last census.
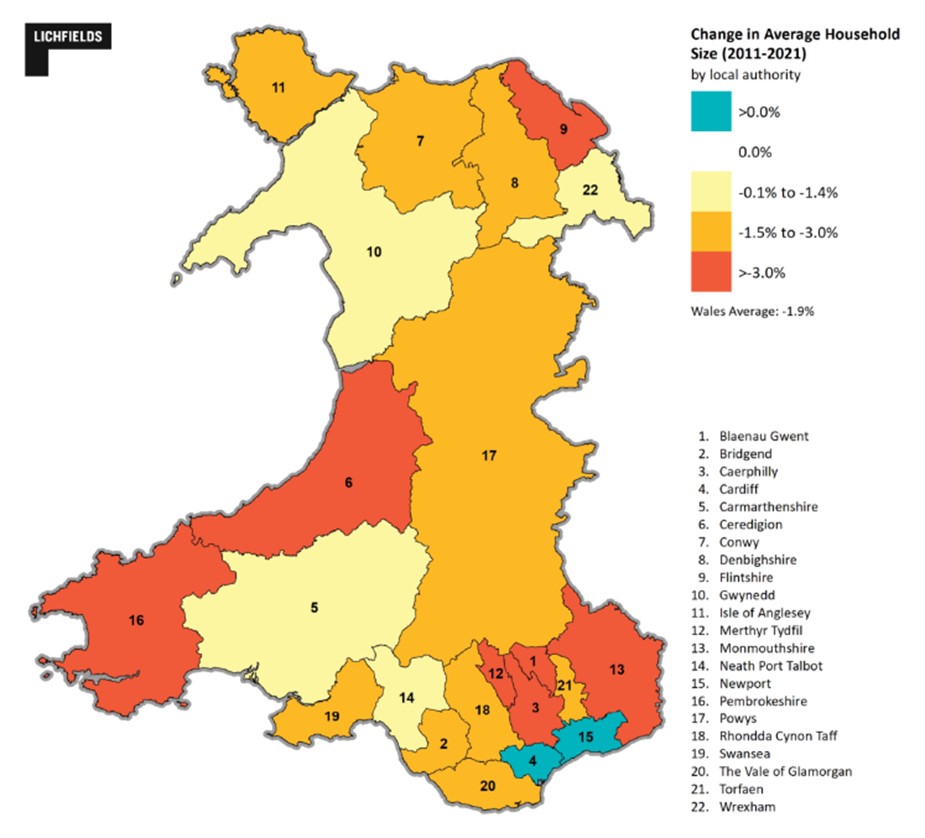
When looking at the change in household sizes by authority, there are significant differences across the country. As set out above, there were only two local authorities – Cardiff and Newport – which experienced an increase in average household size (both by 1.3%). The previous blog noted that these were the two areas that experienced the biggest rate of population growth. This suggests that existing households have absorbed more of the influx of people, rather than population growth facilitating new household formation. By contrast, all other local authorities experienced a reduction in household sizes. The biggest decrease was in Merthyr Tydfil (6%) where there was a 0% change in population, with significant reductions also in Monmouthshire, Caerphilly, Ceredigion and Pembrokeshire. The population of Monmouthshire and Pembrokeshire increased slightly since the previous census but each of the other areas with the most significant level of decline in their average household size also experienced a loss of population since 2011. All of these authorities experienced a decline in young people and working age population and a significant increase in the number of people over the age of 65. These population trends help to explain the household patterns that have occurred as younger people tend to live in larger households (either in shared homes or families) than those of retirement age who typically live in couples or alone.
Figure 2 Household size between 2011 and 2021 by local authority
Source: Lichfields analysis of Census results
Implications
It is instructive to consider how these trends relate to housing delivery in Wales. When comparing average housing delivery against Local Development Plan requirements, a clear pattern of under-provision emerges. Only one Welsh authority exceeded its housing target and the national average for Wales was less than 50%, as ten local authorities delivered less than half of their identified requirements.
These levels of delivery are likely to have had direct implications on the population and household trends that have been seen since 2011. Under-delivery of housing can have consequences in terms of the demographic profile of an area, as well as its social and economic wellbeing.
Whilst some may see census results in respect of limited rates of household growth as justification for less housing, the wider social trends and reflection in population demographics discussed in this blog series convey a different story. Boosting population growth and retaining younger age groups through the supply of housing will support a larger workforce and will inevitably offer social and economic benefits to Wales and individual local authorities. To do so there needs to support for a future step-change in housing delivery.
 Source: Lichfields analysis of Census results