Part 1: population
Once a decade the population of the painted lady butterfly increases across the UK as a result of a combination of weather conditions and food sources providing ideal conditions for the species to thrive. It is not likely that the number of butterflies is assessed with as much rigour as the number of people through the decennial census and unlike the butterfly population which swiftly falls back to its previous size, the recently published initial tranche of census data shows that the population of England and Wales has continued to grow over the past ten years to an all-time high of 59.6 million. The figures for England were assessed in a recent
insight focus. This blog – which is the first in a series considering what the newly released data means for Wales – considers the extent to which the population results for Wales buck the national trend and the challenges that this creates for policy makers. We will consider the household results in a follow-up piece.
A slowly increasing but rapidly ageing population
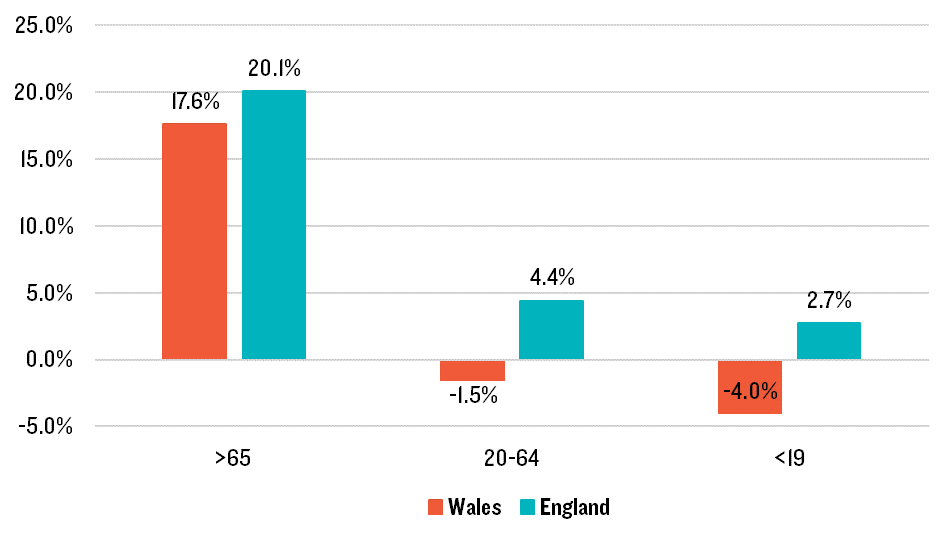
Between 2011 and 2021, the population of Wales increased by just 1.4% to 3.1 million. This compares to an increase of 6.6% in England and is a quarter of the relative increase experienced in Wales between 2001 and 2011 (5.5%). This growth was entirely driven by older people, with a 17.6% increase in the number of people over the age of 65 and a reduction in the number of young people aged 19 and under (-4.0%) and a working age people (-1.5% aged 20-64). Whilst there was a higher rate of increase in the over 65 population in England, the younger age cohorts in England also increased in size.
Figure 1 Demographic composition of population change between 2011 and 2021
Source: Lichfields analysis of Census results
The rate at which the population ages has significant implications on a wide range of factors including social care, housing need and the strength of the local economy. The old age dependency ratio indicates the number of people of working age in a given population that are available to support the older population (over 65). A higher ratio indicates that there will be a greater need to support older persons who may be economically dependent. A review of the census data shows that Wales has a higher, and more rapidly increasing dependency ratio than England with almost four people over 65 for every ten people of working age. In addition, Wales has experienced a decline in the under 19 population (-4.0%) compared to a slight increase in England (+2.7%). The implication of this is that the situation in respect of a shrinking working population will become even more severe in Wales than in England where there is an increase in young people ready to enter the workplace in the future.
Table 1 Changing old age dependency ratio in England and Wales
Source: Lichfields analysis of Census results
A regional perspective
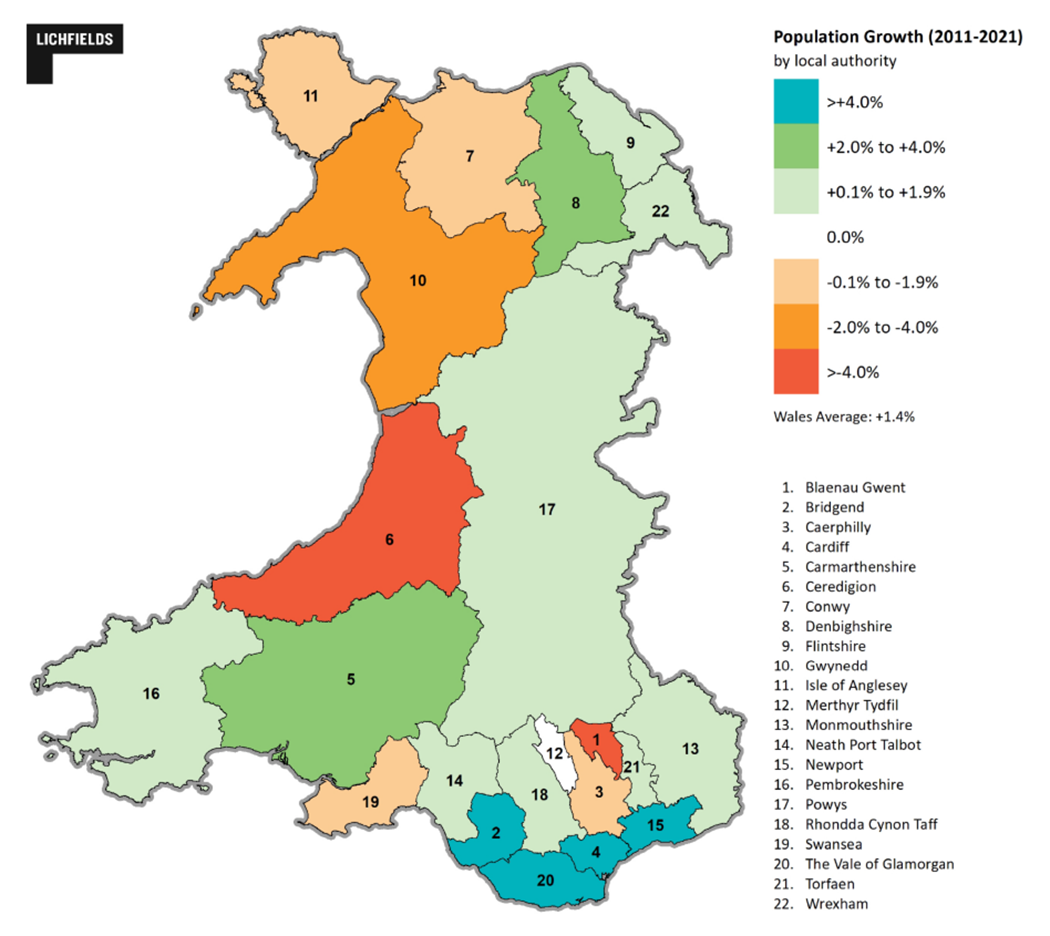
Analysis of the census results shows that 95% of the total population growth of Wales has been concentrated in just four local authority areas – Cardiff, Bridgend, Newport and the Vale of Glamorgan. These areas are all located along the M4 corridor and within the Cardiff Capital Region area of South East Wales. They are amongst the most prosperous parts of Wales and their economic strength will have been important in attracting and retaining working age people. This is reflected in a review of the demographic profile of the population change. These were the only four authorities in Wales not to experience a decline in the working age population, with Newport experiencing a 10.9% increase in the number of people between the age of 20 and 64. Together with below-average rates of increase in the over 65 population, the implication of this is that the data indicates Cardiff and Newport as having the lowest old age dependency ratio in Wales (23.7% and 29.0% respectively). This puts both authorities in good stead to continue to drive the Welsh economy.
At the other end of the spectrum, a loss of population has occurred in seven local authorities, with Ceredigion experiencing a 5.8% reduction. The authorities with a shrinking population include:
- Rural areas in mid and north Wales (Ceredigion, Conwy, Gwynedd and Anglesey);
- Valley authorities (Blaenau Gwent and Caerphilly – both of which are within the Cardiff Capital Region); and,
- Wales’ second largest city of Swansea.
All of these authorities experienced a significant reduction in young and working age population although, interestingly, the old age dependency ratio was below average in three of these authorities (the more urbanised areas of Blaenau Gwent, Caerphilly and Swansea). Anglesey and Conwy both have dependency ratios of more than 50% albeit that they lag behind the highest ratio of 52.6% in Powys.
Figure 2 Population change between 2011 and 2021 by local authority
Source: Lichfields analysis of Census results
Implications
These results matter. They will influence a wide variety of policy areas from the economy to social care and education. They influence the planning and economic development arenas as well. The results summarised above highlight the reality of a much more rapidly ageing population and a loss of (current and future) working age population. But they also highlight a divergence in trends across Wales.
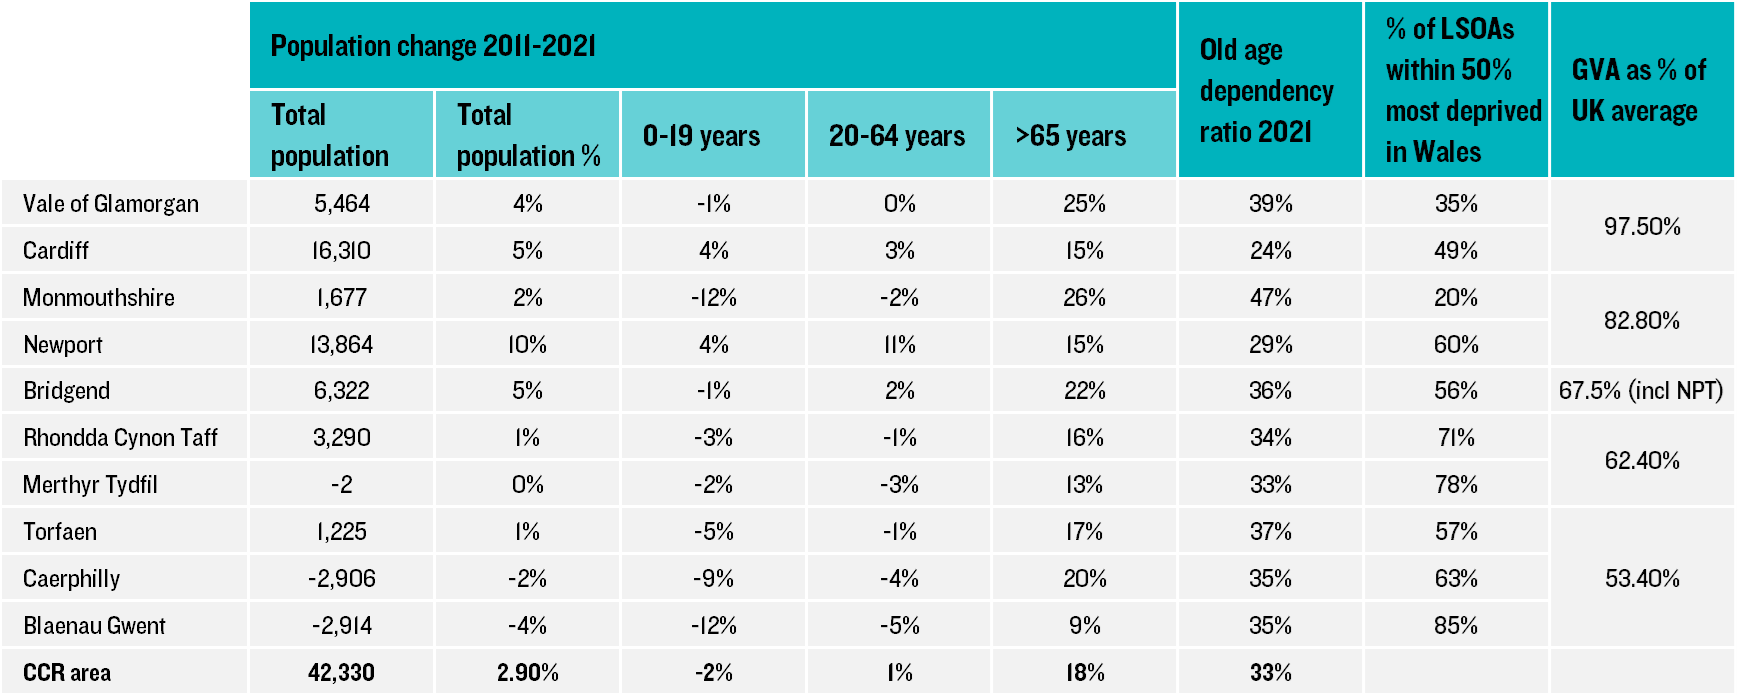
When assessed against a number of metrics, the Welsh economy lags behind that of England with GVA across Wales equating to 73% of the UK average. Even in the most prosperous area, Cardiff and the Vale of Glamorgan, the GVA only equates to 97.5% of the UK average. By contrast, GVA in the weakest economic areas (Angelsey and the Gwent Valleys) equates to just half the national average. The Cardiff Capital Region is playing an important role in driving forward the economy in this part of the country but even within the ten local authorities that it covers, the census data points towards clear differences in levels of population growth, demographic profile and economic strength:
Table 2 Overview of authorities within the Cardiff Capital Region
Source: Lichfields analysis
The data contained within this initial census release highlights a set of clear challenges. These exist across Wales, including in the successful CCR area, but most particularly in those areas that are seeing a declining population. Going forward, it will be important to work to stimulate the economy and encouraging more people of working age to move into – and remain – in the area will be critical to this. Such an outcome will depend on attracting a range of jobs in a variety of different economic sectors and delivering an adequate level of new housing in order to accommodate the growing workforce.
Further census results will be published in the coming months. They will allow us to delve even more deeply into these issues. And unlike the decennial increase in the painted lady butterfly population, the implication of this data will be very long lasting.
In the next blog in this series, we will discuss what the census results tell us about the need for housing in Wales and consider how the data might be used to respond to the requirement for new developments to demonstrate nutrient neutrality.


