The new standard method for calculating local housing need is one of the central tenets of achieving the Governments objective to deliver 1.5m homes in the current Parliament. The new method is much more ambitious than its predecessor (targeting 372,000 homes per year up 21% from 305,000).
It was for this reason that the proposed changes prompted much commentary when published in July alongside the draft changes to the NPPF. At the national level, the changes to the standard method (in the published – December – version, compared with the draft – July – version) result in broadly the same figure – 370,400 rather than 371,500 per year.
Whilst the changes from the initial draft version might appear imperceptible nationally, they contain a broader shift in the geography of housing need.
Ch-ch-ch-ch-changes
The new method aims to boost housing numbers by pinning targets to existing housing stock (rather than household projections, as per the former method) and then uplifting needs, and the target, based on affordability (using a three-year average). It no longer includes a 35% uplift for urban areas and also does away with the ‘cap’. We commented in detail on the proposed changes back in July,
here.
So, what has changed between these versions, and what impact could it have?
- Starting point – 0.8% of stock – no change between the proposed July and published December methods. Keeping stock as part of the equation provides the important long-term stability and more even starting point;
- Affordability uplift:
- Time period – the July method proposed use of three-year affordability average whereas December method proposes use of five-year average. On the whole, five-year affordability ratios are lower than three-year ratios (across England, down 3.4%), so in isolation this change would have a downward effect on numbers;
- Baseline – the July method proposed an uplift for anywhere where the affordability ratio is above four, whereas the December method proposes an uplift anywhere where the ratio is above five. In isolation, this would have a downward effect (since fewer areas would be subject to an uplift); and,
- Degree of uplift – the July method proposed that for every 1% the affordability ratio was above the baseline, a 6% uplift would apply. The December method increases this to 0.95%. In isolation, this would have an upward effect.
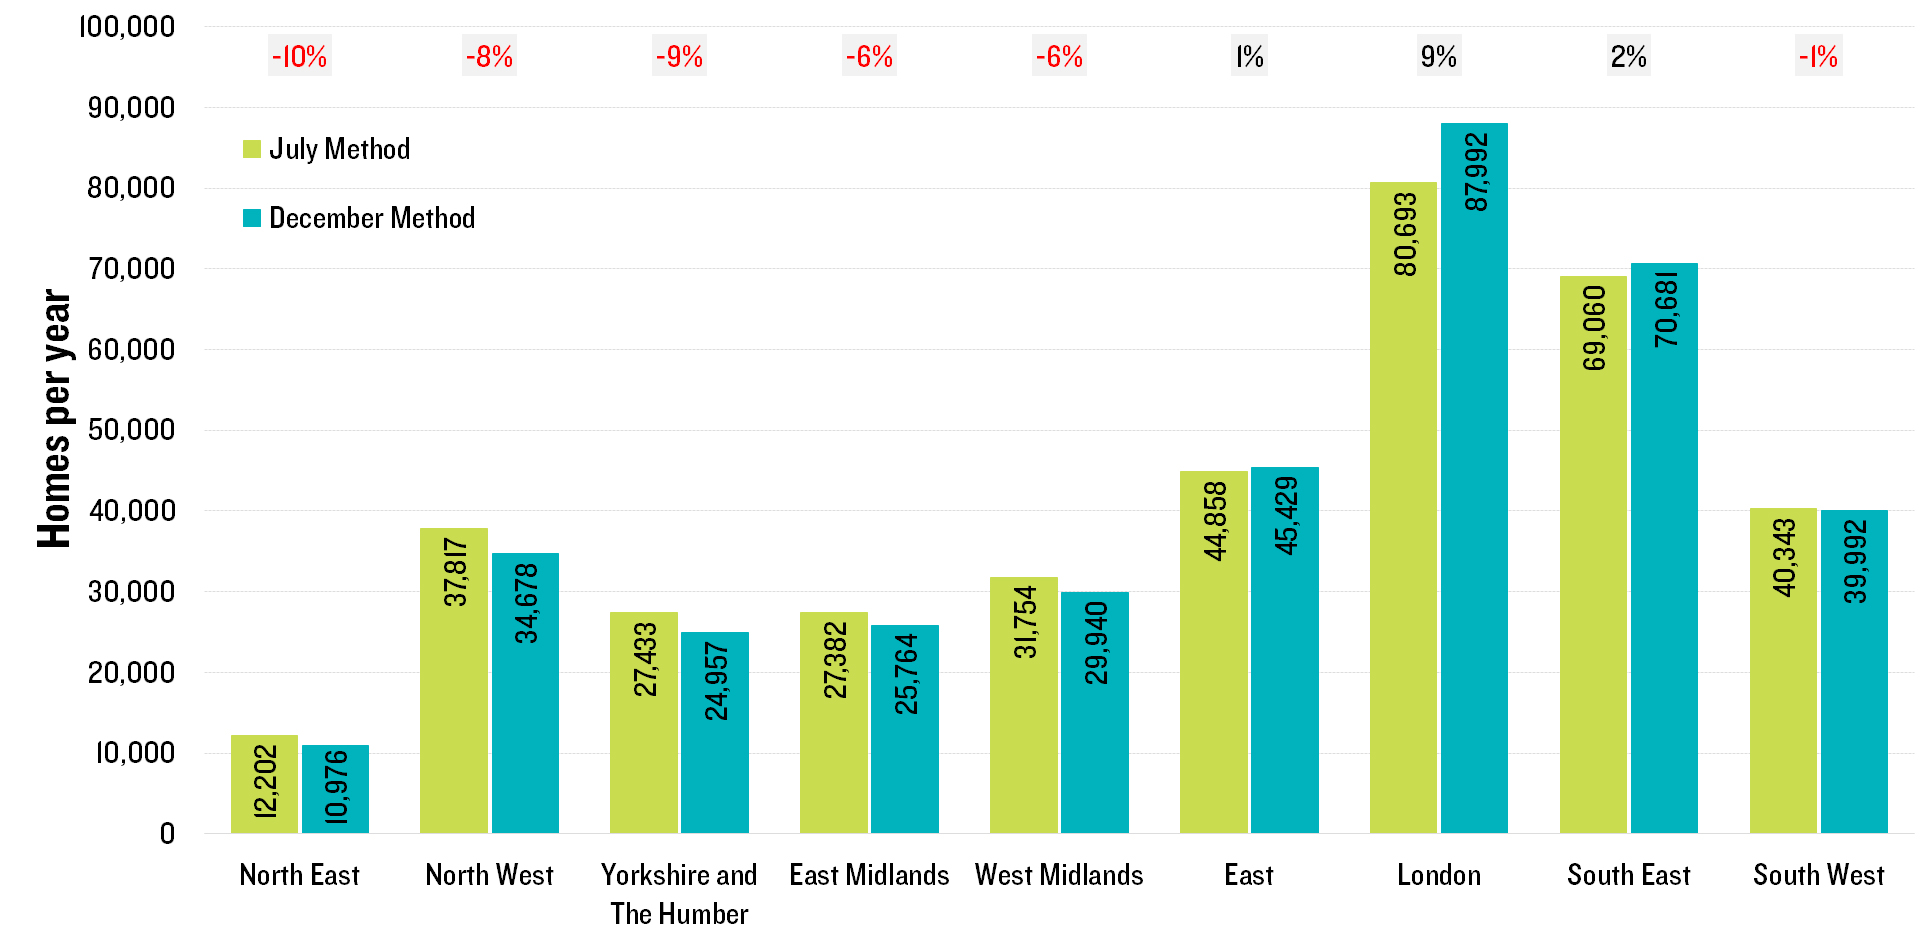
In short, the changes have the effect of decreasing (or indeed, removing altogether) the affordability uplift – and thus housing numbers – in the most affordable areas, and increasing the affordability uplift and numbers in less affordable areas. In practical terms, from the proposed July version this results in a shift of housing numbers away from the Midlands and North and more greatly concentrated in London and the wider South East, as shown in Figure 1 and Figure 2.
Figure 1 – Difference between July and December Method. Source: Lichfields

Figure 2 - Map of change between July and December by LPA
The only way is up (still)
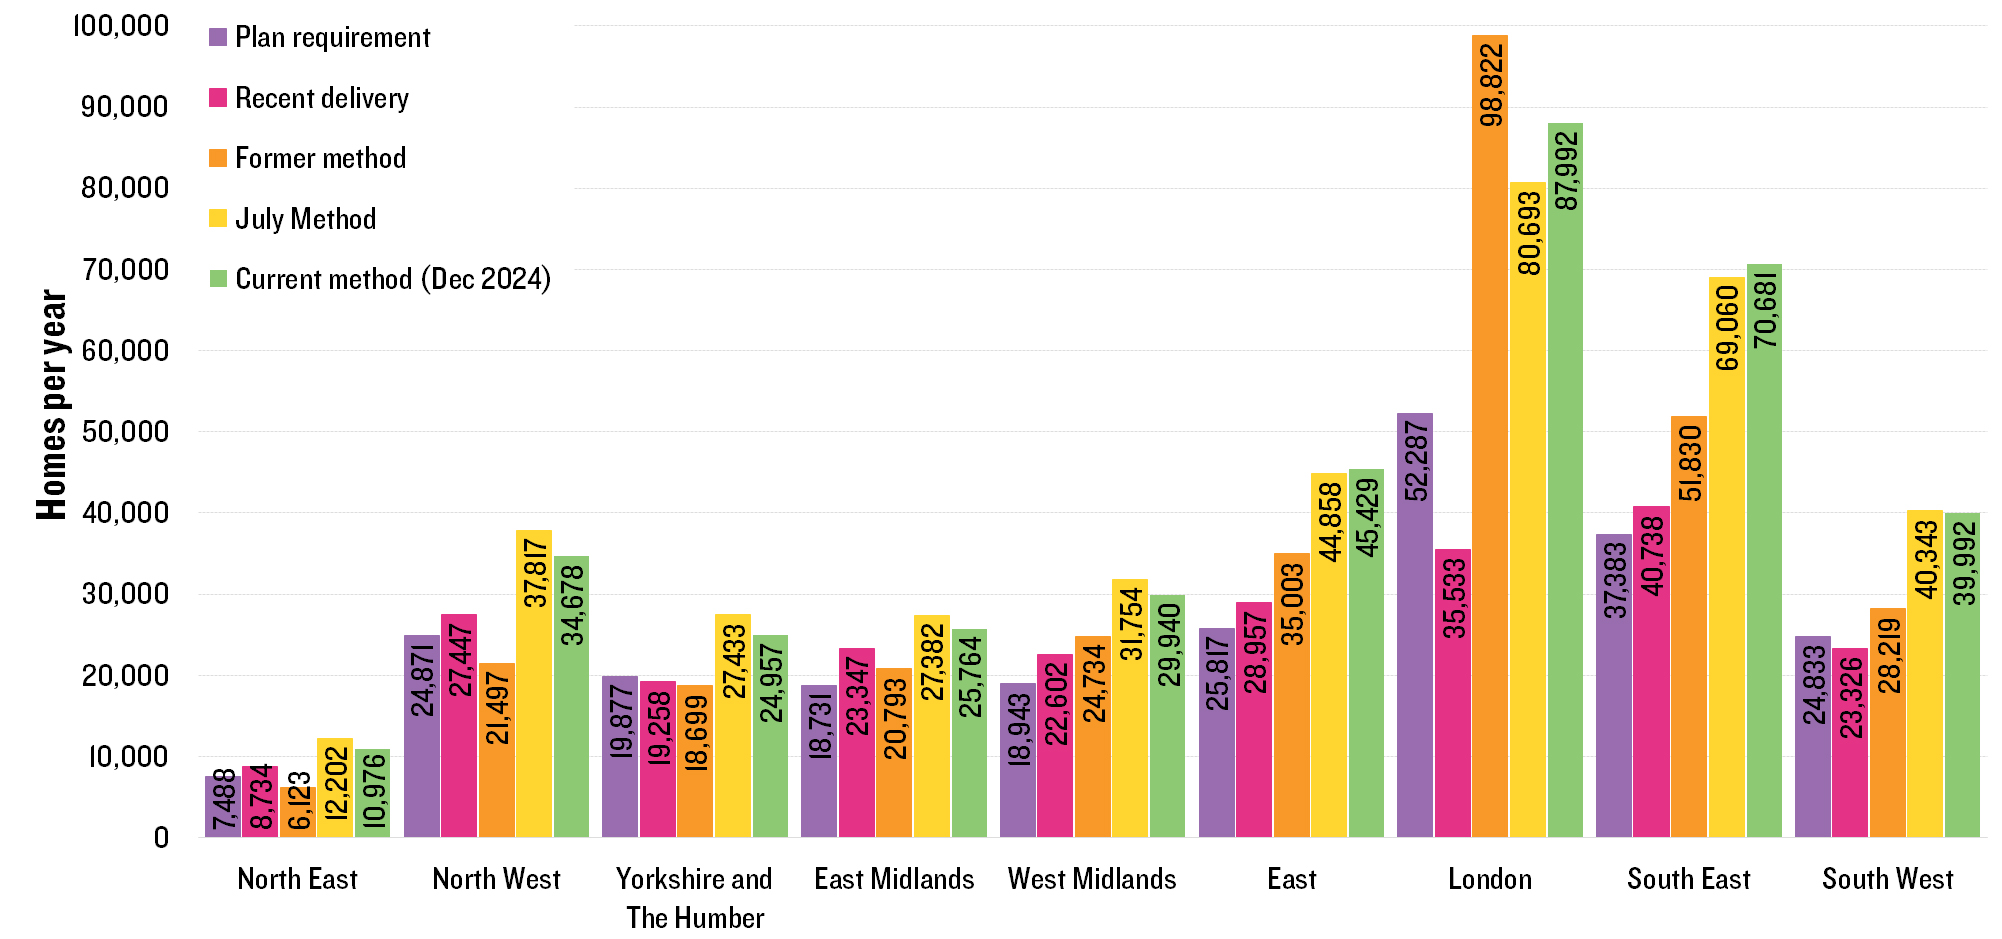
In July, our blog noted that the proposed method was higher than plan requirements, recent delivery and current plans across every region, putting upward pressure on all parts of the country to significantly increase housing delivery (figure 4). Despite the slight shift in housing numbers in the new Standard Method (away from the Midlands/North and towards London/South East), it remains the case that all regions will see housing pressure (above levels of current plans, recent delivery and the current method bar London which is 11% below the previous standard method) as shown in Figure 3. Overall, the new Standard Method is around 60% above plan requirements (ranging from +25% in Yorkshire to 89% in the South East) and 60% above recent delivery (ranging from +10% in the East Midlands to +148% in London).
Figure 3 – Plan requirement, recent delivery, current method, July method and December method by Region.
Source: Lichfields based on local plans, MHCLG Live Table 100, ONS.
When looking at housing distribution by type of area
[1] (full details of which are described in our
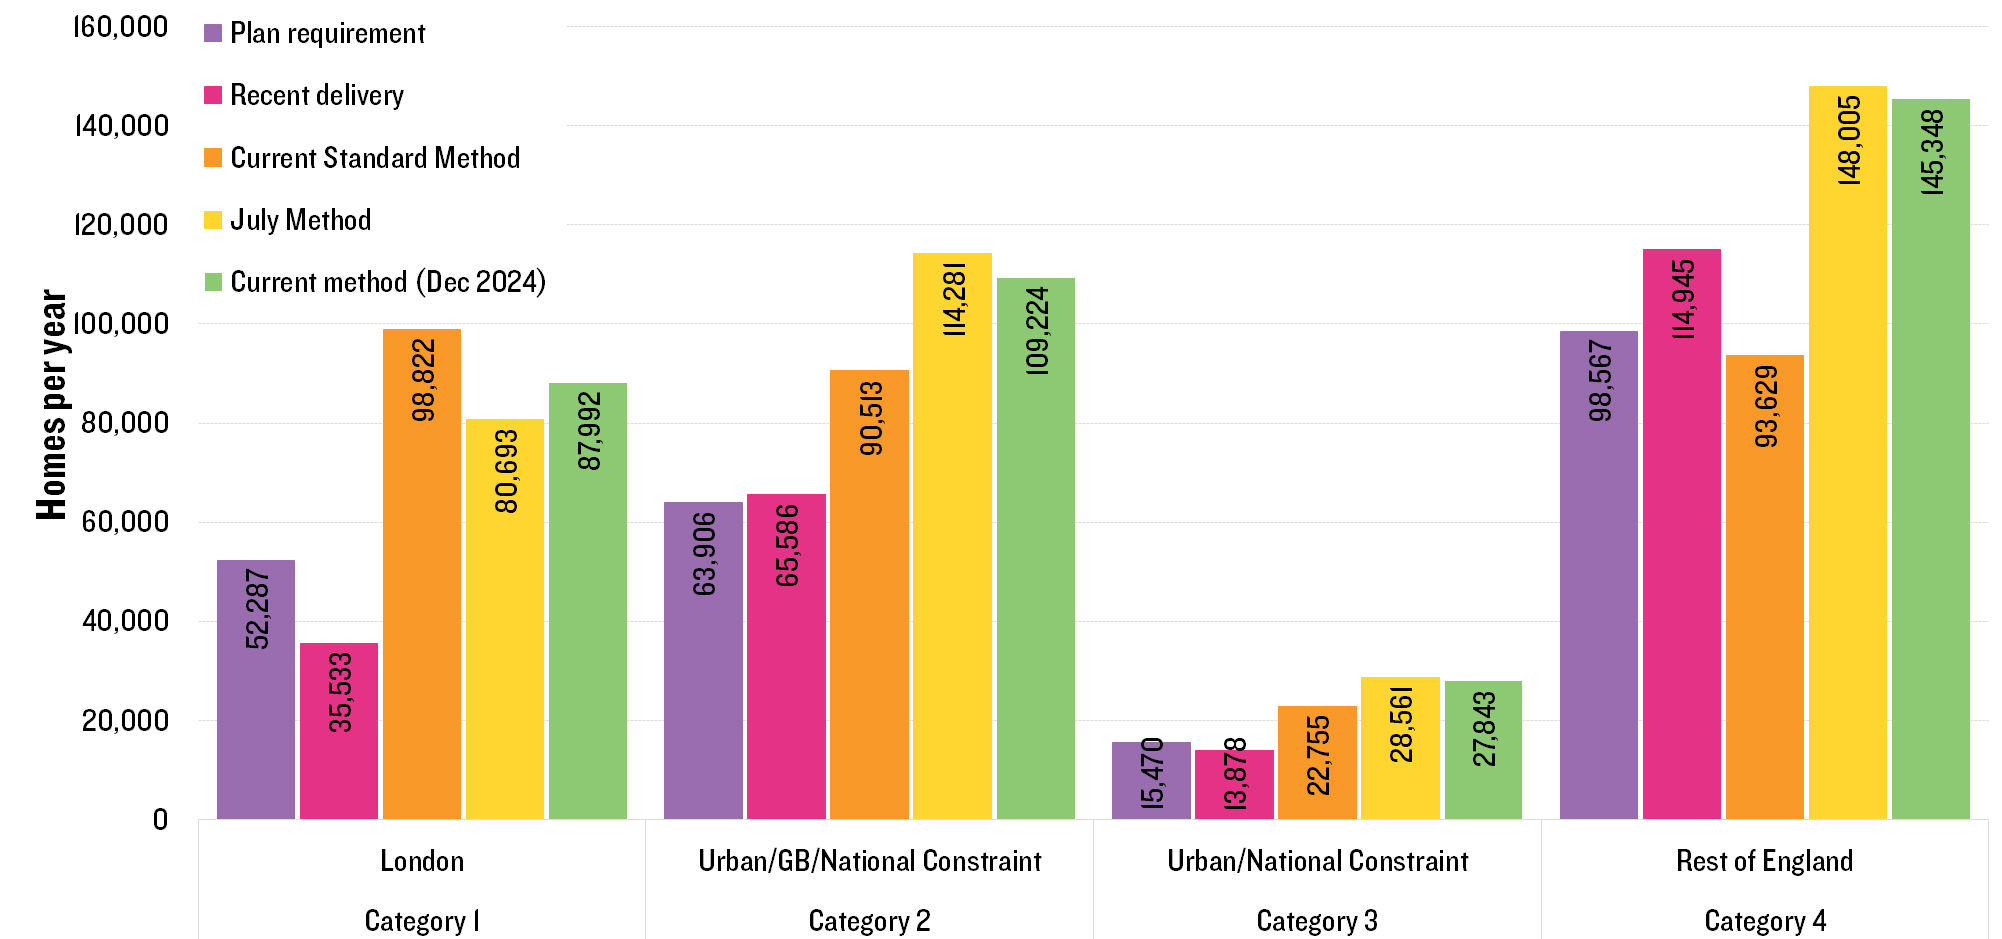
July blog), the uplift in London has been largely balanced by slight decreases elsewhere; on the whole areas which are urban/significantly green belt/other national constraint (e.g. National Park, etc) now have a housing need of just under 109,000, down around 5,000 per year from just over 114,000 in the July Method, as shown in Figure 4.
However this is not equal across the country, with constrained parts of the wider South East seeing increases (with many parts of Essex, Hertfordshire, Surrey and Hampshire seeing increases of between 5% and 10% since July), whilst constrained areas in the rest of the country see decreases.
Looking at London specifically, we previously noted that London has been delivering below the London Plan target, and that although some potential NPPF changes to policy on Green Belt review might drive higher targets and delivery, it remains unknown whether London can or will meet needs in full. Reaching even the current London Plan targets (of 53.2K) by end of the current London Plan target period would be an achievement, and delivery would need to more than double to reach the now published standard method figure of nearly 88,000.
Figure 4 – Plan requirement, recent delivery, current method, July method and December method by Constraint.
Source: Lichfields based on local plans, MHCLG Live Table 100, ONS
Will this achieve Government ambitions for 1.5m?
In July, we noted that, one could see how the [at the time, draft] Standard Method, in combination with proposed NPPF revisions (particularly on duty to cooperate and Green Belt review) had the potential to unlock planning constraints to housebuilding in many locations that have so far capped local plan targets, and to stretch delivery in less constrained areas where current targets are largely already met. The final published method has slightly shifted needs further into London, but there remains upward pressure (when compared with current plans, recent delivery and the current method) across all the regions (bar London which is 11% below the previous standard method).
The importance of setting ambitious housing targets is fundamental to supporting housing delivery; delivery being reliant on land released by the planning system, which is shaped by the targets that are set via a housing need methodology and the national policies of the NPPF that direct how much need is actively planned for in local plans. The Competition and Markets Authority (CMA) found that: “The planning system is exerting a significant downward pressure on the overall number of planning permissions being granted. Over the long-term, the number of permissions being given has been insufficient to support housebuilding at the level required to meet government targets and measures of assessed need.”
In December 2020,
we said about the then current Standard Method was a method that “
with a fair wind, [is] a recipe for maintaining (just) current national rates of housing delivery [of around 230K], but seem unlikely to get England over the 300K hurdle.” In February 2023,
we said that the then proposed changes to the NPPF could lead to a fall to 156K. The draft method published in July 2024 (along with the proposed changes to the NPPF) represented a significant shift in direction, setting targets well above any levels seen in plan-making historically. But, we noted, plan-making takes time, and the hiatus in plan-making in combination with the recent housing market downturn looks set to see rates of house building at 170-190K this coming year (a fact the Secretary of State highlighted in her Parliamentary statement) and recovery will be gradual.
We concluded that the method (published in July) alongside the NPPF is readily consistent with achieving an annual run rate of the 300,000 – something which appears to likely still be the case under the now finalised version of the NPPF.
Despite this positivity, we conclude that we remain unlikely to reach the 1.5m ambition. Even setting aside the practical and market challenges,
until Local Plans are in place housing supply in most areas will be monitored against a target (the SM) that is refreshed each year, with any shortfall from that year wiped clean. This means that the under-delivery against 300K in initial years will not be added to the annual requirement for future years, and planning decisions focused on future delivery will be made based on what is needed to achieve the annual target for five years from that rolling date,
not the beginning of the Parliament. Although a worsening affordability due to prior under-delivery in early years might nudge the standard method figure up slightly, it is unlikely to be sufficient to 'make good' the annual shortfall of 100-150K that will accumulate in the short term leading to planning for a lower overall number Additionally, even with local plans in place, the time taken for planning applications to worth through the planning system and then build out will mean a lag time to delivery.
We therefore conclude on a similar footing to in July, increasing ‘mandatory targets’ will be a vital lever to plan for and deliver more homes. It is possible that taken together with the other measures the Government have implemented, including the new NPPF, to a delivery rate of 300,000 by the end of the Parliament is achievable. This would be a significant uplift from recent rates, especially the low point of this year, and an achievement with which the Government could be justifiably pleased.
Footnotes
[1] Category 1: London (the area covered by the Mayor’s London Plan).
Category 2: LPAs where their administrative area is mostly built-up and/or constrained with a significant amount of Green Belt. This is in the context that the NPPF proposes to make brownfield development within settlements acceptable in principle and – most significantly - to compel reviews of the Green Belt and for ‘Grey Belt’ to be capable of development in situations where there is no five year land supply or the Housing Delivery Test (HDT) result is below 75%.
Category 3: LPAs where the administrative area is mostly built up and/or constrained by other national constraints (e.g. national landscapes) for which there is no fundamental change of policy.
Category 4: LPAs in the rest of England – i.e. areas which are unlikely to have fundamental other national policy constraints.


