The Government’s consultation on a new National Planning Policy Framework (NPPF) includes its much vaunted policy to allow for more development of land around train stations in England. This responds – at long last – to the Chancellor’s long trailed ambition for the policy to unlock untapped land near commuter transport hubs for housing
[1]. The policy followed a promulgation of the idea by a series of think tanks and others over decades
[2].
In this blog we explain the new policy and make an initial analysis of its potential, focused on the land it might unlock outside settlement boundaries.
The proposed policy sits under the overarching shift within the National Decision-Making Policies (NDMP) to
reform and strengthen the presumption in favour of development. There are three limbs to the proposed policy across the relevant NDMPs by which development within reasonable walking distance of a railway stations can qualify for what is intended to be a clear pathway to securing a permission, as illustrated in the table below.
Table 1: Rail Station NDMP Policies – Qualifying thresholds and requirements
|
|
Land within settlements
|
Land outside settlements
|
Land in the Green Belt
|
| NDMP |
S4 |
S5 |
GB7 |
| Economic geography |
Any |
Station falls within top 60 Travel to Work Areas by GVA |
| Frequency |
Any |
‘Well connected’: Four trains an hour or two in one direction across the daytime. |
| Necessary to demonstrate unmet need? |
No |
| Other requirements? |
|
Would be physically well-related to a railway station or a settlement within which the station is located; is of a scale which can be accommodated taking into account the existing or proposed availability of infrastructure; and where the development would not prejudice any proposals for long comprehensive development in the same location. |
Would be physically well-related to a railway station or a settlement within which the station is located; be of a scale which can be accommodated taking into account the existing or proposed availability of infrastructure; not prejudice any proposals for long-term comprehensive development in the same location; in the case of major development, comply with policy GB8 (Golden Rules) including affordable housing. |
| Minimum density requirements? (Policy L3) |
50 dph at well-connected stations / 40 dph elsewhere |
50 dph |
50 dph |
| Qualifying station benefits from presumption in favour of sustainable development? |
Yes. Development should be approved unless the adverse impacts substantially outweigh the benefits (Policy S4 or S5(1) or S5(5)) |
In simple terms, within settlement boundaries or on land around ‘well connected’ stations outside settlement boundaries, the strengthened presumption in favour of sustainable development would be permanently ‘switched on’ provided the proposal meets density and other basic planning requirements, including the ‘Golden Rules’ where the site is in Green Belt. The policy applies even if the Green Belt in question is not ‘grey belt’.
This is not a free pass for unacceptable development: the tilted balance presumption in favour of sustainable development is applied with reference to how the proposal performs against all NDMPs, including being well designed (Policy DP3), improving the natural environment (Policy N2) and securing the conservation and enhancement of heritage assets (Policy HE4). A series of policies (TC3, M5, L3, DP3, HC5, F6, N2, N6, HE6) identify specific circumstances in which a development "should be refused".
Broadly, within a suite of policies aimed at increasing the supply of land for housing and other mixed use development, the policy is plausibly directed towards delivering homes and other mixed uses in sustainable, commuter-friendly locations – prime to support economic growth and agglomeration benefits.
However, the qualifying criteria for stations to be ‘well connected’ outside settlement boundaries will be an important driver of the effect of the policy in unlocking development. This is because the larger quantities of undeveloped and/or available land for development around railway stations is more likely to exist where it is outside settlement boundaries. The 2019 work by Centre for Cities found that releasing all land without a designation for amenity or environmental value within 800 metres of any stations with a service of around 45 minutes to a major city would provide an additional 47,000 hectares in just five city-regions equivalent to 2.1m homes.
[3]
In this blog, we have carried out some (high level) analysis to explore the extent to which the new NDMPs for development of land around train stations outside settlement boundaries might open up new land for development, based on the two key qualifying criteria in Policy SP5 (footnote 26) and GB7 (footnote 52):
- The productivity (Gross Value Added, GVA) of travel to work areas (TTWAs); and
- Train service frequency.
How much land is opened up? Will the policy achieve the desired impact, or will some of the potential be left stuck between stations?
We conclude the proposed policy could unlock development potential equivalent to 632,600 homes on land at rail stations outside settlement boundaries. However, the thresholds are relatively restrictive, notably by creating a ‘frequency trap’, and up to 854,000 further homes (1.5m in total) might be possible if criteria were widened to include currently lower-frequency stations and 20 additional travel-to-work areas.
We explain our findings with reference to analysis of the two qualifying criteria.
1. What is a productive area? The TTWA approach
The policy is focused on train stations in the most productive areas defined as being within a TTWA ranked in the top 60 measured by GVA
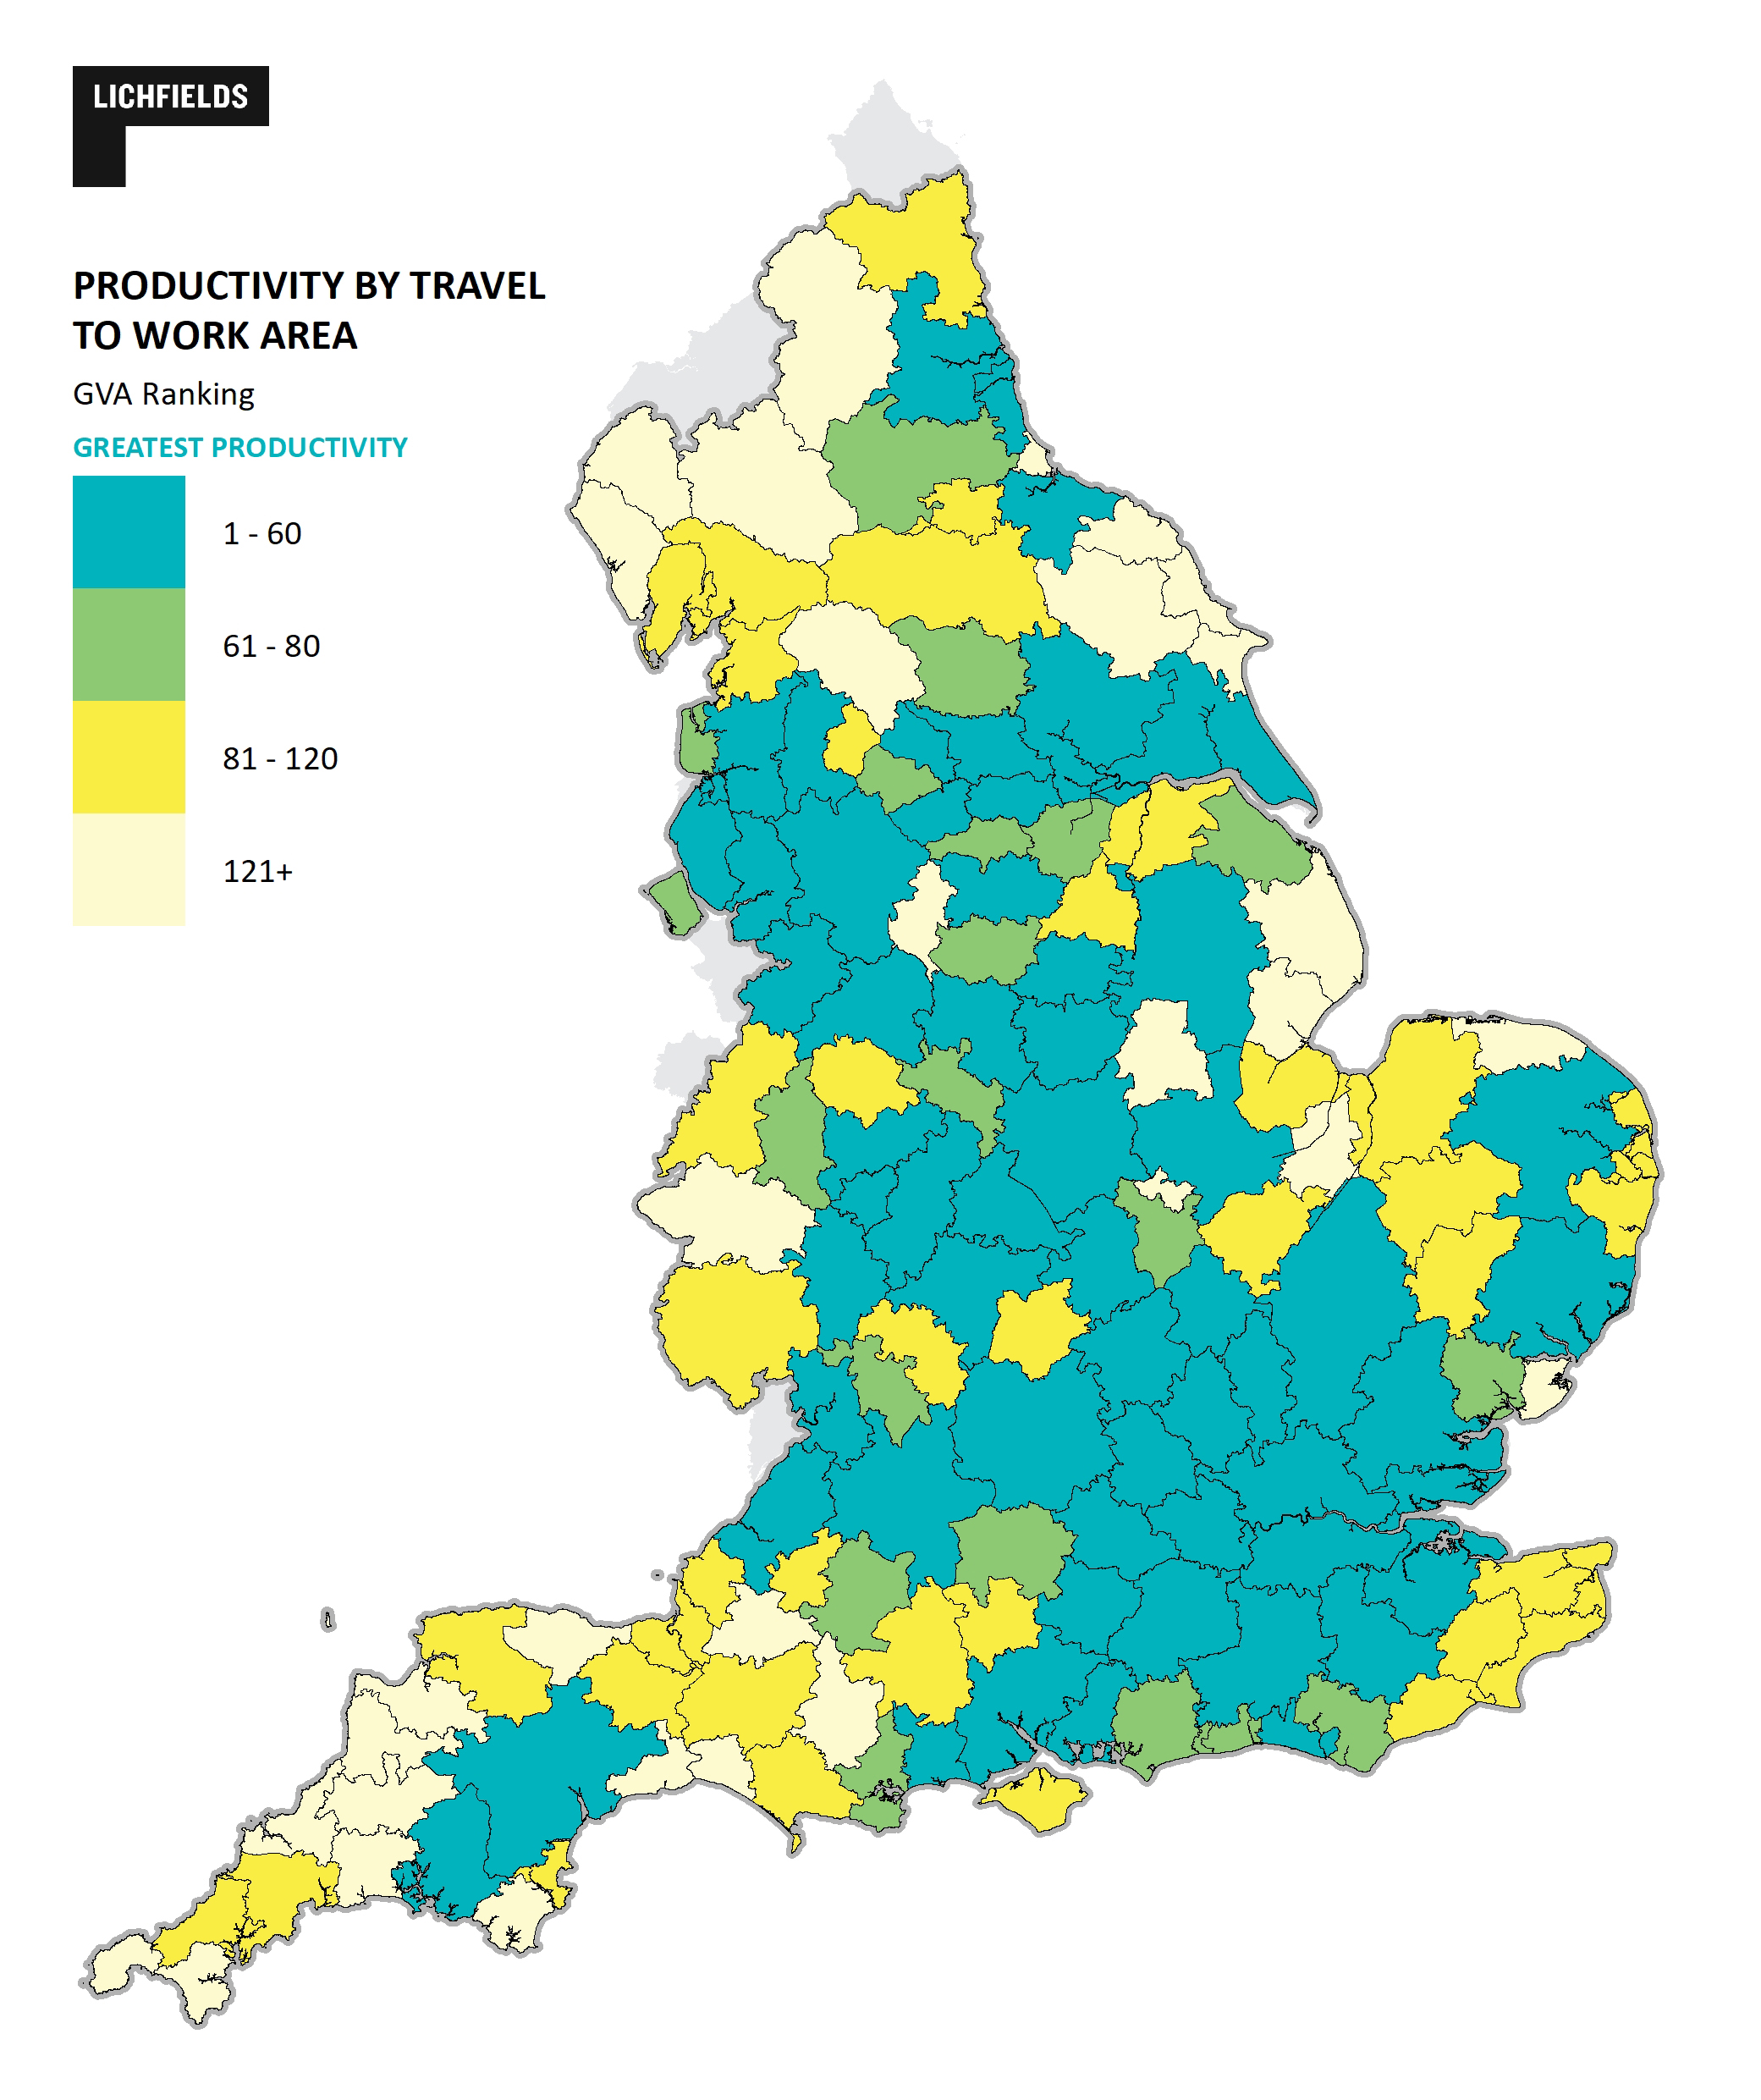
[4]. The relevant areas are shown in Figure 1.
Figure 1 – Travel To Work Area by total productivity (GVA).
The TTWA criterion is an attempt to apply some measure of whether development around a station outside a settlement will support the benefits of economic agglomeration by expanding the effective size of our more productive areas, making it easier for commuters to access jobs, helping businesses secure a better matching of workers with employment, closer proximity between suppliers and buyers of goods and services, and opportunities for workers to learn from the experience and productivity of their peers
[5].
However, limiting the policy to the top 60 TTWAs threshold inevitably introduces a ‘cliff effect’ where some areas (including those which might be close to a major city) might not meet the GVA top 60 threshold despite their potential to benefit from providing homes for productive commuters.
It also leads to outcomes where TTWA might qualify but another with locations that might appear equally suitable for the policy, misses out. For example, Cheltenham is not in the most productive 60 TTWAs and therefore does not make the grade but neighbouring Swindon and Gloucester do. This is despite Cheltenham’s TTWA being equidistant by rail from Bristol (on the right train) and Birmingham. Newbury TTWA similarly misses out whereas neighbouring Reading and Oxford are amongst the most productive TTWAs in the country by GVA. Commuter lines into London from Kent also miss the cut (Figure 2).
Figure 2 – Travel To Work Area ranked by productivity (Total Gross Value Added 2023, £m).
As ever, by applying a threshold there are winners and losers. Not all of these are obviously intuitive. Partly this is inevitable concomitant of how TTWAs are defined. Currently, TTWAs rely on travel patterns in 2011 by Newcastle University’s CURD team, with a calculation that attempts a best fit of drawing boundaries where, generally, at least 75% of residents live and work and there is a working population of at last 3,500. Areas with a working population in excess of 25,000 can have lower self-containment rates (as low as 66.7%)
[6]. It is a helpful analytical tool but does come with issues in policy terms. Planning Practice Guidance (PPG) expressly says there is no standard approach to the definition of functional economic market areas, with TTWAs just one of eight factors to take into account when defining housing market areas.
[7]
There would be difficulties updating TTWAs with reference to Census 2021 because it expressly cautions users against using for planning and policy purposes as it was recorded under the COVID lockdown conditions.
[8]
Spatially, this means that stations close to cities – but that are classified as a separate TTWA – that could be viably sustainable locations will not always be unlocked by the policy – one source of ‘missing stations’.
A reasonable tweak to the policy’s definition of economically productive area (e.g. to include the top 80) might be considered to achieve this.
2. What is a ‘well connected’ station? The frequency approach
The draft NDMP proposes eligible stations are those which have either (i) four departures an hour or (ii) two in one direction through the daytime. This is a measure of connectivity, and thus the extent to which those living there would be likely to use the railway to access productive labour markets. While there is logic to this, there are again challenges to a threshold approach.
The stations with most development potential outside built up areas often have less existing passenger demand – in many cases a result of not having sufficiently dense existing housing. This means rail companies likely operate lower frequencies – often under the Policies’ threshold for eligibility. This was compounded by the post-COVID reduction in timetabled services on more marginal routes, which can include routes being withdrawn or frequencies reducing outside peak times
[9]. In simple terms, many rural stations with underdeveloped catchments, might operate four services an hour only at peak times and not throughout the day.
The policy addresses this by including a reference in Footnote 26 and 52 to including stations that “
have a reasonable prospect of being served due to planned upgrades or through agreement with the rail operator).” This will need further consideration and will rely upon amenable and engaged rail operating companies. Experience suggests they are not always likely to formally plan or agree to upgraded frequencies unless and until development is already proposed or committed in those locations, creating a potential circular ‘frequency trap’ for evidence-based decision making
[10].
To get a broad measure of which stations the proposed frequency limit might unlock, we have taken Network Rail departure numbers for all stations and placed each station into three thresholds: 64+ per day; 44-63 per day; 32-43 per day. This is an imperfect measure of the NDMP’s more nuanced criteria (which would require a review of departure data by hour across all rail stations). However, it provides a reasonable ‘best fit’ for assessing the policy impact
[11].
Our analysis shows the station eligibility criteria has a proportionately greater impact than shifting the TTWA threshold to include more geographies. As we might expect, the frequency trap excludes a significant number of stations that could have the most potential for new homes, as they might typically be areas with a lower catchment population (and lower train travelling population). The Urban Task Force report flagged a similar issue in 2009
[12].
With a population of 2.3 people per new household, each development of 2,000 homes (that might be achieved from unlocking a third of the area, measured at 800m radius around a station), is equivalent to adding a population of 4,600 people (i.e. equivalent to a small town). Such an increase in population could have a meaningful impact on passenger demand to that station.
Bringing it together: What does this mean for new homes?
We combine the impact of the two criteria in Figure 3 which plots the stations by departures per day and the ranking of their TTWA. For speed of analysis our data on frequency covered all stations, including those within urban areas, but for the purposes of identifying land unlocked outside settlement boundaries, our spatial analysis excluded all land that was built up or designated (such as local open space, playing fields, parks), and is thus a reasonable proxy for land that might be capable of release under Policy S5 and GB7.
Figure 3 – Scatterplot of all stations, by region and criteria cut offs. Size of bubble indicates area of land potentially unlocked.
NB: The vertical Y axis has a logarithmic scale.
Our analysis shows the success – measured by amount of land unlocked, and thus homes delivered – of the current policy wording is highly dependent on the ability of applicants to demonstrate that their development will unlock additional train services by virtue of increased passenger demand. This is because of the large number of stations with lower frequency services that are nevertheless in the most productive and potentially sustainable locations. Broadly, these are the stations shown in Figure 3 that are below the horizontal and to the left of the vertical policy cutoff lines on the scatterplot). These are the areas near stations that might benefit from a widening of eligibility.
We have taken a high-level look at the land implications and number of homes the current policy wording might unlock and conclude that, based on current service levels and TTWA thresholds that it will unlock 21,100 hectares 630,000 homes.
This estimate is based on mapping all undeveloped land (i.e. classified by the Ordinance Survey as non-built up) within 800 metres of a station (a proxy for reasonable walking distance) that is not subject to the key national planning constraints
[13]. For the purposes of a national analysis, we considered all land around all the stations that might be eligible. As described above, for GIS mapping purposes, this might include some small amounts of non-built up land within settlement boundaries, but this is likely to be relatively limited as will not include land that is already built up or protected (such as local open space, playing fields, parks). Some manual adjustments have been made to exclude obvious outliers within urban areas.
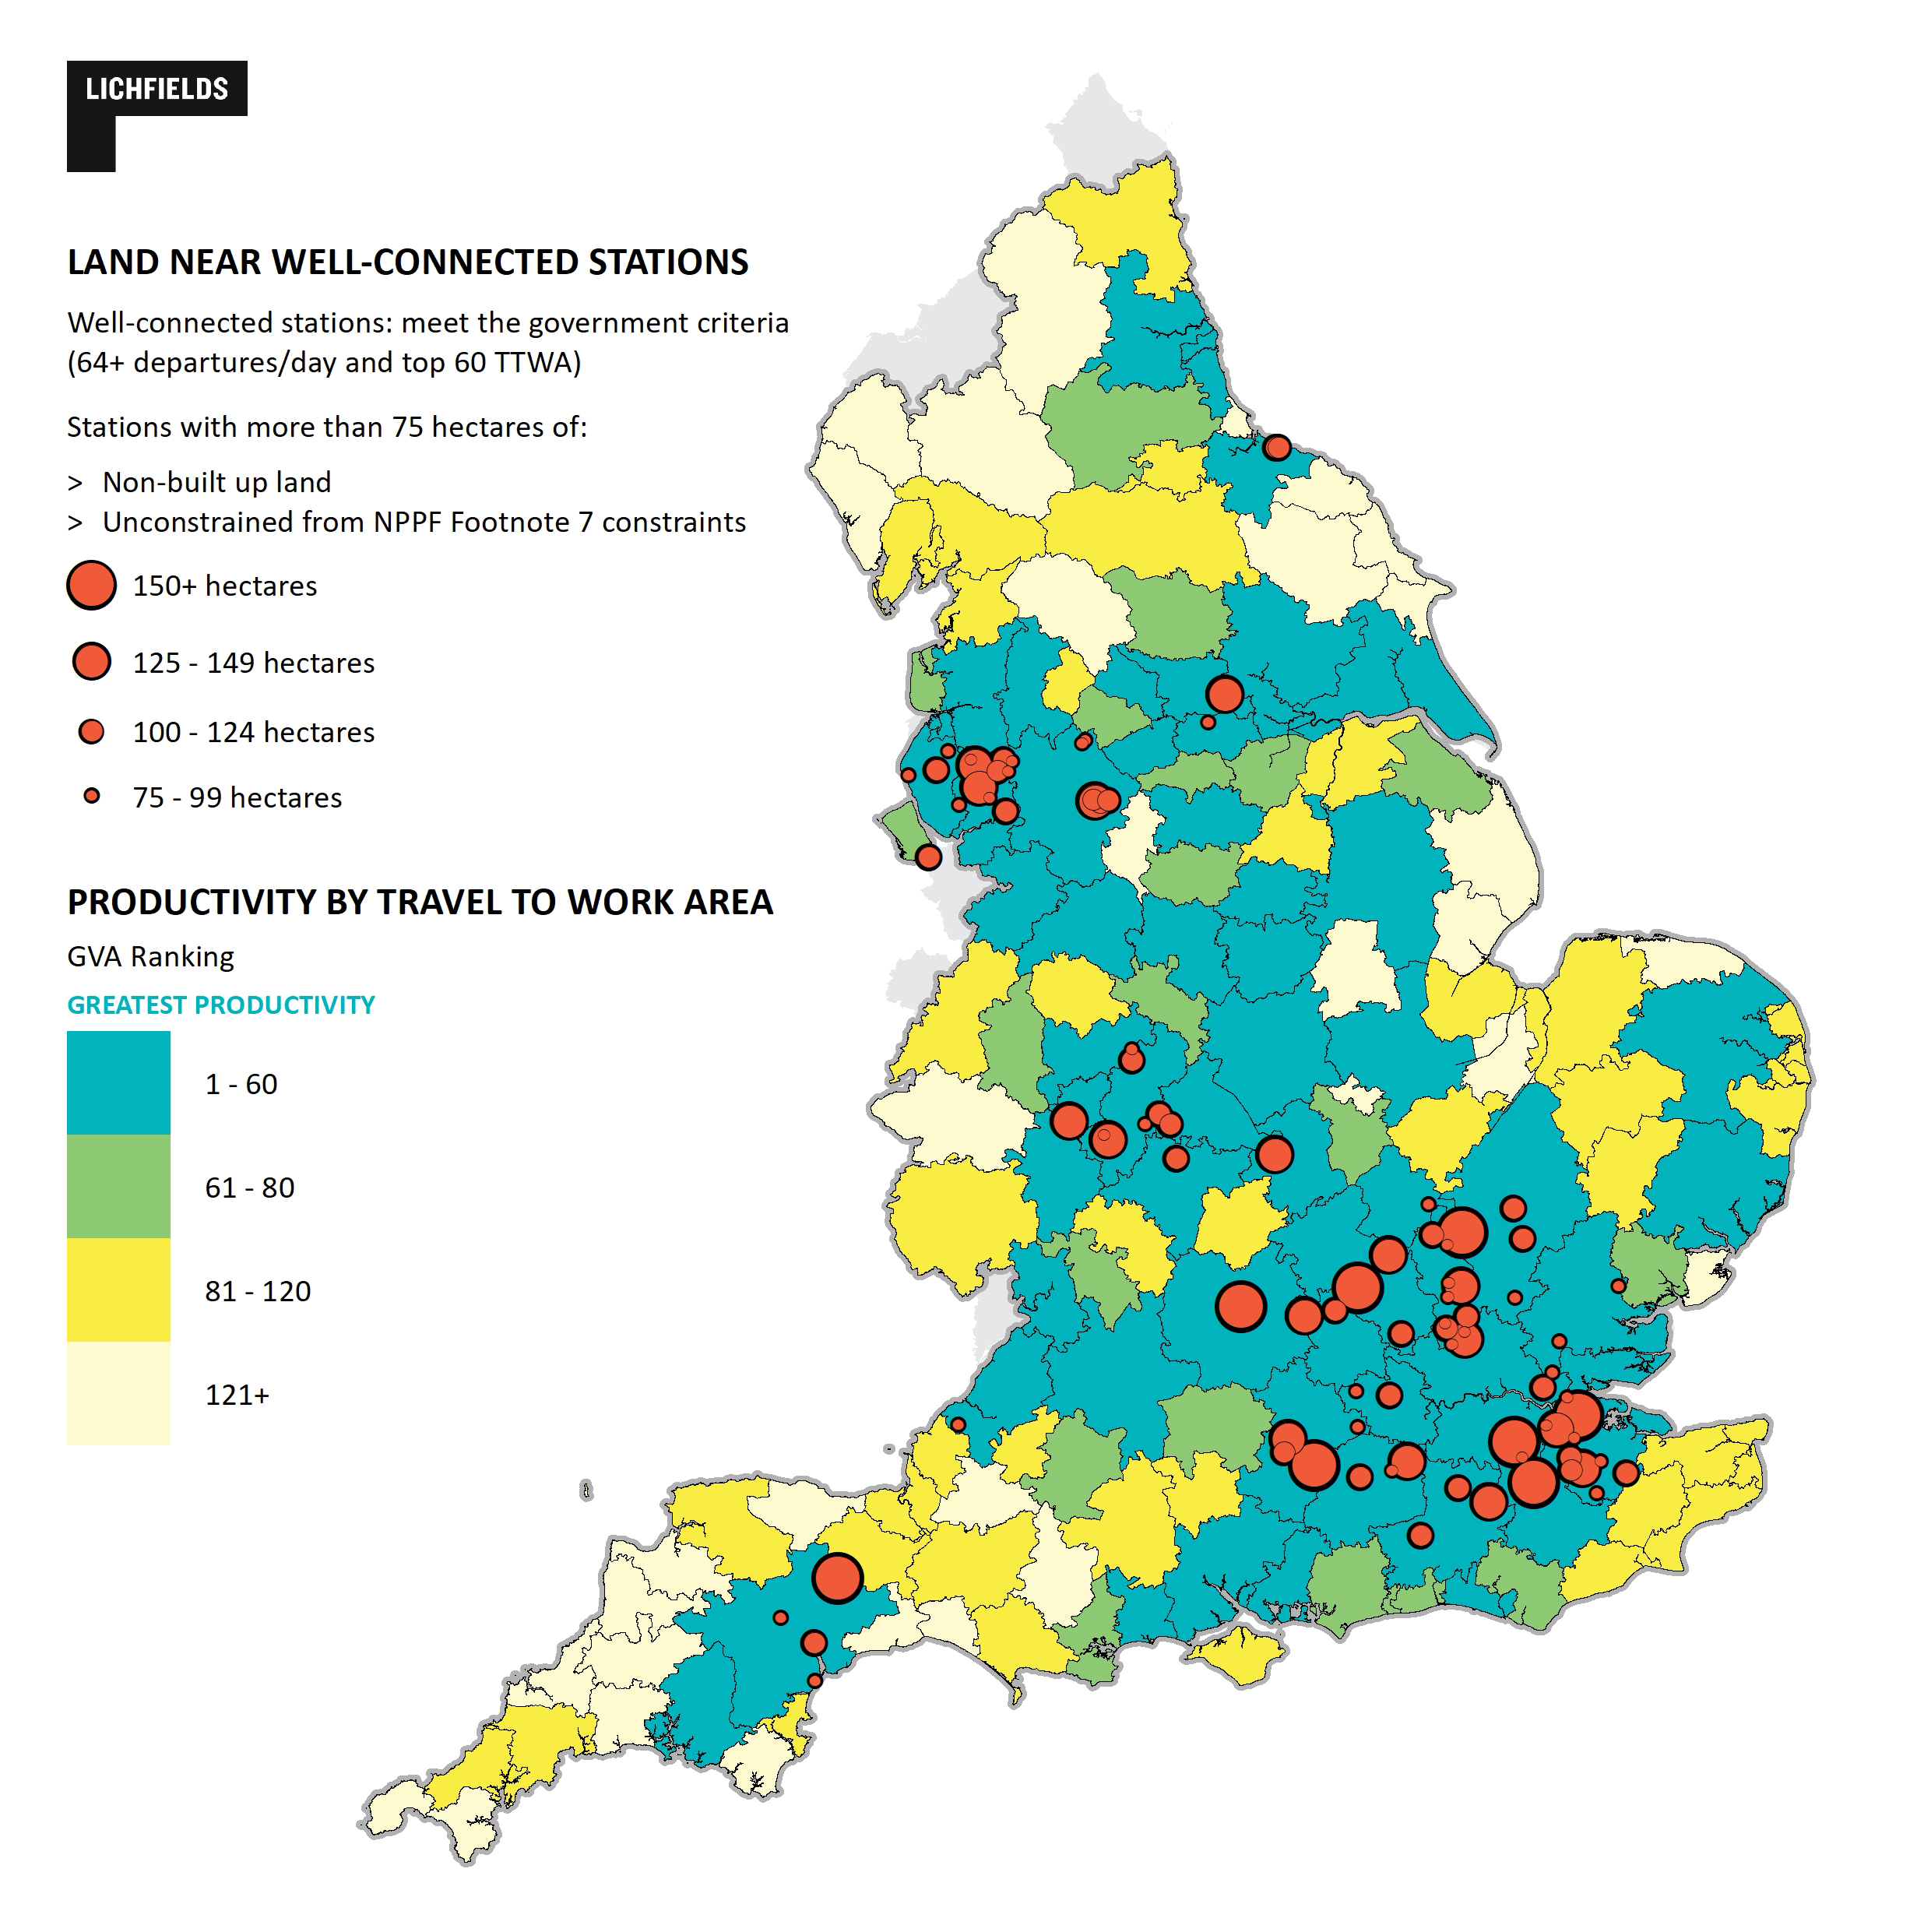
The results for stations more likely to meet the current train frequency and TTWA criteria and with 75+ hectares of land are shown in Figure 4.
Figure 4. Land unlocked by NDMP for ‘well connected’ train stations.
To understand what this means for new homes we made some further broad calculations. The plot ratios and densities across sites around stations will vary depending on their position, site shape, shape, market conditions, infrastructure needs etc. However, for this high level exercise, we have assumed that the land could be developed at a 60% site ratio (to account for open space, infrastructure etc.) with 50 dwellings per hectare (dph) on the net developable area – this is the minimum density set in the proposed policy L3. Clearly, the precise number of homes will depend on the circumstances of individual sites; smaller sites might support high net developable areas and/or higher densities. Equally, across larger sites, it might not always be practicable to achieve 50 dph across the board to reflect both local landscape or character considerations or higher densities.
Figure 5 shows the breakdown of the 632,600 homes by region under the proposed policy criteria. The dropdown at the top of the graph can be used to show the impact of different policy configurations in different regions – less well connected areas such as the East and West Midlands, and areas where productivity tends to be lower such as the South West and North East, particularly benefit from the expanded thresholds.
Figure 5 Potential homes around stations in catchment area by region (Customisable by departures per day and TTWA productivity thresholds)
632,600 homes might seem a lot, but of course not all land will turn out to be available for development and there may be site-specific reasons that make development unfeasible in particular places.
It also appears likely that many stations with available land within reasonable walking distance will fall below the frequency threshold or outside the top 60 TTWAs. The 632,600 homes identified does not come close to the 2.1 million around five cities identified by the 2019 Centre for Cities analysis
[14].
To understand the potential implications of shifting the thresholds in the policy – for train frequency (to 44 or 32 departures a day) or TTWA threshold (to top 80 or 120 by GVA) – we modelled how many extra stations, land and development potential might be unlocked. The results are shown in Table 2 below.
Table 2: Land and homes unlocked at different TTWA and Departure Thresholds
|
Criteria
|
| TTWA |
Departures |
Land (ha) |
Potential homes |
| 60 |
64 |
21,100 |
632,600 |
| 60 |
44 |
28,600 |
857.400 |
| 60 |
32 |
43,800 |
1,314,000 |
| 80 |
64 |
24,000 |
719,200 |
| 80 |
44 |
32,300 |
969,500 |
| 80 |
32 |
49,600 |
1,487,000 |
These are indicative numbers intended to give an indication of the scale of difference arising from making adjustments to the thresholds. In simple terms, if the criteria was more flexibly set, by allowing stations to qualify with at least one service an hour (and potentially capable of seeing an increased service if demand increased) and in the top 60 TTWAs, the theoretical opportunity is more than doubled, to 1.3m homes compared to the currently proposed criteria. If the policy criterion was widened to the top 80 TTWAs by productivity, the total potential becomes nearly 1.5 million homes unlocked.
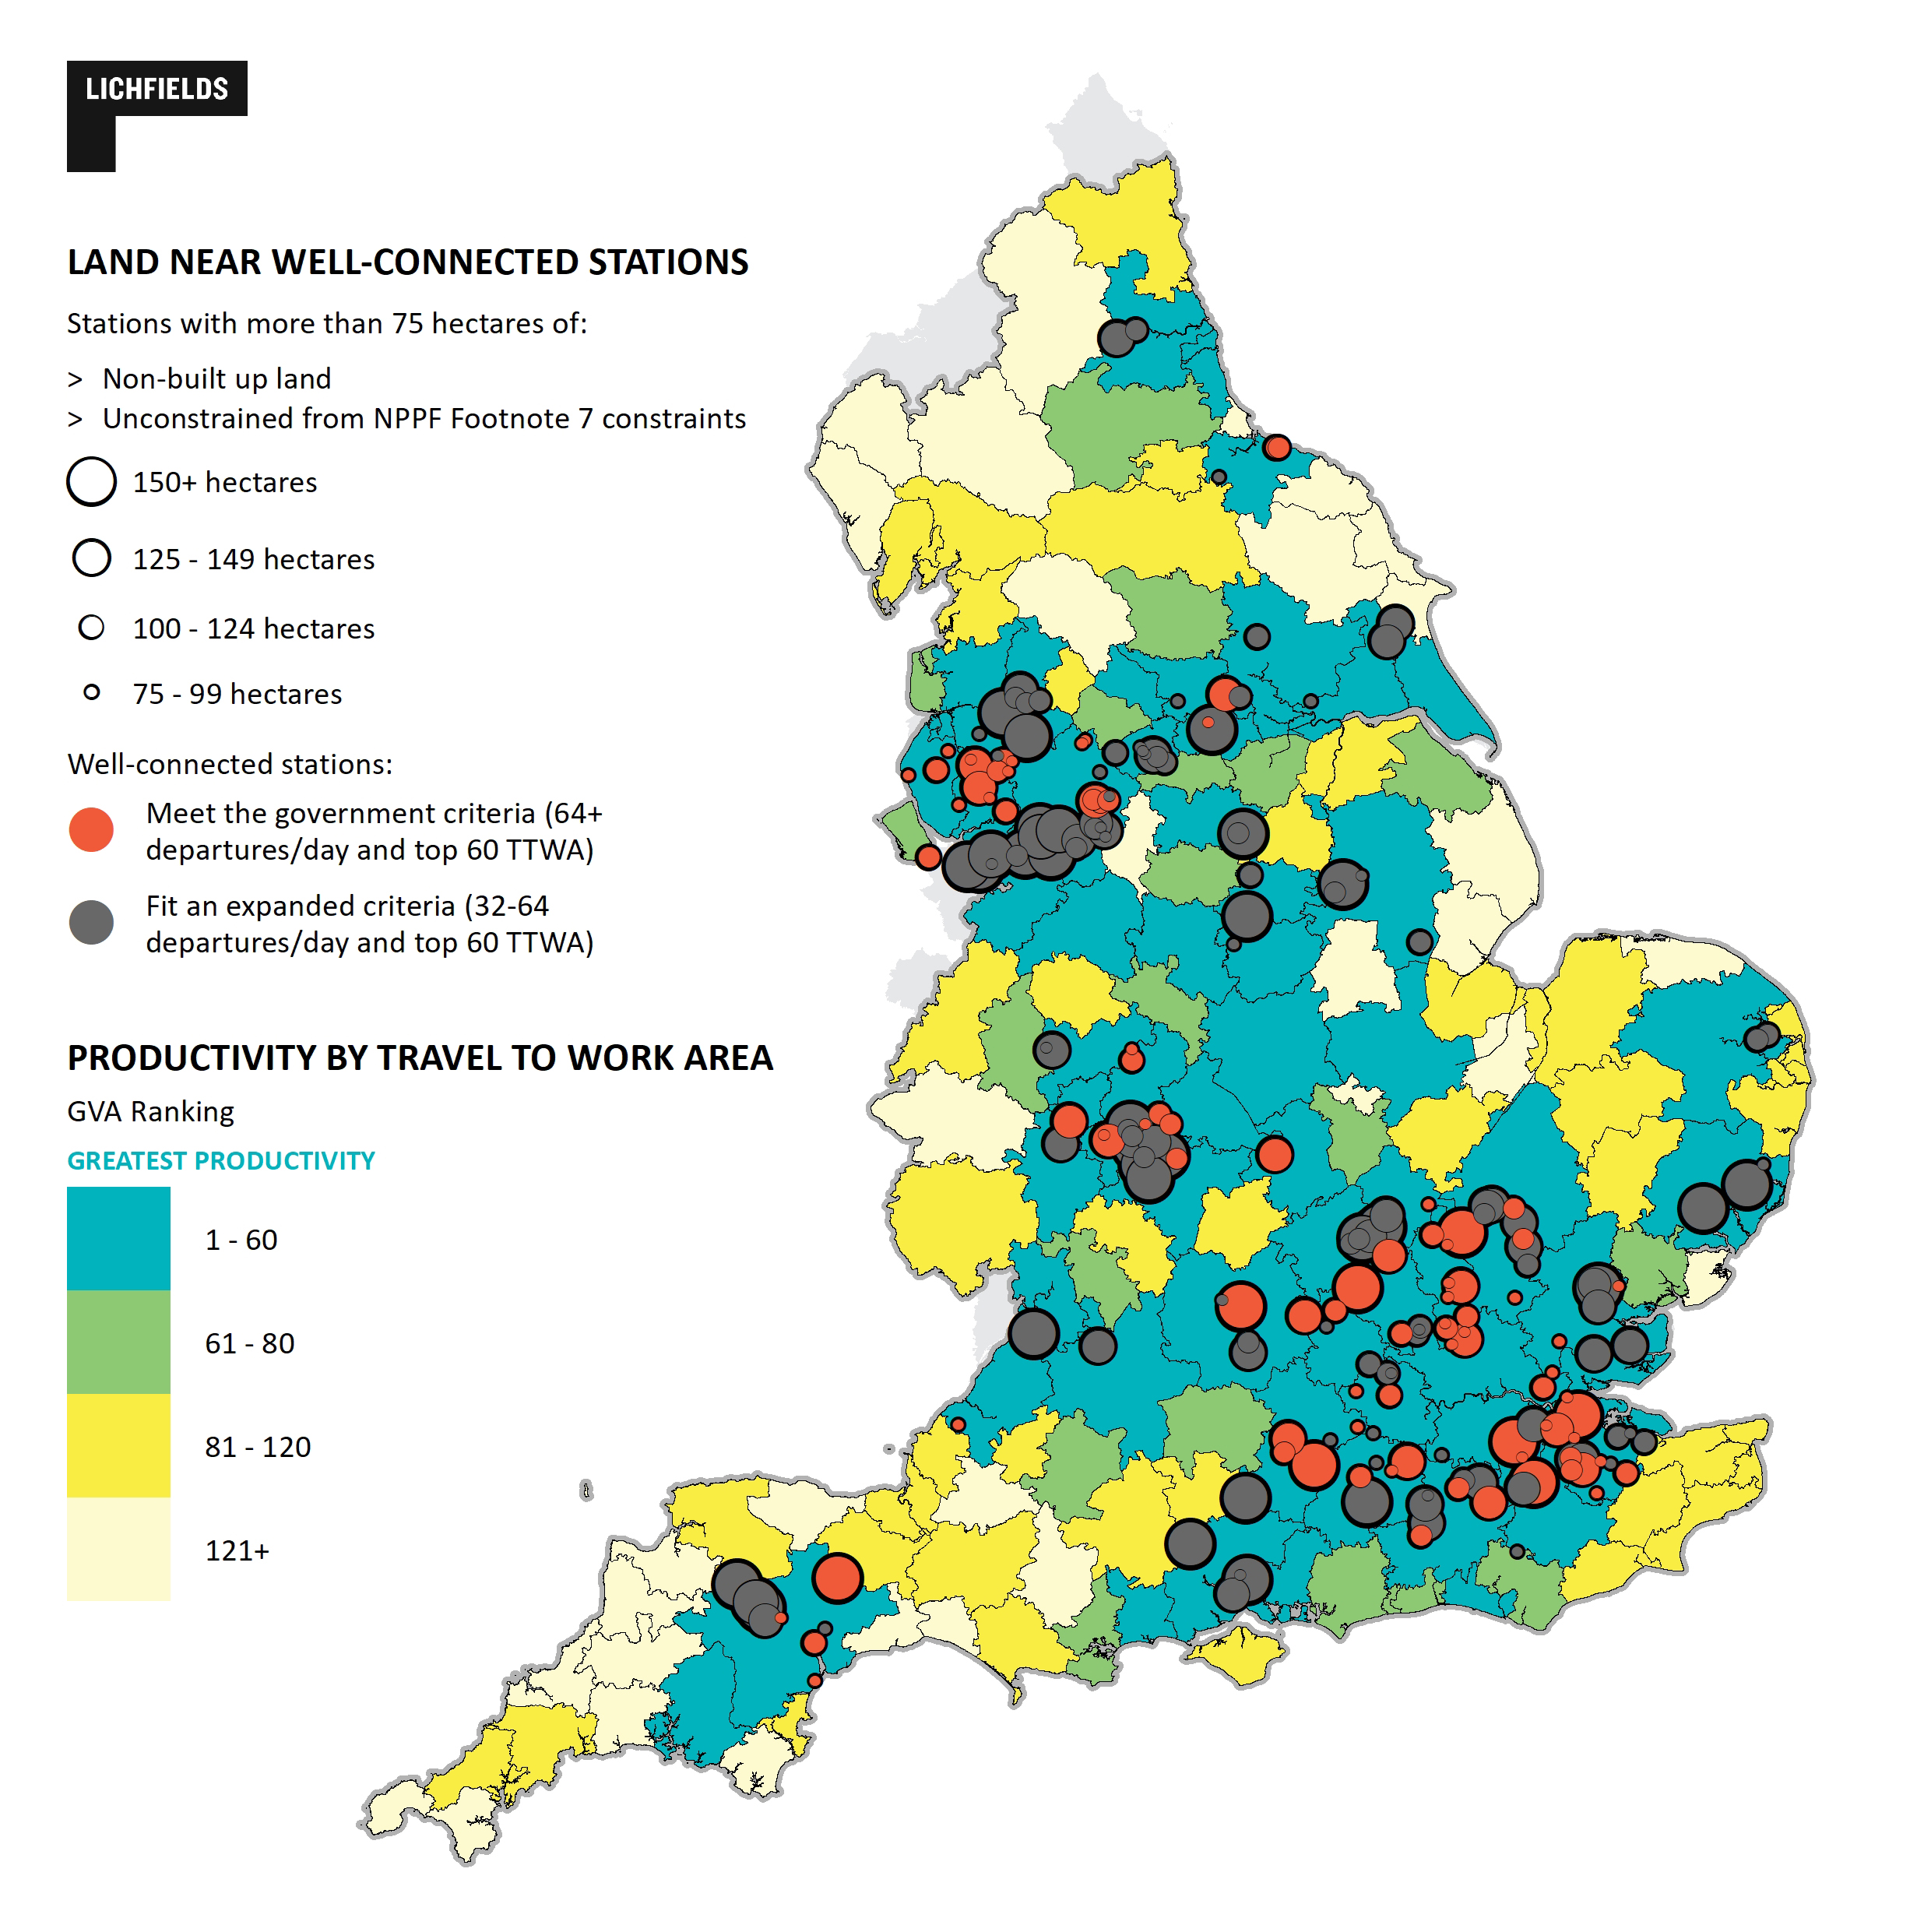
The spatial implications of expanding the departure criteria to 32 per day (within the top 60 TTWAs) is shown in Figure 6.
Figure 6 – Land unlocked by an NDMP for well-connected train stations with different departure criteria.
Conclusion: Does this policy meet its aims?
The Chancellor trailed this policy in January and November 2025 with reference to the idea of a ‘default yes’ for development around rail stations to unlock “tens of thousands of new homes”.
Our high-level analysis illustrates – in broad terms - the potential implications of the proposed policy as articulated, and with a particular focus on stations outside settlement boundaries, under NDMP S5 and GB7.
By switching on the reformed presumption in favour of sustainable development irrespective of the five year land supply or HDT position, the NPPF proposals would result in many rail stations having their development potential unlocked overnight. The total theoretical potential – based on current train frequencies – is estimate at around 630,000 homes; certainly reflecting the “tens of thousands” quantifier in earlier press briefings.
However, not all of the land capacity will automatically be suitable or immediately available, and it leaves the potential of many ‘missing stations’ constrained by the frequency trap unless developers can persuade rail operating companies to show willing by planning or agreeing to upgrades that increase train frequencies at currently under-used stations in response to the increased demand, and for planning decision makers to respond positively to what the rail industry might say about the future prospect of them doing so.
Inevitably, reliance on rail operators adds an element of uncertainty for developers and planning authorities in applying the policy. Some further thought might be given to the wording of that forward looking provision.
Our modelling suggests potential for up to 850,000 additional homes could be unlocked by widening the frequency criteria to include stations with a current frequency of one train an hour in each direction across the daytime (i.e. 32 per day) and include the next 20-most productive TTWAs. Expanded the criteria, would likely include some ‘missing stations’ that currently provide two trains in one direction at peak times, even if not during the day and provide the platform for significant new communities that would unlock commuter passenger demand and see increased train frequencies.
| |
|
|
| |
 |
|
| |
|
|
| |
National policy consultation 2025
Our web resource brings together Lichfields' analysis of the Government’s Draft National Planning Policy Framework consultation and other proposed reforms affecting the development industry
|
|
| |
|
|
Footnotes
[1] HMT Press Release on the Chancellor’s speech on “bold reforms to the planning system” dated 26th January 2025 available here and a further announcement on 18th November here [2] For example, the House of Lords Built Environment Committee Report: Meeting housing demand 1st Report of Session 2021-22 which referred to work by Centre for Cities available here authored by Professor Paul Cheshire (LSE) and Boyana Buyuklieva (UCL . The RTPI – whilst not calling for rail station-focused development per se – used a benchmark of 800 metres from a railway, light rail or metro station, to measure the sustainability of development approved under the NPPF as part of its Location of Development series. In 1999, the Urban Task Force report – focusing on transport hubs within urban areas – concluded: “At the same time we need to make sure that transport hubs benefit from the maximum catchment population possible to sustain existing services. … we must ensure that we prioritise development opportunities on the basis of their proximity to the existing and potential public transport networks.” [3] See Centre for Cities work here. The density calculations assume a development platform of 90% and 50 dwellings per hectare, which is probably not realistic. [4] Travel to Work Areas using ONS definitions available here [5] Henderson and Thisse, Handbook of Regional and Urban Economics, Chapter 48: Micro-foundations of Urban Agglomeration Economies, Elsevier, 2004 [6] The ONS provides a summary description of its approach to TTWAs here [7] See ID: 61-019-20190315
[8] See the ONS commentary on pandemic impacts on questionnaire guidance, available here [9] BBC Train services down by a fifth after Covid slump, 17th February 2022 [10] Not dissimilar in concept to the ‘Sustainability Trap’ identified for rural villages by The Taylor Review of Rural Economy and Affordable Housing in 2008.
[11] The data is not a perfect measure but gives an indication and probably the only workable format given that departure frequency varies between peak and off-peak hours. To convert to departures per hour we divided the daily figure by 16, since trains run between 6 a.m. and 10 p.m. in most stations and put into thresholds we can be reasonably confident that those running 64 or more trains per day meet the policy criteria, while some stations running between 44–63 trains per day might also meet the criteria if they run trains for shorter hours or if their trains mostly run in one direction (and therefore meet the 2ph in one direction criterion). Those running below 44 trains per day almost certainly don’t meet the criteria, but 32+ is an expanded threshold that would include some stations on significant train lines that are under-utilised and may have seen reductions in frequency post-COVID. [12] The Urban Task Force report concluded (page 62): “At the same time we need to make sure that transport hubs benefit from the maximum catchment population possible to sustain existing services. Today, many sites which were previously developed but now lie vacant are close to actual—or potential—transport nodes. In redeveloping such sites we can effectively strengthen the public transport network by providing more public transport patronage. This in turn permits higher service levels to be provided commercially, which can encourage lower car ownership and an overall reduction in car use by those who do own cars, facilitating more intensive developments with reduced car parking provision and so on. To promote this we must ensure that: we prioritise development opportunities on the basis of their proximity to the existing and potential public transport networks.” [13] As identified by the current December 2024 NPPF at footnote 7, namely: habitats sites and/or Sites of Special Scientific Interest; Local Green Space, a National Landscape, a National Park (or within the Broads Authority) or defined as Heritage Coast; irreplaceable habitats; designated heritage assets; and areas at risk of flooding or coastal change. Green Belt is not a constraint for the purposes of this exercise. [14] Albeit that is also explained by different site ratio and density assumptions.