In days gone by
, the biennial issue of official population and household projections was an inescapable ‘event’ for those involved in planning. Was housing need up or down? Which areas were projected to grow faster? Which local areas might be arguing for a cut in their housing target? Under localism, a whole industry of objectively assessed housing need specialists
formed around the dark art of local demography.
But if housing targets in England are now set with reference to the
stock and affordability-based standard method, surely these projections are no longer relevant?
Not so fast. All the signs are that planners do still need to grapple with them when considering housing, employment, retail, infrastructure and other needs.
Although the decoupling of housing targets and household projections is generally welcome,
it does raise questions on how one aligns these housing targets with other elements of plan-making that are inherently linked to projections of demographic change. In this blog, we explore these elements and discuss some of the questions that plan-makers will need to address, in light of ONS’s 2022-based Household Projections published today.
Our interactive maps below show these projections at local authority level, including how they compare with past housing delivery, plan requirements and the current standard method. Headlines by potential Spatial Development Strategy (SDS) areas are set out in this blog.
Our key findings in this blog are:
- The latest ONS projections indicate higher national growth than any projections in over a decade, largely attributable to higher underlying population growth;
- The projections continue to ‘bake-in’ trends of declining household formation meaning they are still likely to under-estimate true housing need and demand;
- Ageing remains the key driver of growth in the number of households, but changing demographic trends (including declining birth rates and higher international migration) will affect demand from other groups, like single people, couples and families;
- Across potential Spatial Development Strategy areas, plan-makers will need to grapple with the demographic outputs of standard-method-based housing targets; and
- Household projections remain an important part of the evidence for plan-making: for housing but also employment, community infrastructure, retail and other topics. Strategies for housing (the amount, location and mix) will need to factor in ‘real world’ considerations like the need for affordable housing, the need to improve affordability, changing demand due to live-work patterns (working from home) and the need for flexibility in the labour market.
Housing headlines
Whilst household projections no longer form the starting point for setting housing requirements, it is still interesting to consider how the 2022-based projections compare with earlier iterations, and what this tells us about demographic trends across the country as a whole.
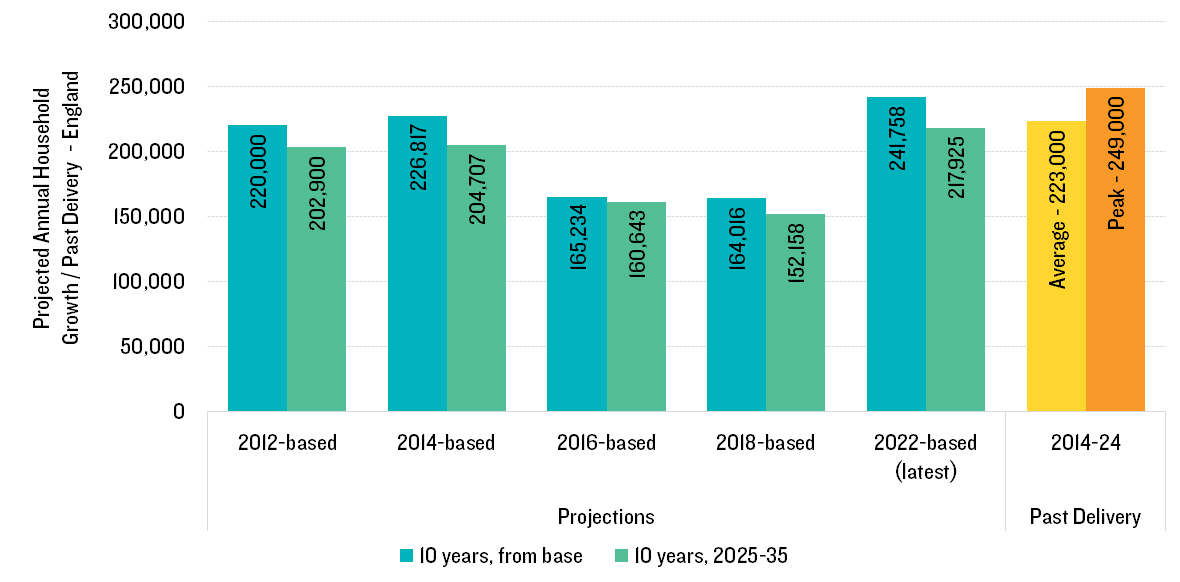
Projections of population and household growth have been progressively declining over the last decade (Figure 1) owing to both declining population projections and household formation rates.
The 2022-based household projections show a reversal of these trends, largely because the underlying population growth is significantly higher than previously estimated. They represent the highest overall household projections in well over a decade, at 219,000-242,000 additional households per year, broadly the same as past levels of net housing additions.
Figure 1 Projected 10-year household growth (England) and Past Housing Delivery
Source: MHCLG and ONS Projections, MHCLG Live Table 122
This increase is largely attributable to the change in underlying population (with more people overall, including more younger people as a result of international migration). But the figures also show that ONS’s latest projections continue to ‘bake-in’ past trends of worsening household formation, particularly amongst younger groups. This has always been a point of contention between the projections and planning, with ONS itself caveating its latest release by saying:
“Household projections are not a prediction or forecast of how many houses should be built in the future. Instead, they show how many additional households would form if assumptions based on previous demographic trends in population growth and household formation were to be realised. At the local level, household change is influenced by economic development and housing policies, factors that are not included in these projections.”
If we applied the earlier – 2018-based - set of household formation rates by age and sex (i.e. the proportion in a given group who form a household) to the 2022-based projection of those living in households, then projected annual growth over the 2025-35 period would be just under 224,000 (Table 1). The actual projected household growth in the 2022-based projections is 218,000; in other words, on a like-for-like basis, the latest projections project a continued deterioration in headship rates such that 6,000 households per year are effectively ‘lost’. When using headship rates from the 2014-based projections – the difference is even greater, at nearly 16,000.
Table 1 Comparison of projected annual household growth for England 2025-25 when using alternative headship rate projections
|
|
Household Formation Rates Applied
|
|
|
2022-based
|
2018-based
|
2014-based
|
|
2022-based Household Population
|
218,000
|
224,000
|
234,000
|
|
Difference
|
~
|
+6,000
|
+16,000
|
Metrics to mix
The changing demography impacts not only levels of household growth, but also its composition, with consequential implications for planning.
For decades the ageing population has been a significant contributor to growth;
older people are more likely to occupy homes as couples or singles whereas those of family age are more likely to have adults and children in a single dwelling with consequential implications for the number of homes required for a given size of population (e.g. four single older people who outlived their partner = four homes; a family unit of two adults and two children = one home). In the 2018-based projections 65+ households made up virtually all projected growth (Figure 2). This not only highlighted the importance of planning effectively for the ageing population (both for general housing and specialist housing, as well as infrastructure such as healthcare) but also raised questions on how to effectively plan for demand from other groups (for example to reflect changing working patterns in the post-pandemic world).
The 2022-based projections show older age groups still comprise the majority of growth. But changes to underlying birth rates show the number of families is now projected to decline by nearly 1m over 10 years; previously the decline was only marginal
. However, there is a reversal in trends amongst other household types: the number of single person households is projected to increase by nearly 750,000 and the number of adult only (couples, multiple adult households or families with non-dependent children) households increases by nearly 900,000. The latter groups have a wide range of needs, and housing across a mix of sizes and types will be required.
Figure 2 Projected Change by Household Type – England – 2025-35 – 2018-based and 2022-based
Source: Lichfields based on ONS
Informing strategic planning
With the intended move towards larger spatial planning areas (through Spatial Development Strategies
) it’s important to consider what these latest projections are showing at larger geographies, both in overall terms and for housing mix.
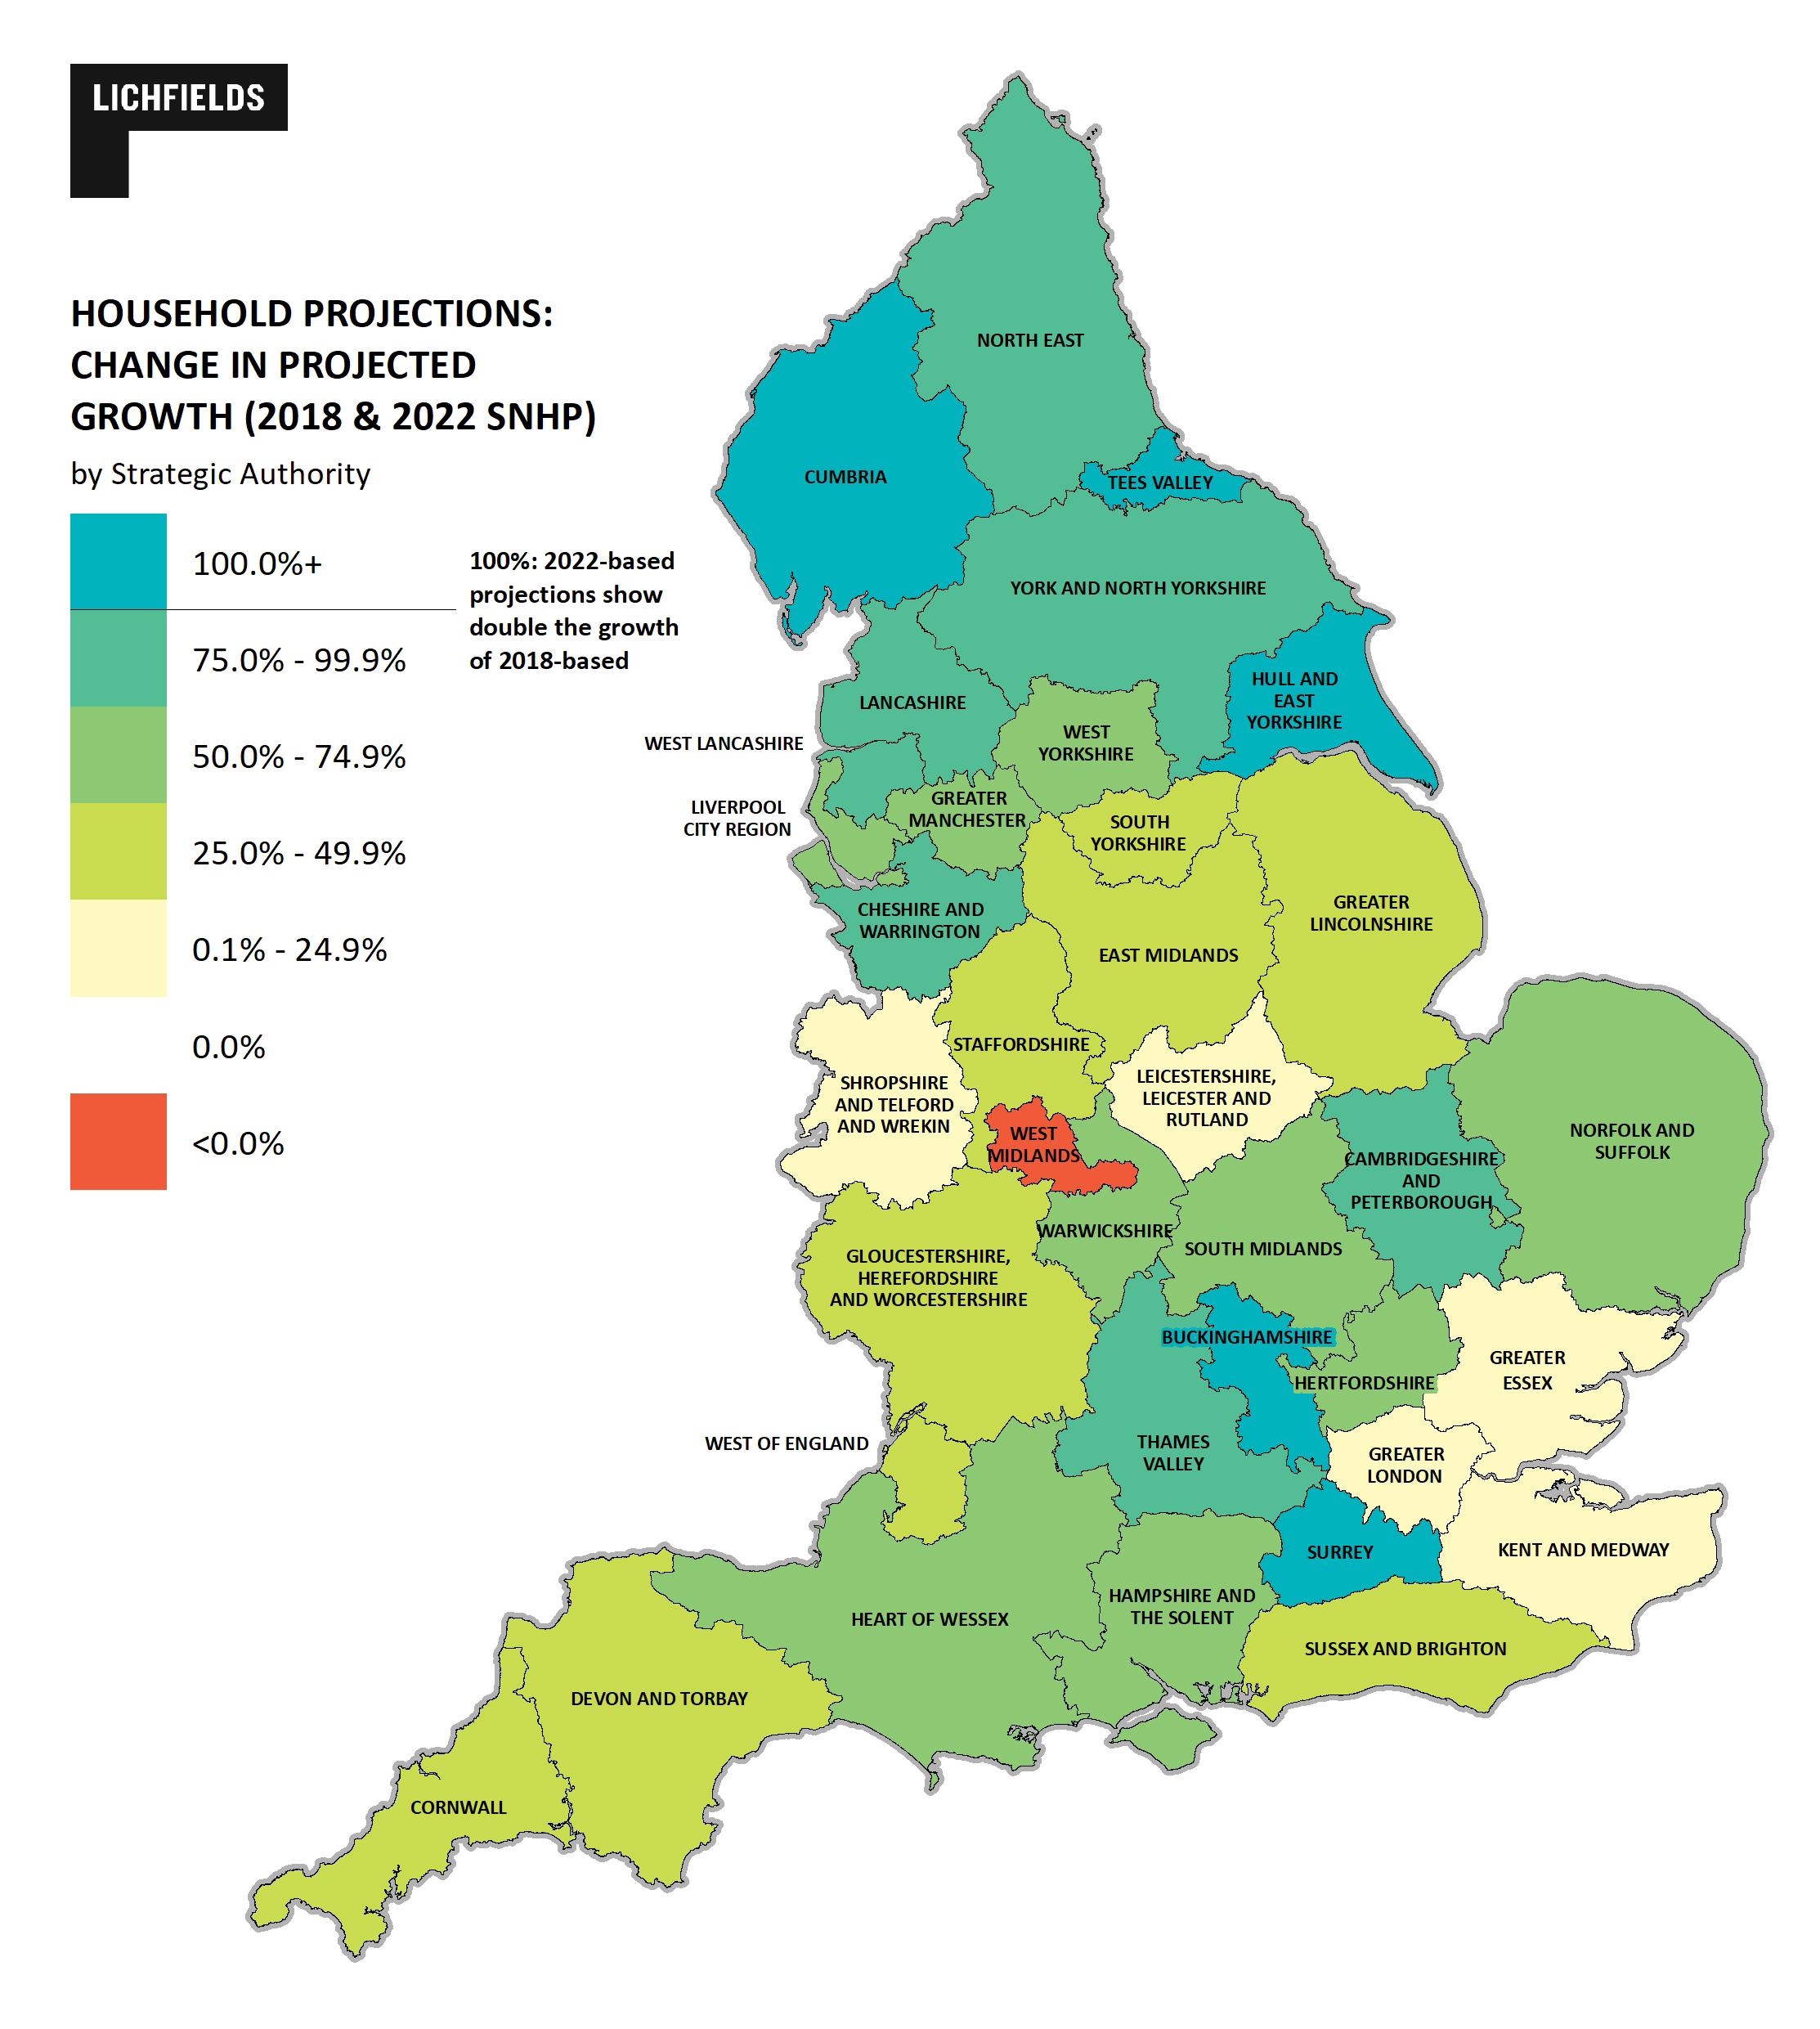
In line with the national picture, all but one potential SDS area (the West Midlands) has higher projected household growth in the 2022-based projections than in the previous (2018-based) projections, with the most significant increases in growth seen in parts of the north of England, along with Buckinghamshire and Surrey, as shown in Figure 3.
Figure 3 Change in projected household growth between 2018-based and 2022-based projections by potential SDS area
Source: Lichfields based on ONS
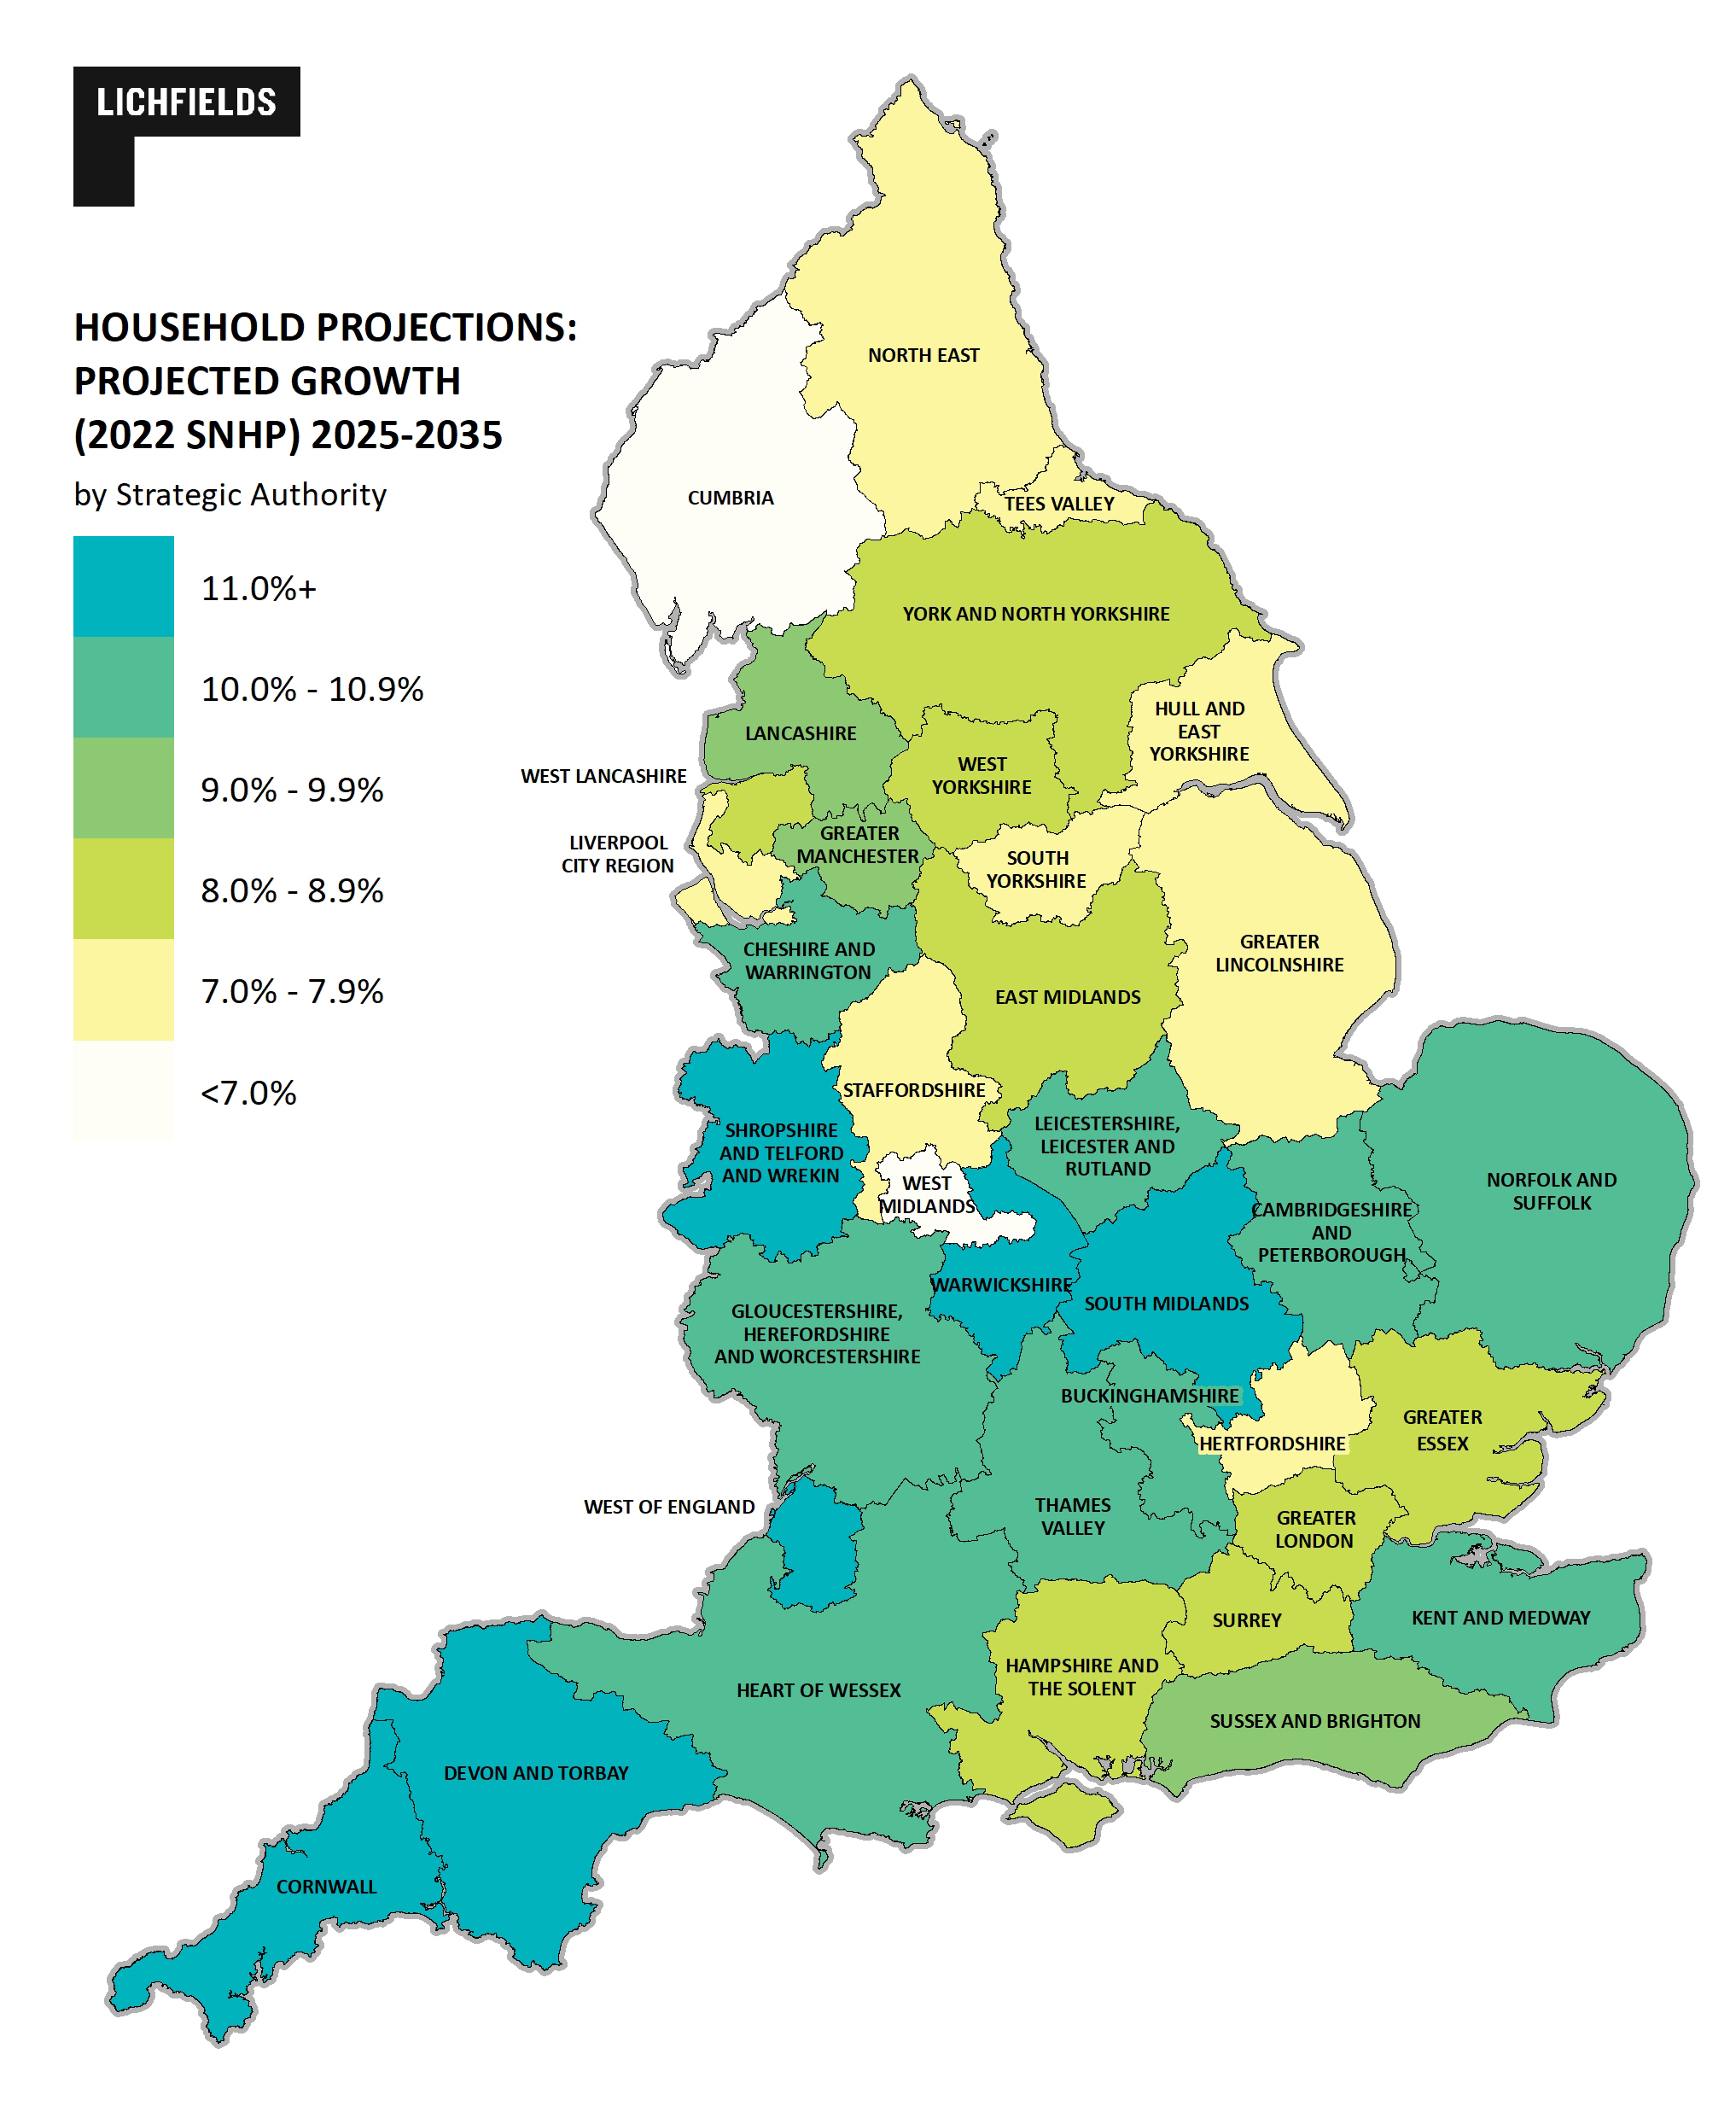
Looking at projected household growth over the next 10 years, there remains a broad north-south pattern, albeit with some outliers. The South West and parts of the Midlands are expected to see the fastest rates of household growth, exceeding 11% over 10 year (1.1% per year), as shown in Figure 4.
Figure 4 Rate of projected household growth – 2025-35 in 2022-based projections by potential SDS area
Source: Lichfields based on ONS
With the household projections being lower than the standard method across all the 36 potential SDS areas in England, plan-makers will need to consider how local demographics will respond to the extra supply that is delivered by virtue of the stock-plus-affordability method used to set local housing need.
Depending on the assumptions made, there could be different implications for planning for housing, infrastructure, employment and other needs. For example:
- If ‘additional’ housing (over the projections, up to the standard method) is assumed to generate additional in-migration or higher family formation (e.g. births), this might generate higher population growth in the area than the underlying projections suggest. Consideration needs to be given as to whether this is realistic and what impacts could this have on neighbouring areas; in doing so plan-makers could consider the use of ONS’s variant projections. There could be consequential implications for education, employment and community infrastructure;
- ‘Additional’ housing might also induce additional household growth, for example by improving affordability of accommodation and facilitating adult children to move out of the family home and form their own household, or allowing adults to live alone rather than in shared housing. Thus the result might not be additional population increases (c.f. the ONS projections) but simply more households in that area. Plan-makers will need to consider what impacts this might have on the mix of housing needed, depending on where this additional household growth comes from; and/or
- A combination of the above, along with the potential for slight increases in housing vacancy rates as a result of there being more choice in the market. In some places (e.g. London or coastal/tourist areas), additional supply might lead to an increase in the number of properties that are occupied as second homes or short-term lets. More generally, a higher number of vacant homes can help support functioning of the housing market and investment in improving stock. England has some of the lowest vacancy/second home rates in the world.
Comparing the projections and standard method helps give an idea of the potential types of impact future supply might have, including where supply per the levels in the Standard Method might have the greatest impact on affordability. Of the 36 potential SDS areas in England:
-
There are 13 SDS areas where the household projections equate to 75% or more of the standard method, i.e. where the projections are most closely aligned with local housing need. These are all in the Midlands and North. The closest match is seen in Shropshire where the 2022-based projections expect household growth of just under 2,900 per year between 2025 and 2035, which is only 1% lower than the standard method (of 2,906). The figures are also close in Lancashire, with a difference of only 6% (4,700 compared with just under 5,000);
-
There are 19 SDS areas where the household projections are between 50% and 75% of the standard method – these have a broad geographic spread across most regions; and
-
There are 4 SDS areas where the projections are 50% or less than the standard method – Greater Essex (50%), Hertfordshire (38%), Surrey (37%) and Greater London (33%). This is perhaps unsurprising given these areas represent some of the most constrained parts of the country where housebuilding has failed to keep pace with demand historically; this has led to poor affordability (and thus a high standard method figure) whilst also supressing household growth (and thus low household projections, since these are based on past demographic trends). In these areas, new supply could have the greatest benefit to affordability, but will also require greatest consideration for how housing growth will relate to the resulting local population.
A comparison of context (past completions, standard method and plan requirement) and the new projections by potential SDS area is shown in Table 2 below.
Table 2 Housing Context and Projections by SDS
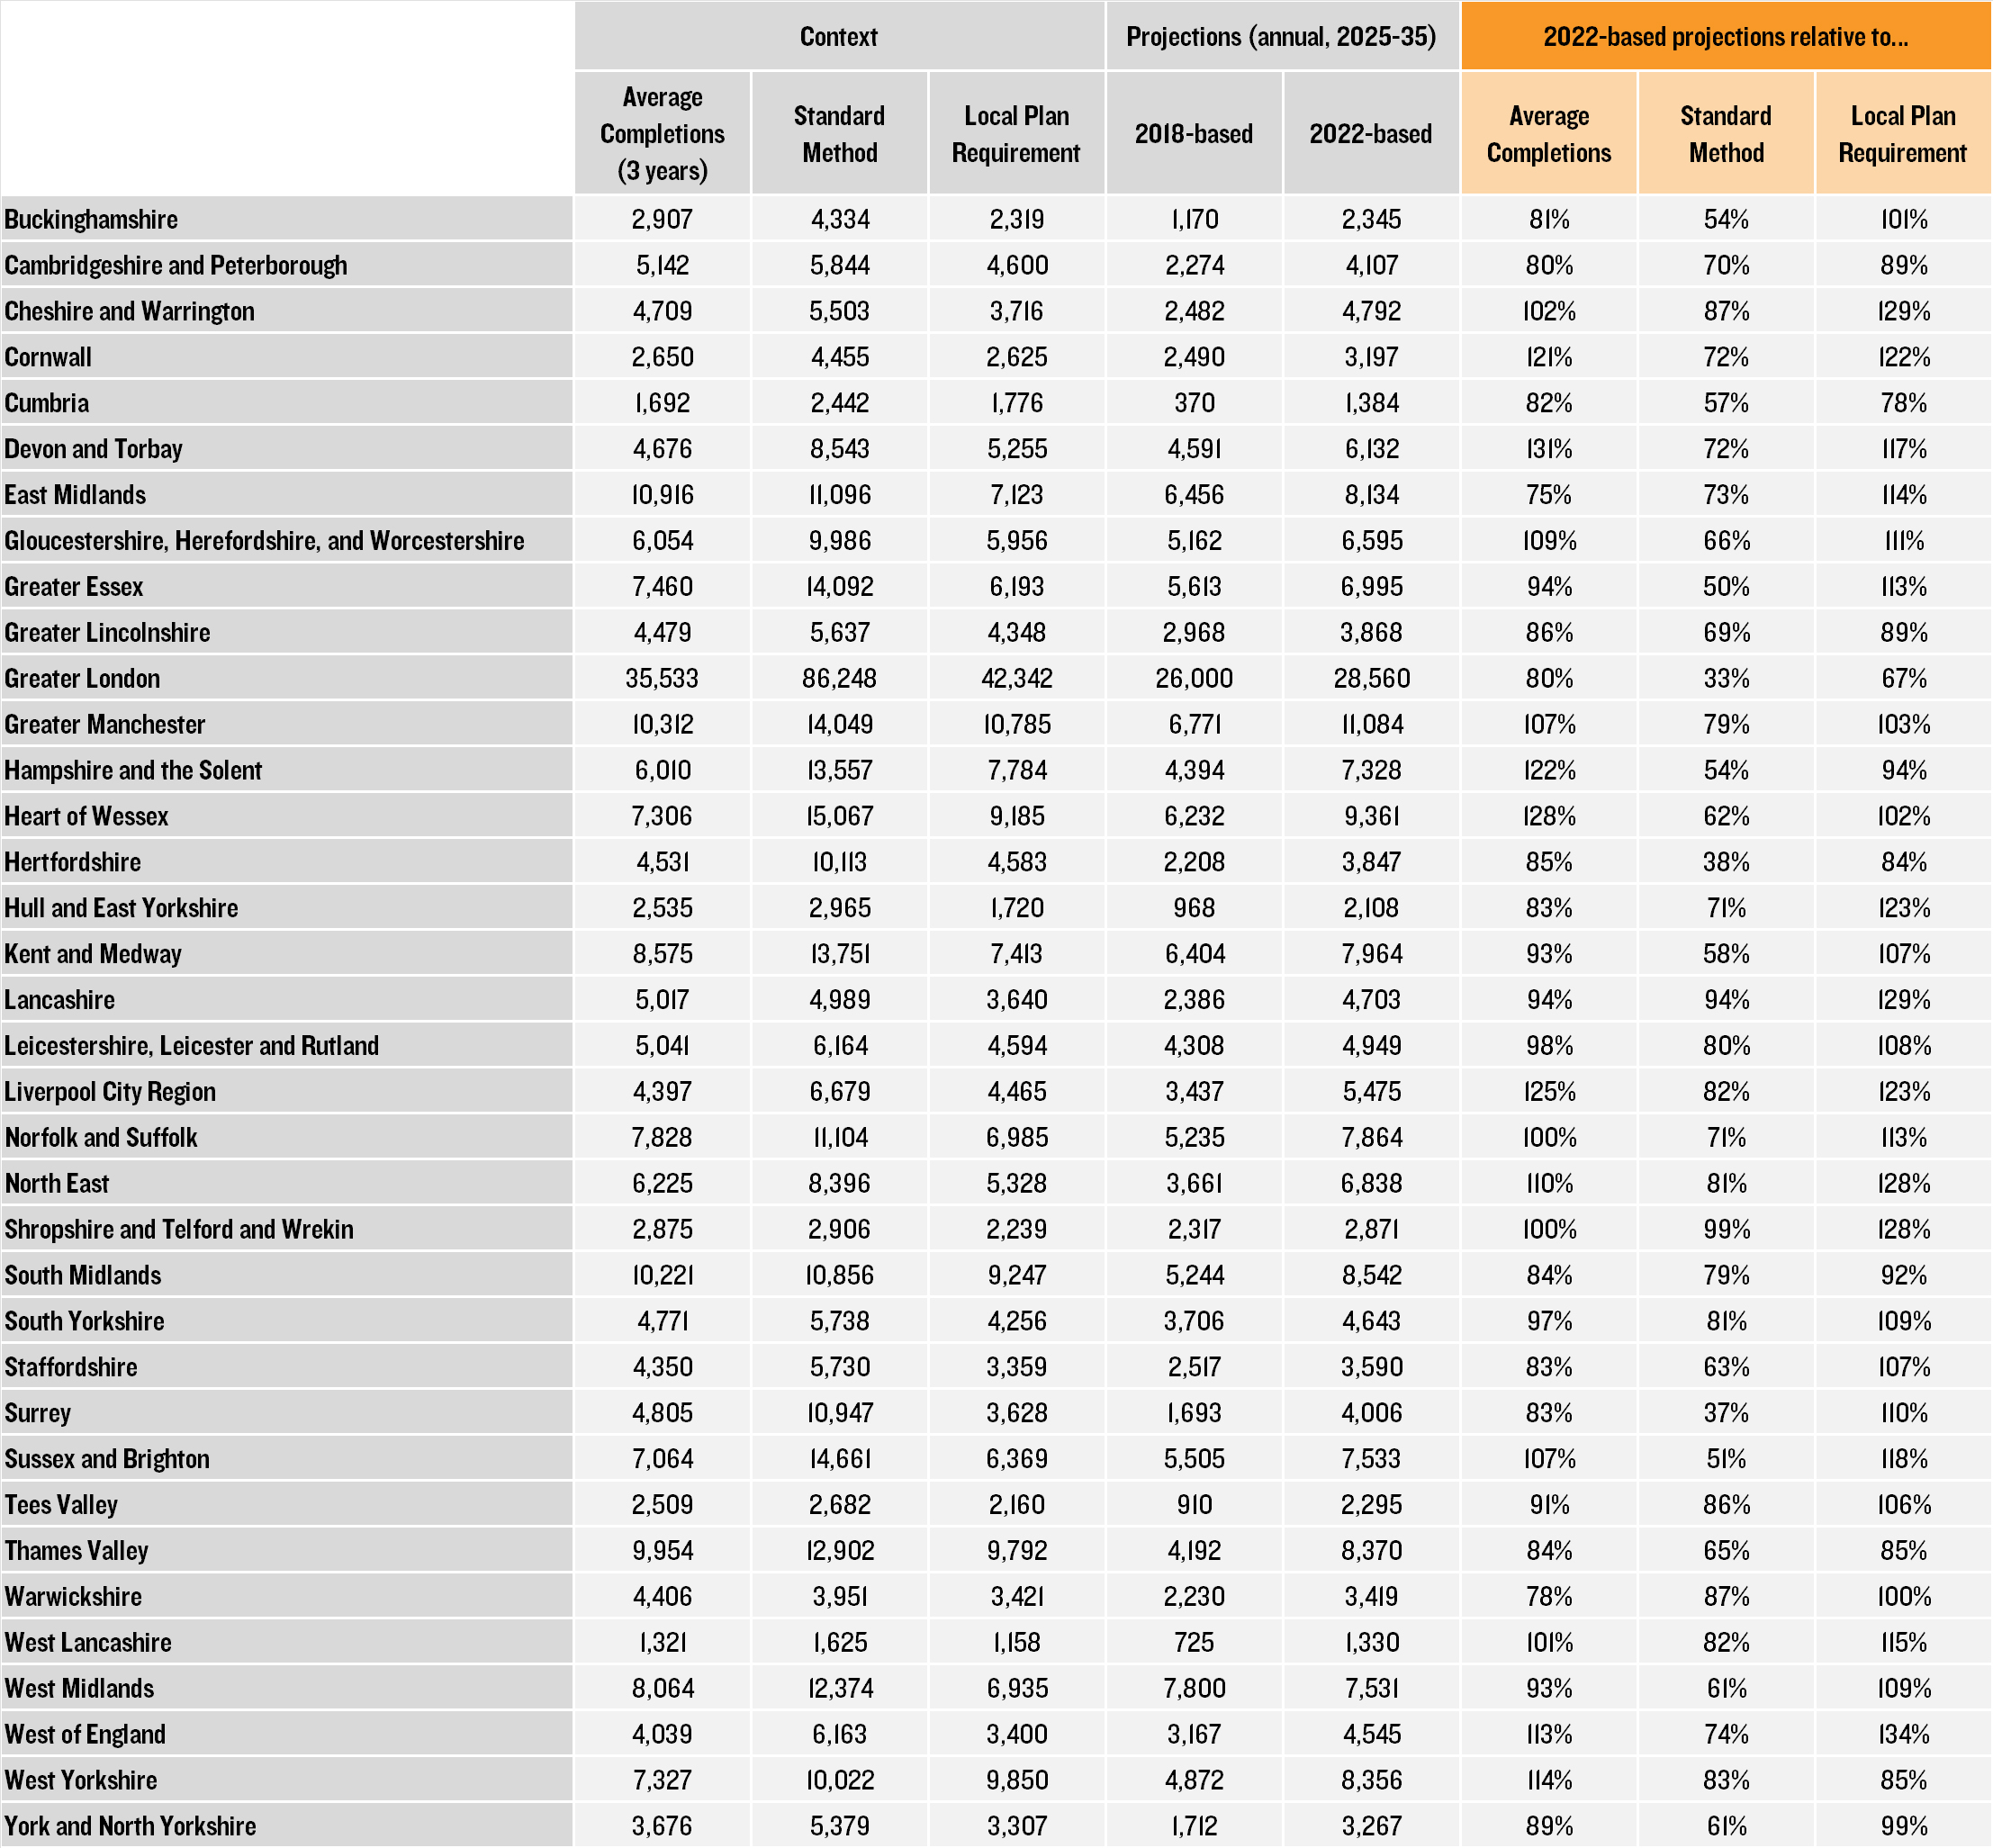
Source: Lichfields based on MHCLG, ONS and Lichfields research
Projections to places – what next?
These latest projections are a helpful piece of evidence, being the first set of full household projections produced since the 2021 Census and the first in over five years. They reflect ONS’s most up-to-date picture of projected population growth, which has changed markedly over the last decade. The projections show that the ageing population will remain a key national driver of growth, but also raise important questions about how the planning system supports other groups – particularly single people and couples – in meeting their housing needs. Wider challenges – of addressing decades of housing backlog, improving affordability, allowing flexibility in labour markets and delivering affordable housing– will remain key considerations in considering crucial questions of quantum, location and type of homes and the wider land use questions that arise.
Before 2018, when the then Government realised its 2016-based household projections ‘broke’ its recently introduced standard method based on the 2014-based projections
[2] Including the authors of this blog
[3] For reasons explained in this blog here. This includes the potential circularity where household projections are constrained by housing supply (since households cannot form without houses to move into), and the fact that short-term trend based projections do not address long-term issues of undersupply (citing sources which estimated an undersupply of around 2m homes since the 1990s).
[4] The projections are available from ONS here
[5] See for example, the 1991 household projections for the period to 2016 which suggested the change in age structure accounted for 21 per cent of the increase in households – 1998 DETR Memorandum to the House of Commons Environment, Transport and Regional Affairs Committee here
[6] This likely reflects the consequences of the housing shortage. There is evidence that worsening affordability and uncertainty over housing is a significant factor in delaying or deterring couples from starting families – see here
[7] Strategic authorities are emerging therefore in some places there are likely to be changes from the geographies assumed for this blog. It is across these wider geographies (however ultimately configured) that the Government intends for strategies to come forward that will, inter alia, set housing requirement figures for which local plans will provide for each LPA.
[8] There is good evidence that supply of homes over and above levels of household growth impacts on the relative affordability of homes, even after taking account of the contribution of rising incomes and interest rates. The OBR has found that sustained increase in housebuilding of all tenures will help to ensure house price to income ratios remain stable over time (source: OBR, Working Paper No.6: Forecasting House Prices, 2014). A review by the Greater London Authority (GLA), which looked at seven different studies, found that building new housing, even at market rates, improves housing affordability overall, including freeing up other homes as people move. (source: GLA, Housing Research Note 10: The Affordability Impacts of New Housing Supply, 2023)
[9] In 2023-24, 1.5 million households in England (6% of all households) contained a concealed household (defined as having at least one additional adult present who would like to buy or rent their own accommodation but could not afford to do so) (source: ONS, English Housing Survey 2023 to 2024: Experiences of the Housing Crisis, May 2025). Over 1.3 million households remain on social housing waiting lists (source: MHCLG, Table 600: Households on Local Authority Housing Registers, 2024). At least 326,000 people (most of them families with children) are living in temporary accommodation, with 45% of those families remaining in such conditions for more than two years (source: Shelter, Press Release, December 2024)
See Figure HM1.1.2 in this OECD analysis here