New data released from the 2016-based household projections by the Office for National Statistics (ONS) show that the number of people living on their own in England is projected to increase by more than 25% over the next 25 years.
Clearly, household projections do not equate with demand or need for housing directly (see Lichfields blog on
household projections methodology). Instead, they “
show how many additional households would form if the population of England keeps growing as it did between 2011 and 2016 and keeps forming households as it did between 2001 and 2011.”
[1]
Household projections are though an integral part of how we plan for housing - setting the baseline scenario for population growth, the Standard Method, and the Housing Delivery Test (albeit that the Government has proposed temporarily continuing with 2014-based household projections for planning purposes over the next two years).
The new projections show that, there will be a significant increase in the number of one-person households by 2041, driven almost entirely by growth in one-person households over the age of 65. Due in large part to people living longer, one-person households in this age group will grow by 51% by 2041, accounting for 91% of the overall growth in the total number of one-person households.
However, growth in older households is not evenly-spread across the country; as Figure 1 shows, growth is mostly concentrated in the South of England and the Midlands, as well as in London, while in the North and South West there seems to be less variation. Still, more than half of English local authorities are projected to see the number of people aged 65 and over who are living alone increase by more than 50% by 2041.
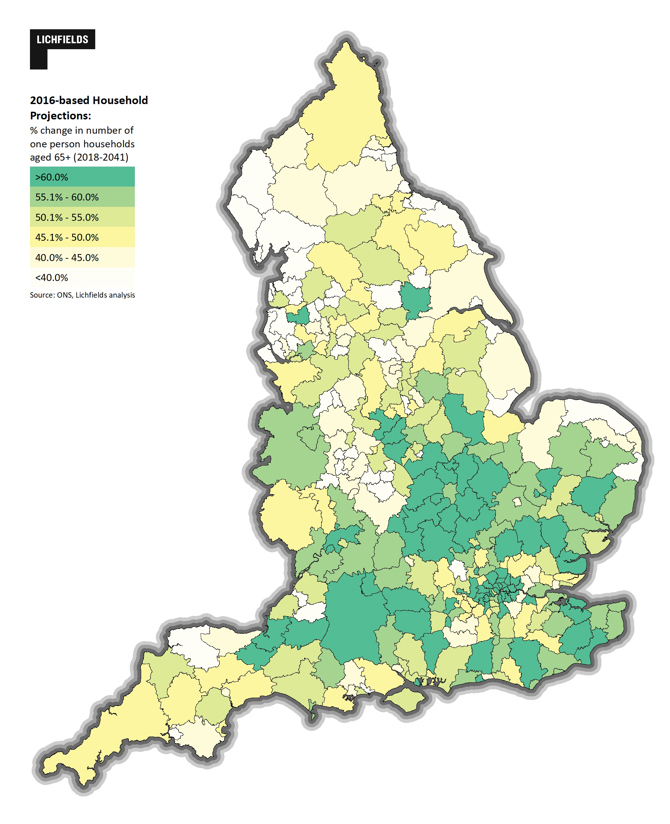
Figure 1: Growth in in number of one-person households aged 65+ (2018-2041)
It is also interesting to consider changes in the number of younger households, specifically aged 25-34, particularly as these households are the focus of Government policies and programmes aimed at increasing homeownership (see our blog on
entry-level exceptions for example).
Across England, there will be just 1.7% growth in households in this age group over the period to 2041, and less than 1% growth in the number of single person households of the same age. Notably, both groups have projected declines of close to 10% by the year 2032; this reflects the demographic shifts of a smaller age-cohort coming through, with numbers roughly returning to their present levels by 2041. What is not accounted for in these statistics are the 1.8% of concealed households (e.g. adult children living at home) and sharing households identified in the 2011 Census.
[2]
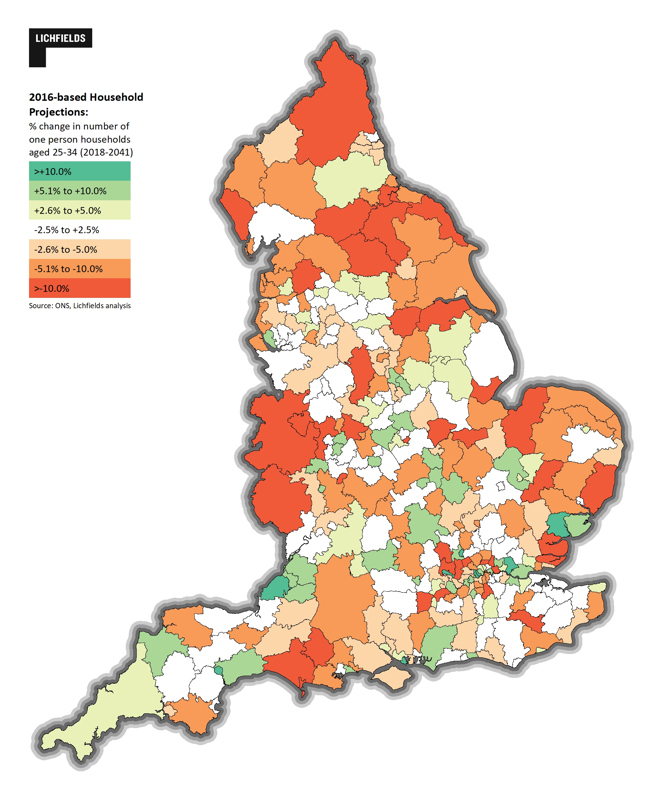
Figure 2 below shows the geography of the projected change in one-person households aged 25-35, and reflects a very different spatial pattern compared to Figure 1 above. Overall, just 45 local authorities will see an increase in one-person households over the period to 2041.
Figure 2: Change in in number of one-person households aged 25-34 (2018-2041)
The balance of different types of households projected also has implications for the mix of homes that will be needed, particularly at the local level. The most significant increase (+139%) of any household type relates to those households made up of people over 90 who are living alone. This could suggest a challenge in terms of the current housing stock, and might also represent an opportunity for specialist housing developments for the elderly. However demand for this type of housing will also reflect factors other than the demography of the population, namely people’s willingness and ability to move in their old age.
The total number of households with children is projected to increase by only a small amount (1.9%) between 2018 and 2041. In simple terms, this suggests that the need for large sized housing may fall. However, multiple interrelated factors will also affect demand for larger housing. For example, the uneven geographical distribution of larger housing stock; so called ‘under occupancy’ meaning that one-person households might not live in one-bedroom homes as people may want spare rooms, and also, overcrowding within the existing stock.
Actual housing need and demand are subject to many different factors, not least changes in migration and birth rates, which can be linked to broader changes in government policy. Furthermore, housing demand is heavily influenced by the economic outlook. Nevertheless, it is important to consider the extent to which the housing market can and should adjust in terms of type and mix (and not just overall quantum) to accommodate the significant increases in older households, and the relative limited change among other age groups and household types.
For more information on Lichfields’ latest research on housing need, including entry level homes, contact Bethan Haynes or Matthew Spry.

[1]Household projections for England – household type projections: 2016-based
[2]What does the 2011 Census tell us about concealed families living in multi-family households in England and Wales?