“Buy land, they’re not making it anymore”. An enduring cliché, allegedly courtesy of Mark Twain,[1] but its durability as a rhetorical device perhaps explains why land value capture (LVC) remains a perennial topic of debate.[2]
The latest contribution is a new report from the UK Collaborative Centre for Housing Evidence (CaCHE) - “Who should own the value of land? Housing, power and the deep politics of land value capture” by Edward Shepherd and Tim White. It arrives at (yet another) significant moment for planning reform. With the Government actively consulting on changes to viability policy,[3] and grappling with a London development market in acute difficulty,[4] the report’s central questions are not academic.
The report is worth reading. Drawing on analysis of over 100 parliamentary debates and policy documents, and 50 interviews conducted between December 2023 and February 2025, the CaCHE report makes five propositions:
-
LVC is ideologically ambivalent — a “third way” policy that different political traditions can justify for different reasons. This explains why it has survived successive governments while the detail is contested (Key Finding 1)
-
This ambivalence produces paradigm stability but constant policy churn, as each government tinkers at the margins rather than confront the underlying tensions (Key Finding 2).
-
The s.106 negotiations for LVC has generated a “complexity industry” — a professional ecosystem whose expertise is unequally distributed and systematically exploited by well-resourced private interests at the expense of local authorities and the communities they serve (Key Finding 3).
-
By focusing political attention on development land, LVC has served to contain more ambitious conversations about property wealth taxation more broadly, including homeownership (Key Finding 4).
-
LVC is no panacea — spatially uneven, structurally limited, and ultimately a mechanism that manages rather than resolves the contradictions of the speculative housebuilding model (Key Finding 5).
The paper creates some well-constructed arguments; on the ideological ambivalence thesis especially and its observation that LVC reform succeeded in the 2010s because campaigners repackaged it in the efficiency language of neoliberalism rather than the redistributive language of social democracy (See Section 8).
Where the report becomes more difficult is in its central empirical claim: that the current viability system is characterised by systematic gaming and manipulation by developers. This finding is based on previously unpublished data (set out within the report's Appendix B) comparing land transaction prices with the figures submitted in financial viability assessments (FVAs) for the same London sites. The headline finding — that prices paid for sites were on average 2,450% higher than the average residual land values (RLVs) reported in those assessments — is presented as “clear and compelling evidence of continuing widespread gaming and manipulation of the system by developers” (Chapter 7, pp. 63–64).
The report goes on to refer to the strength of the structural power of the volume housebuilders, stating that they
“are well equipped to navigate the negotiations of the planning process due to their considerable resources – which produces skills and information asymmetries in comparison with local authorities.” (page 28).
[5]Before accepting this diagnosis, and the report’s recommendations, it seems worth pausing on several elements of the analysis.
Does the analysis account for survivorship bias in a declining market?
The Appendix B dataset relies on 41 sites where viability was tested
and transacted. Schemes where a viability assessment (either internal or carried out in line with the PPG) might have concluded the development was unviable and nothing happened — precisely the cases where the FVA’s conservatism was vindicated — leave no trace.
[6] This is more than a minor methodological crease. The data was assembled between January 2023 and June 2025: precisely the period in which London’s development pipeline was collapsing, prompting the Government and Mayor of London’s intervention.
[7] The flow of new homes that secured permission in 2025/26 was just 40% of the number in 2021/22 (see Figure 1). And it seems unlikely all will turn out to be viable: Molior data shows only 2,100 homes were started in Q1 of 2026: a fraction of past rates, and before accounting for impact of the Iran conflict. Meanwhile, 269 of the 300 active development sites will complete by end of 2027, leaving just 5,900 homes scheduled for delivery after 2027, with few sites in the pipeline to replace them.
[8]
Figure 1: Homes securing planning permission in London 2012/13-2025/26
Source: GLA London Datastore - Residential approvals dashboard (Accessed 7th April 2026)
The sites in Appendix B are those that transacted in the lead up to this precipitous collapse: a self-selecting group whose economics were sufficiently robust to attract a buyer. The far larger population of sites that stalled, were mothballed, or failed to attract any transaction during this period is inevitably absent. Appendix B cannot capture the land that was bid away to competing uses, or the promoted sites that entered the market and attracted no residential offers.
Financial capital is not sentimental. It flows toward returns and away from unacceptable risk, and in London's residential development market it has been flowing out for some time. Berkeley - the most London-focused major developer in the country - recently announced it is halting new land purchases, having bought just three sites in three years. It stated it does not believe it can make its required rate of return on new London sites, citing the competitive pressure from non-residential uses — data centres, logistics, life sciences — which do not carry the same regulatory and tax burden as residential development and can therefore consistently outbid it for land.
[9]Does it recognise the market realities of acquiring land?
For planning purposes, financial viability appraisal is prepared with reference to a benchmark land value (BLV) that is defined in the GLA’s 2023 viability guidance as the
“minimum return required for a reasonable land owner to make the land available for development and should reflect the cost of compliance with planning policy”.
[10] The analysis in Appendix B indicates that many sites are transacting at levels greater than BLV, demonstrating that these London landowners are, in reality, requiring a greater price than might be assumed in the viability appraisal, reflecting the expectations arising from other uses. Industrial land values run at £4.75m to £7.75m per acre,
[11] with Savills reporting an increase of 175% between 2017 - 2022;
[12] Data centre sites have been valued at £17m per acre.
[13] The implied value of the sites transacted in Appendix B is £5.1m – £8.5m per acre.
[14] London is where there is greatest competition for - and lowest supply of - developable land.
[15]The pressure to acquire land in this environment might mean that developers are “overpaying” compared to a theoretical appraisal BLV, in anticipation that having obtained a planning permission confirming the principle of a certain scale of development, it becomes a baseline to then revert with an optimised scheme or through cost or value engineering. The transacted price may not correspond to the scheme or developer that secured permission. Those acquiring may have a different business models, different financing arrangements, or different development ambitions.
In other words, the transacted price may not be coterminous with the scheme or developer that secured planning permission. The schemes that are identified in Appendix B may never actually be delivered.
Equally, the developer may be pricing in anticipated value growth, or taking a calculated risk that the costs assumed at an early stage - before full technical information is available – can be managed more effectively in delivery. This is no more or less than the ordinary expression of entrepreneurial risk appetite in a competitive market economy. Without it, as the behavioural economics literature is clear, very little development would happen at all.
[16]This is about small margins. The Council’s own viability evidence for Scheme 2 in Appendix B - the Rainbow Business Centre – shows the difference between the price paid (£18.25m) and the benchmark land value of £6.8m is bridged simply by assuming a 10% increase in value and a marginal cost efficiency of around 2-3% for a scheme that would be expected on the market a number of years ahead.
[17] The report observes that:
“We note that there is a potential variance in the construction costs due to the early information upon which the cost estimate is based in comparison to the costs when the works are undertaken.”
Of course, if the entrepreneurial optimism is misplaced, the development will struggle to attract finance and the site will stall until (if) the economics of the development improve. The SME builder may fail.
[18] And if the developer offers less than the landowner requires, they do not access the land – losing a fundamental input to their business.
Big city - small builders
The CaCHE report constructs its gaming thesis around its analysis of London sites and reference to volume housebuilder behaviour that it refers to as land portfolio companies with structural market power and sophisticated viability teams (see Section 3). But volume housebuilders - although active – have typically delivered a smaller share of London's homes. The capital’s residential pipeline has been characterised by SMEs, specialist brownfield developers, Build to Rent operators and mixed-tenure regeneration vehicles.
[19] This is a market niche for SMEs.
[20] A spot check of the Appendix B sites supports that thesis.
Further, as already identified, London is distinct in the competition for land and its shortage of supply compared to any other part of the country.
[21]In reality, the London landscape is a story of SMEs whose market position has reduced and remains fragile – operating across a handful of sites rather than large portfolios; their success or failure in a weak market bound to unpredictable decisions by LPAs and landowners.
If the conceptual framework for ‘gaming’ is built around the power of big volume housebuilders but the empirical evidence is drawn from a much more diverse London market and sites those builders often do not operate in, how confident can we be in the causal story the report tells?
The report states:
"while the evidence collected relates only to London, there is no reason why similar logics are not also shaping developer and land market practice in other areas of the country" (section 7)
This seems a bold assertion – lacking evidence - given that London and the rest of England have structurally different development economics, land markets, and participants.
[22]2,450%: a number so large it should make you pause
The CaCHE report leads with the alleged 2,450% gap between transacted numbers and the viability appraisal RLV as the totemic metric of its diagnosis. It’s worth a pause to ponder its robustness.
The precise calculation is not provided in the report and it is not clear how the analysis deals with mixed uses within schemes. Of minor note, Appendix B contains what appears to be duplicate data for sites 27 and 28 — but this is presumably an error.
Crucially, it does not explain how it handled negative RLVs — sites where the viability submission assessed the land as having nil or below-zero value — in computing the average. Of the 47 sites in Appendix B, 26 (55%) show negative RLVs. The resulting problem is a straightforward one of ratio arithmetic: when the denominator approaches zero from the negative side, percentage comparisons cease to be meaningful. Working from the closest replication of the report's methodology, removing a single large negative-RLV site (Woolwich Central) moves the headline figure not downward but to approximately 7,000%. The 2,450% figure is an artefact of a near-zero mean denominator, and should be treated accordingly.
[23]
Are the right conclusions being drawn about the ‘complexity industry’?
Undoubtedly, the testing of viability is complex. That’s because development of urban brownfield sites is complex, with multiple inputs and (inter)dependencies, dynamic over time, and risky. If the state seeks to tax it via s.106 up to a threshold close to what is viable, complexity is inevitable in defining where that threshold lies.
Since 2018, the Planning Practice Guidance has sought greater standardisation and alignment, but it too states: “Complexity and variance is inherent in viability assessment”.
The current policy proposal – consulted on in December 2025 – is for greater standardisation,
[24] and the CaCHE report supports it, stating:
“If the current policy settlement is going to be continued for the time being, policymakers should make adjustments in the short-term to ensure that there is greater transparency and standardisation and less scope for negotiation in how land value capture policies are set and applied. We therefore welcome the apparent move towards greater standardisation of viability assessment inputs in the [... NPPF] consultation. Specific measures [...] could include specifying benchmark land value thresholds in policy, creating a robust and transparent national database of development costs, compiling a robust land price database, setting a national minimum and non-negotiable ‘floor’ for the provision of Social Rent housing [...] and making the modelling of price growth in viability testing mandatory.”
A pedant might spot that the CaCHE report endorses the idea of making modelling of growth mandatory,
but only for prices; a view that has its own asymmetry at a time when the impact on construction costs of the Iran conflict is top of the agenda.
[25] The Government is more balanced in suggesting this also
for costs.
[26]But the bigger point is whether the CaCHE report’s central critique that the information asymmetry (between how the developer views viability within their business, and what is written down in a viability appraisal for planning) is leading to lost value capture and that the answer is to standardise viability. Viewed through any prism, this does not work:
- For reasons already explained, a system in which developers were running rampant in London, merrily overpaying for land at the expense of value capture, and then making super-profits would not look like the current market in London. Imagine it were: finance would be rushing into residential development, SMEs would be increasing in numbers, the big volume builders would be buying more land in London. We might even be building more homes. Self-evidently, that ain’t happening.
- Standardisation for a planning viability assessment means what it says. Under current PPG guidance, build costs are benchmarked against BCIS averages or equivalent; finance costs are modelled on standard assumptions about interest rates. Profit thresholds are set with reference to market norms (the 15-20% on gross development value range that has become a planning convention). These inputs are deliberately intended to provide a common framework for negotiation, not to replicate the specific economics of any individual developer or any individual scheme.[27]
- But every developer, site and project is different and time sensitive, especially so in London. This inevitably colours the internal appraisal. The land costs reflects the bid necessary to secure the land from owners who have expectations and choices. Build costs reflect the developer's own supply chain, its approach to procurement, the specific ground conditions and abnormal costs of the site, and the current order book - a contractor who is busy will tender at a higher cost than one who is not. Finance costs reflect that developer's actual cost of capital, which may be substantially higher - or in some cases lower - than the planning convention, depending on the lender’s pricing of risk or the internal capital allocation within a larger group. Profit thresholds reflect not an abstract market norm but the hurdle rate requirement of that developer's investors or board — which may be higher than the planning benchmark if the site is perceived as risky, or if the developer is operating under financial pressure. Certain homebuilders might have pricing strategies and incentives and assumptions around sales rates that can vary enormously, often in a short period of time. And so on.
- This isn't gaming so much as the ordinary operation of a complex market in which different actors have different skills, cost structures, financing arrangements and appetites. A standardised model cannot, by design, distinguish between a developer whose internal appraisal diverges from planning benchmarks because they are ‘gaming the system’, and one whose divergence reflects legitimate differences in how they actually operate.
There is a useful analogy in car manufacturing.
Imagine a government regulator (OFVROOM?) instructed every car manufacturer to calculate residual value using standardised inputs: average steel costs, average assembly hours, a standard return on capital. Volkswagen — high-volume, shared platforms, standardised supply chains — might sit closest to the assumptions. Skoda, lower specification within the same group, might find its costs overstated. Porsche, aluminium-intensive with bespoke engineering and premium values, would find them understated. Morgan, building 650 cars a year by hand in Malvern, would find the model almost entirely inapplicable.
[28] China’s BYD, vertically integrated with different capital structures and a penetration pricing strategy, would be a category it was never designed to assess.
[29]Observing that transaction prices far exceeded the model's residual values, OFVROOM concludes compelling evidence of widespread manipulation — two sets of books, one for the regulator and one for the market. It would be nothing of the kind. It would be evidence that a standardised model produces accurate outputs only for the ‘average’ manufacturer, and increasingly divergent outputs the further any individual departs from that mean. The divergence is a feature of the model, not a bug. Tightening standardisation would increase it for Morgan and BYD while proving no more accurate for anyone else.
This is the risk of December 2025 consultation reforms to viability if applied to London’s heterogeneous development market. ‘Tax’ at the margins of viability in that standard model, and the already diminished industry could shrink further.
Do the answers lie in Europe? (terms and conditions apply)
The report points to German and Danish models as evidence that more interventionist approaches to land value capture are achievable (section 11). This idea is well trodden ground.
[30]The question is not whether an interventionist approach to land value capture can work and should be applied: the UK has the tools to do so by virtue of its Development Corporations, Homes England and CPO powers. It has and will continue to apply these tools, notably for large scale regeneration sites and New Towns.
[31] The nub is whether it is realistic to cite those models as the answer to what it observes in its analysis of the sites in Appendix B, and whether there are drawbacks to those approaches. Yes, the Danes and Germans – and indeed other European nations - operate models in which the public sector can play a strong role in land assembly or pooling, but the most oft-cited examples are those associated with large-scale regeneration and development: for example Copenhagen’s Ørestad, Nordhavn, Lynetteholmen delivered through the City & Port Development Corporation (By & Havn), a publicly-owned entity that assembles land, provides infrastructure and sells development rights to private developers.
[32] These are not analogous to most of the brownfield residential schemes in Appendix B. Nor do they read across to the land use circumstances or political reticence towards development of many local authorities.
[33]The ØRESTAD Development in Copenhagen
For smaller sites, Germany’s Cooperative Urban Land Development (CULD) model has long been admired as a superior alternative to the Section 106 regime — a system that captures land value uplift systematically, fixes affordable housing obligations in advance, and removes the viability negotiation.
[34] Yet recent evidence suggests not all in the
garten is rosy, with a potential structural vulnerability in the face of economic challenges:
- Housing permits (i.e. permissions) have fallen by 46% from 2024 with apartments – the typology governed by CULD - falling most.[35] Cities with CULD or an equivalent also seem to have experienced a precipitous fall in completions.[36] Permitted schemes are being abandoned as unviable; in 2023 alone, nearly 23,000 permits expired unused, due to becoming uneconomic.[37]
- Munich’s own SoBoN model — dating from 1994 – is frequently cited as the international benchmark for CULD. And yet, in practice it has only been applied to 176 projects over 25 years (seven a year) which on the face of it is not huge for a city of 1.6 million people.[38] In 2021, the City raised infrastructure charges and rental quotas, prompting warnings from industry that the reforms would deter the developers responsible for building most of the city’s affordable housing.[39]
- Even before then, research by the Technical University of Munich showed the city’s housing supply was inelastic – unresponsive to prices changes – and suggested developers were reticent to invest due “the restrictive nature of local regulations which constrained scope and profitability of new housing ventures.”[40] The non-negotiability that was perceived as CULD’s great virtue in rising markets becomes a weakness in a downturn.
- In the face of the decline, in 2024, the City watered down its requirements and Munich’s lead for housing construction welcomed the greater room for negotiation in the process.[41]
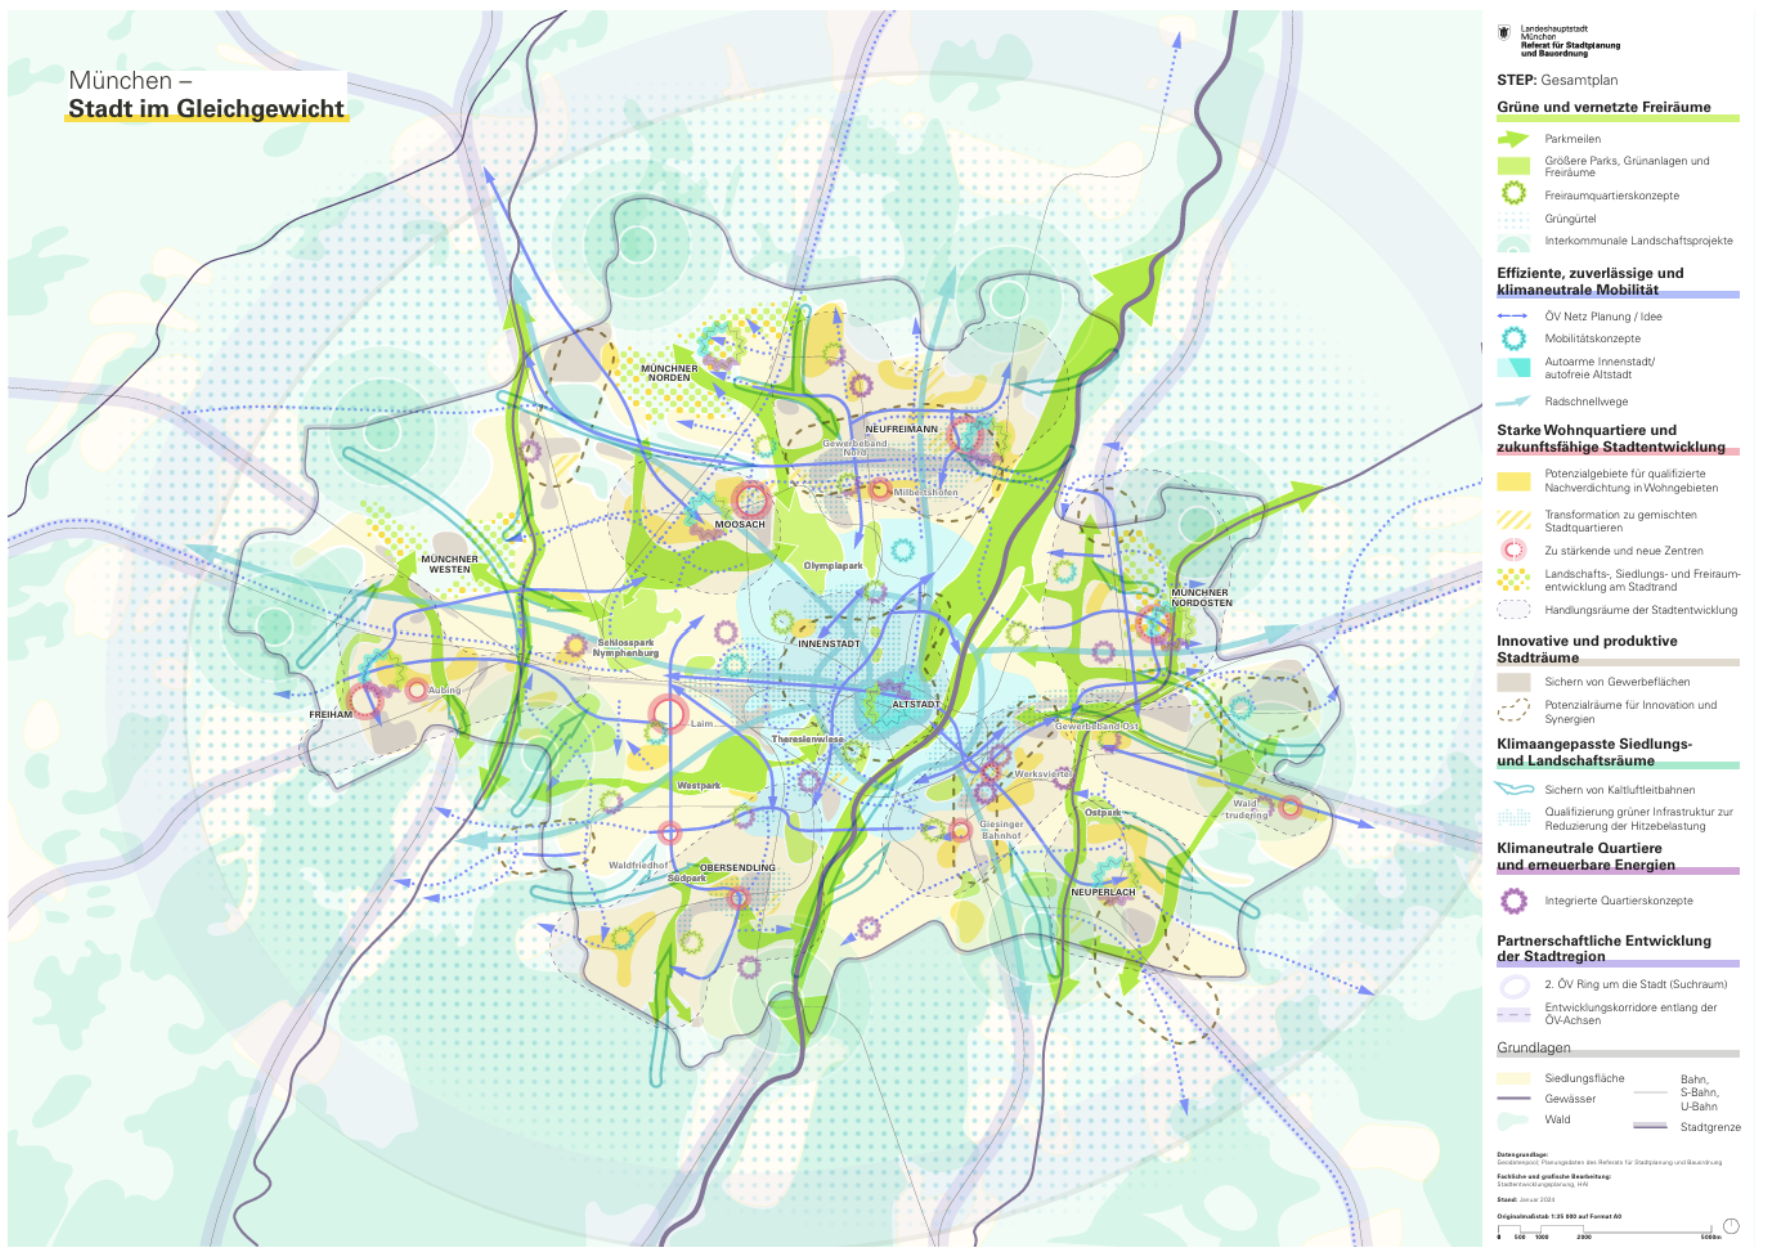 Munich - City in Balance
Any mechanism which fixes obligations as a share of uplift must grapple seriously with what happens when the uplift disappears and capital to invest in housing is mobile. The choice between a transparent but rigid system and a negotiable but ‘gameable’ one is not straightforward.
Conclusions: Ruminations on the reality
The CaCHE report is a serious piece of work on a genuinely important subject. Its historical and political analysis is illuminating. But one must pose questions:
- The central empirical claim does not really survive scrutiny. The 2,450% headline figure is not a robust statistic, more an artefact of ratio arithmetic applied to a near-zero mean denominator, derived from a dataset that captures only the sites that transacted — the survivors — during the very period in which London's development market was collapsing around them. The absence of the tens of stalled, mothballed and never-transacted sites is not a small omission. It is the whole story.
- The gaming thesis rests on a conceptual framework built around dominant volume housebuilder behaviour, tested against a London market to which they make least contribution, with intense competition for land from less regulated alternative land uses, and then adumbrated without evidence to the rest of England. London's development economics, land market and participant base are structurally distinct.
- None of this means we would invent the current s.106 and viability system if we were starting from scratch. Its complexity is real, but we need to draw the right conclusions on what this means. If the Government executes its December 2025 ideas - to tighten standardisation further - applied to London's heterogeneous development market at a moment when construction starts are running epically low, it risks producing not more affordable housing but fewer schemes of any kind, acting against the intentions of its recent emergency package.
- The international comparators point the same way. The commentariat makes much of European approaches to land value capture, even though the prominent examples relate to very large-scale regeneration projects which make up only part of the London development picture. Munich's SoBoN — the most frequently cited benchmark for a non-negotiable LVC system on individual sites - was made more onerous in 2021, and then promptly saw its requirements watered down in 2024 in the face of a collapse in supply. It operates in a city where regulatory inflexibility has made housing supply inelastic and developers reticent to build. Non-negotiability - a virtue in a rising market - becomes a liability when the uplift disappears. Any mechanism must grapple seriously with what happens when there is little or no uplift to share in a still competitive land market.
For all its weaknesses, the s.106 system in London has done more work to capture value than is acknowledged: what has broken London's development market is not gaming but inescapable arithmetic — rising costs, competing land uses, a regulatory and tax burden that applies most of all to residential, and a prolonged period in which the economics don’t stack up. The policy fix involves engaging seriously with those economics, competitive land markets, a heterogeneous development sector and a collapsing pipeline.
The same transactions, the same numbers, the same London sites: viewed through the refracting lens of prior perception seemingly bend towards the predilections any observer brings to the debate. It’s regrettable, but perhaps inevitable. The CaCHE report (and Shelter’s similar analysis) looks through the glass at the data and sees a rigged game. But the market experiences the same data and has to operate within a broken one.
Footnotes
[1] There is no reliable source linking it to Mark Twain, so is likely apocryphal
[2] Not least the HCLG Select Committee Report October 2025 Delivering 1.5 million new homes: Land Value Capture Third Report of Session 2024–26 HC 672. The report seems to sit awkwardly between two realities: a political desire to capture more value, and a market in which the value available to capture was evaporating before the committee’s eyes.
[3] The December 2025 consultation is here
[4] See the Government and Mayor of London’s Final Package of Support for Housebuilding in the Capital
[5] This mirrors a very similar analysis using some of the same data produced by Shelter (2026) on which Nick Cuff of Urban Sketch produced this critique.
[6] The survivorship bias is compounded by the inevitable limitations of the dataset’s construction: Appendix B draws from 150 transactions of sites with potential for 50 or more residential units, of which 47 (31%) had submitted viability information supporting lower than policy-compliant affordable housing (para 7.4). The sites that transacted without a viability challenge — potentially those where market pricing most closely reflected the PPG’s viability assumptions — are excluded. Most significantly, excluded are the sites that didn’t transact.
[7] With the outcome set out in the Government announcement here
[8] See Molior analysis (April 2026)
[9] Berkeley Group, Strategy and Trading Update, 1 April 2026. Berkeley stated it “does not believe it can make its required rate of return on investment in new land acquisitions” due to “the continuous increase in the tax and regulatory burden on residential development, which other land uses do not experience, allowing them to pay higher land values.”
[10] Mayor of London: London Plan Guidance Development Viability May 2023 Consultation Draft
[11] LSH Taking Stock Industrial & Logistics Market 2026
[12] Savills: The London Land Challenge; The industrial land market, 15th June 2022
[13] Savills Traditional data centre hotspots are changing, here’s why, 12th October 2023
[14] Based on blended transaction prices of roughly £64,000–£86,000 per unit for London brownfield residential sites listed in the appendix B — which at typical densities of 150–250 units per hectare converts to a range of approximately £9.6m–£21.5m per hectare (£3.9m–£8.7m per acre)
[15] The 2016 Evidence Base for the London Plan described competition for land in London as “intense”. This report by Oxford Economics looking at the West London Economy states: “Competition for land is a major issue for West London—and London in general. About 4% of the land in West London is classified as undeveloped or vacant. There is of course more land available for development—residential land that could be densified, industrial land that could be repurposed, or brownfield land. But the effort to increase housing while also providing business space and securing land for industrial and logistics uses inevitably creates tensions.”
[16] See this article in Nature. Its review of behavioural research on real‑estate investment finds that developers are subject to persistent optimism bias, overconfidence, anchoring and confirmation bias, leading them to overestimate future values and their own ability to deliver viability while underestimating costs, risks and constraints. In land markets, these biases translate into developers bidding above fundamentals on the assumption that future market growth, planning flexibility or post‑acquisition adjustments will resolve marginal schemes. The evidence indicates that such overpayment is not anomalous or purely cyclical, but a structural and recurring feature of development decision‑making, reinforced by competitive and institutional incentives rather than corrected by experience alone. See also the analysis by Homes England on Optimism Bias
[17] See Table 5.3.1 of the BNP Paribas Peer Review of the viability assessment for the Rainbow Industrial Estate.
[18] And they are failing in increasing numbers – see this report by WPI strategy reporting the number of SMEs have fallen from “an estimated 12,000 in the late 1980s to fewer than 1,200 today. In 2021/22 alone, 360 housebuilders went bust, a 75% increase from the year before and the highest annual number on record, according to Insolvency Service data obtained by Price Bailey”
[19] London Plan Review: Report of Expert Advisers, January 2024, paras 2.32 – 2.36. Lichfields provided analytical support to the Expert Advisers
[20] This analysis from LSE states: “SME housebuilders tend to take on projects that larger builders cannot. Their ability to take on trickier development sites, whether these are awkwardly shaped, ex-industrial land or extended and repurposed buildings within and beyond urban cores makes them a valued asset. These types of developments are crucial for optimising land use, especially in densely populated areas where land is scarce or constrained by pre-existing structures. Their agility allows them to maximise the potential of small, underutilised plots that larger developers might deem unprofitable or logistically complex.”
[21] The CMA report states: “Overall, we conclude that there is generally a substantial amount of potentially developable land across England, Scotland, and Wales at the regional level, with the exception of London.” (Para 4.49).
[22] In any event, the viability picture across England is also not particularly rosy, as illustrated by Zoopla’s 2025 analysis.
[23] The CaCHE report states at footnote 60 that the RLV comparison is based on n=41, excluding sites where the RLV “could not be reported or inferred.” It does not explain how it handled negative RLVs in computing the average, nor does it report the median or distribution. Working from the closest replication of the report’s own n=41 methodology (which produces approximately 2,540%, within 4% of the stated figure), the mean RLV across those 41 sites is approximately minus £0.75m. On the report’s own formula: removing one site (Woolwich Central, RLV minus £20m) moves the mean figure to approximately 7,000%.
[24] See Appendix B of the December 2025 NPPF Consultation
[25] See this analysis by the chief economist at the Building Cost Information Service (BCIS)
[26] Either way it is a recommendation with problems, as articulated by Philip Barnes here
[27] A point made by Dove J who cited the PPG in saying the preparation of a viability assessment "is not usually specific to that developer and thereby need not contain commercially sensitive data" (See Holborn Studios Ltd, R (on the application of) v London Borough of Hackney & Anor [2020] EWHC 1509 (Admin) (11 June 2020)
[28] As this 2020 Channel 4 documentary demonstrates vividly.
[29] See for example this this 2025 FT article on the impact of BYD’s unprecedented pricing strategy on its competition
[30] See for example this work for the GLA
[31] See for example, the Government’s draft proposals for the New Towns Programme
[32] See this analysis on the City and Port
[33] A more active public sector role – across countless small to medium sites every year - would mean a fundamental re-wiring and different political economy for most English local authorities or creation of well capitalised public sector land promoters. This lies well beyond the current cycle of local government reorganisation, or just expanding the current patchwork of local government housing development companies. There is little sign that anyone has grappled seriously with what a public sector-led model across this canvass (as opposed to the single large-scale schemes) would actually mean. The issues were partly explored in my blog here
[34]Koetter, T., Sikder, S.K. and Weiss, D. (2021) ‘The cooperative urban land development model in Germany: an effective instrument to support affordable housing’, Land Use Policy, 107, 105481. CULD combines a binding land-use plan with a voluntary urban contract under which developers bear the entire costs of development including infrastructure and a mandatory affordable housing quota — typically 30% of new residential floor space. The adequacy framework holds that 70% of the net land value increase funds development costs and affordable housing provision, with 30% retained by the landowner as profit incentive.
[35]Federal Statistical Office (Destatis), building permit data 2021–2024, as reported in REFIRE (2025) ‘Germany’s housing pipeline crumbles as permits plunge to 15-year low’, 30 March 2025
[36]Finexity (2025) ‘Historic low in new residential construction in Germany’, February 2025; Munich saw completions fall 30% year-on-year in 2024, and Hamburg (which reportedly had a more flexible approach to LVC and then tightened it in 2021) recorded a decline of nearly 40%.
[37] Per the 2025 REFIRE article
[38] See this analysis Fittkau (2022) “Munich Model of socially fair use of land: Urban development contracts as an instrument for the creation of affordable housing”
[39] Munich’s 2021 SoBoN reform raised the developer surcharge from €100/m² to €175/m² on average and proposed doubling the rental quota to 80%. Commentators warned the reforms would deter private developers.
[40] Xueying Huang (2024) What Makes Munich’s Housing Shortage A District-Level Analysis of Housing Supply Responsiveness and Urban Planning Metrics Working Paper -School of Engineering and Design, Technical University of Munich
[41] See the interview here (in German)