“Hope starts with a home” was how the new Chancellor framed the formal unveiling of Your First Home (YFH) in his first Budget speech on 28
th October 2026.
[1]The policy was first announced in September,
[2] and further details of how the scheme will operate were published on 3
rd November, including local price caps.
[3]YFH is designed to provide the demand-side support that many in the sector
have been calling for over the last few years. Although the policy was largely welcomed on its initial announcement, the OBR’s assessment anticipates only a marginal effect on housing supply, albeit within a wider downgrade on the forecast level of housebuilding due to weaker demand, construction costs and wider regulatory and fiscal environment challenges.
[4]In this blog we explore the potential effectiveness of the scheme. The critical distinction – in exploring the impact of the policy – is between purchases supported by YFH, purchases that would not otherwise have occurred, and additional homes built as a consequence: those numbers will not be the same.
YFH is modest in scale, supporting 10,000–15,000 sales a year, well below Help to Buy at its peak. Our analysis suggests its biggest effect on affordability is likely to be in a ‘mid-market’ band across central England, the South West and parts of the North West, rather than the Greater South East, where price caps bite, and that many of those areas are now subject to the presumption in favour of sustainable development, suggesting the supply response there could be stronger than a national view suggests.
What does YFH promise?
Your First Home is expected to be opened for applications from April 2027. The five-year funding package of £4.7bn government-backed lending is set to provide around £700 million of equity loans annually, rising to £1 billion in 2028/29, supporting between 10,000 to 15,000 first-time buyer (FTB) sales each year. This compares with the £24.7bn total value of its predecessor Help to Buy over the ten years (average of £2.47bn each year) which supported the purchase of (at its 2018-2019 peak) 52,000 homes each year.
YFH offers first time buyers – who can put down a 2.5% deposit – a 20% equity loan subject to a household-income cap of £110,000 (outside London), which would improve mortgage access and monthly affordability for eligible households.
[5]The aim of the policy is to support more people into homeownership and boost housing supply
[6]. The recently published evaluation of the Help to Buy scheme found that “developers reported building more homes due to increased confidence, in turn increasing their build pace and number of sites” due to the scheme.
[7] Although YFH is more modest than the original H2B programmes, the Government will be hoping for the same kind of response.
A developer contribution applies to the final sale price for each sale supported by the scheme ratcheting up to 4% on each YFH sale for housebuilders selling more than 250 homes each year. The 4% is an additional margin cost on every YFH sale, which would need to be overcome by the hoped-for faster sales rate. This makes the net effect on build out uncertain. Housebuilders' share prices fell on the day of the Budget, with analysts reflecting that the reality of the scheme fell short of its predecessor with regard to a later than expected rollout and higher developer fees.
[8]
What do the YFH price caps do?
Access to YFH will be subject to property price caps, set “to ensure the scheme supports access to modest homes”. Last week, detail on the price caps in each local authority was published (see Figures 1a and b).
[9]The formula used to set the local authority price caps has not been made public,
[10] but the stated intention has been to focus support on a new build ‘modest home’ of the type normally bought by FTBs while recognising variation between local housing markets.
[11]The variations in price caps for the policy are substantial. The variation correlates with the first time buyer house price (0.85 R
2) as well as with median incomes (0.74 R
2). However, there are curious anomalies; for example, the price cap in Mole Valley of £330,000 is £40,000 below the average first time buyer average house price (£370,000), whereas in neighbouring Guildford the cap of £505,000 is £103,000 higher (£402,000); median resident incomes are also only slightly higher in Guildford (£45,900 compared with £42,900). It is not obvious why the price cap for Brentwood (£385,000) is so much lower than Braintree’s £435,000, when the median first-time property value in these areas is £397,000 and £315,000 respectively.
[12]In most areas, the median FTB house price is lower than the YFH price cap, meaning the policy would likely have an effect for those that it targets, however there are some 13 exceptions. Figure 1b shows these 13 local authorities (largely in the functional economic area around London but also Trafford, Southampton and Gosport) where the YFH price cap is below the median house price for FTBs in the area, meaning it will support only the purchase of lower than average priced properties. A further 19 authorities have caps less than 10% above the median. Of course, the caps bite harder because the first time buyer medians cover mostly second-hand homes while YFH only applies to new builds, which usually cost more.
Figure 1a and b: YFH price cap by LPA and ratio of price cap to median first time buyer price
Source: MHCLG / ONS / Lichfields analysis
Where could YFH make the biggest difference?
YFH will increase the number of properties that become affordable based on local incomes to first time buyers in most of the country outside of the Greater South East (Figure 2). To understand the level of this impact, we used median household income
multiplied by a 4.5x mortgage income multiple, assuming a 95% LTV mortgage without YFH. We then repeated the exercise under YFH, allowing for the 20% equity loan and 2.5% buyer deposit, subject to the relevant local price cap.
We then analysed five years of transactions
to derive a modelled sample of the number of house purchases that would be affordable to a first time buyer without (Figure 2a) and with (Figure 2b) YFH, shown as a slider.
The scheme will have its most significant effect in areas where local incomes are sufficient to support a house purchase, but house prices are not so high as to exceed local price caps or only be affordable on incomes that are higher than the scheme’s income caps. Due to the local price caps, the highest share of homes affordable on a median wage do not necessarily benefit the most from the scheme. In these areas, house prices are not the main barrier for FTBs; the constraint instead being the smaller number of potential buyers with sufficiently high incomes or access to deposits.
Figure 2a and b: Share of transactions that are affordable given median household income with or without YFH support
Source: MHCLG / ONS / Lichfields analysis
Consequently, the largest increases in the number of homes made affordable by YFH are concentrated in a ‘mid-market’ band across central England, the South West and areas of the North West. In these areas – where house prices are only marginally too high for local incomes – the policy could have a significant effect. Using our modelled sample of five years of property transactions adjusted to reflect first time buyer prices, we calculate that YFH increases by more than 20 percentage points the share of transactions falling within ‘purchasing capacity’ in most Local Authorities, given local incomes. This would suggest an upward pressure on the demand for new homes falling in this price band and, with all being equal, an expected increase in supply (Figure 3).
Figure 3: Change in share of transactions that are affordable given median household income with YFH support
Source: MHCLG / ONS / Lichfields analysis
What type of buyer might YFH help?
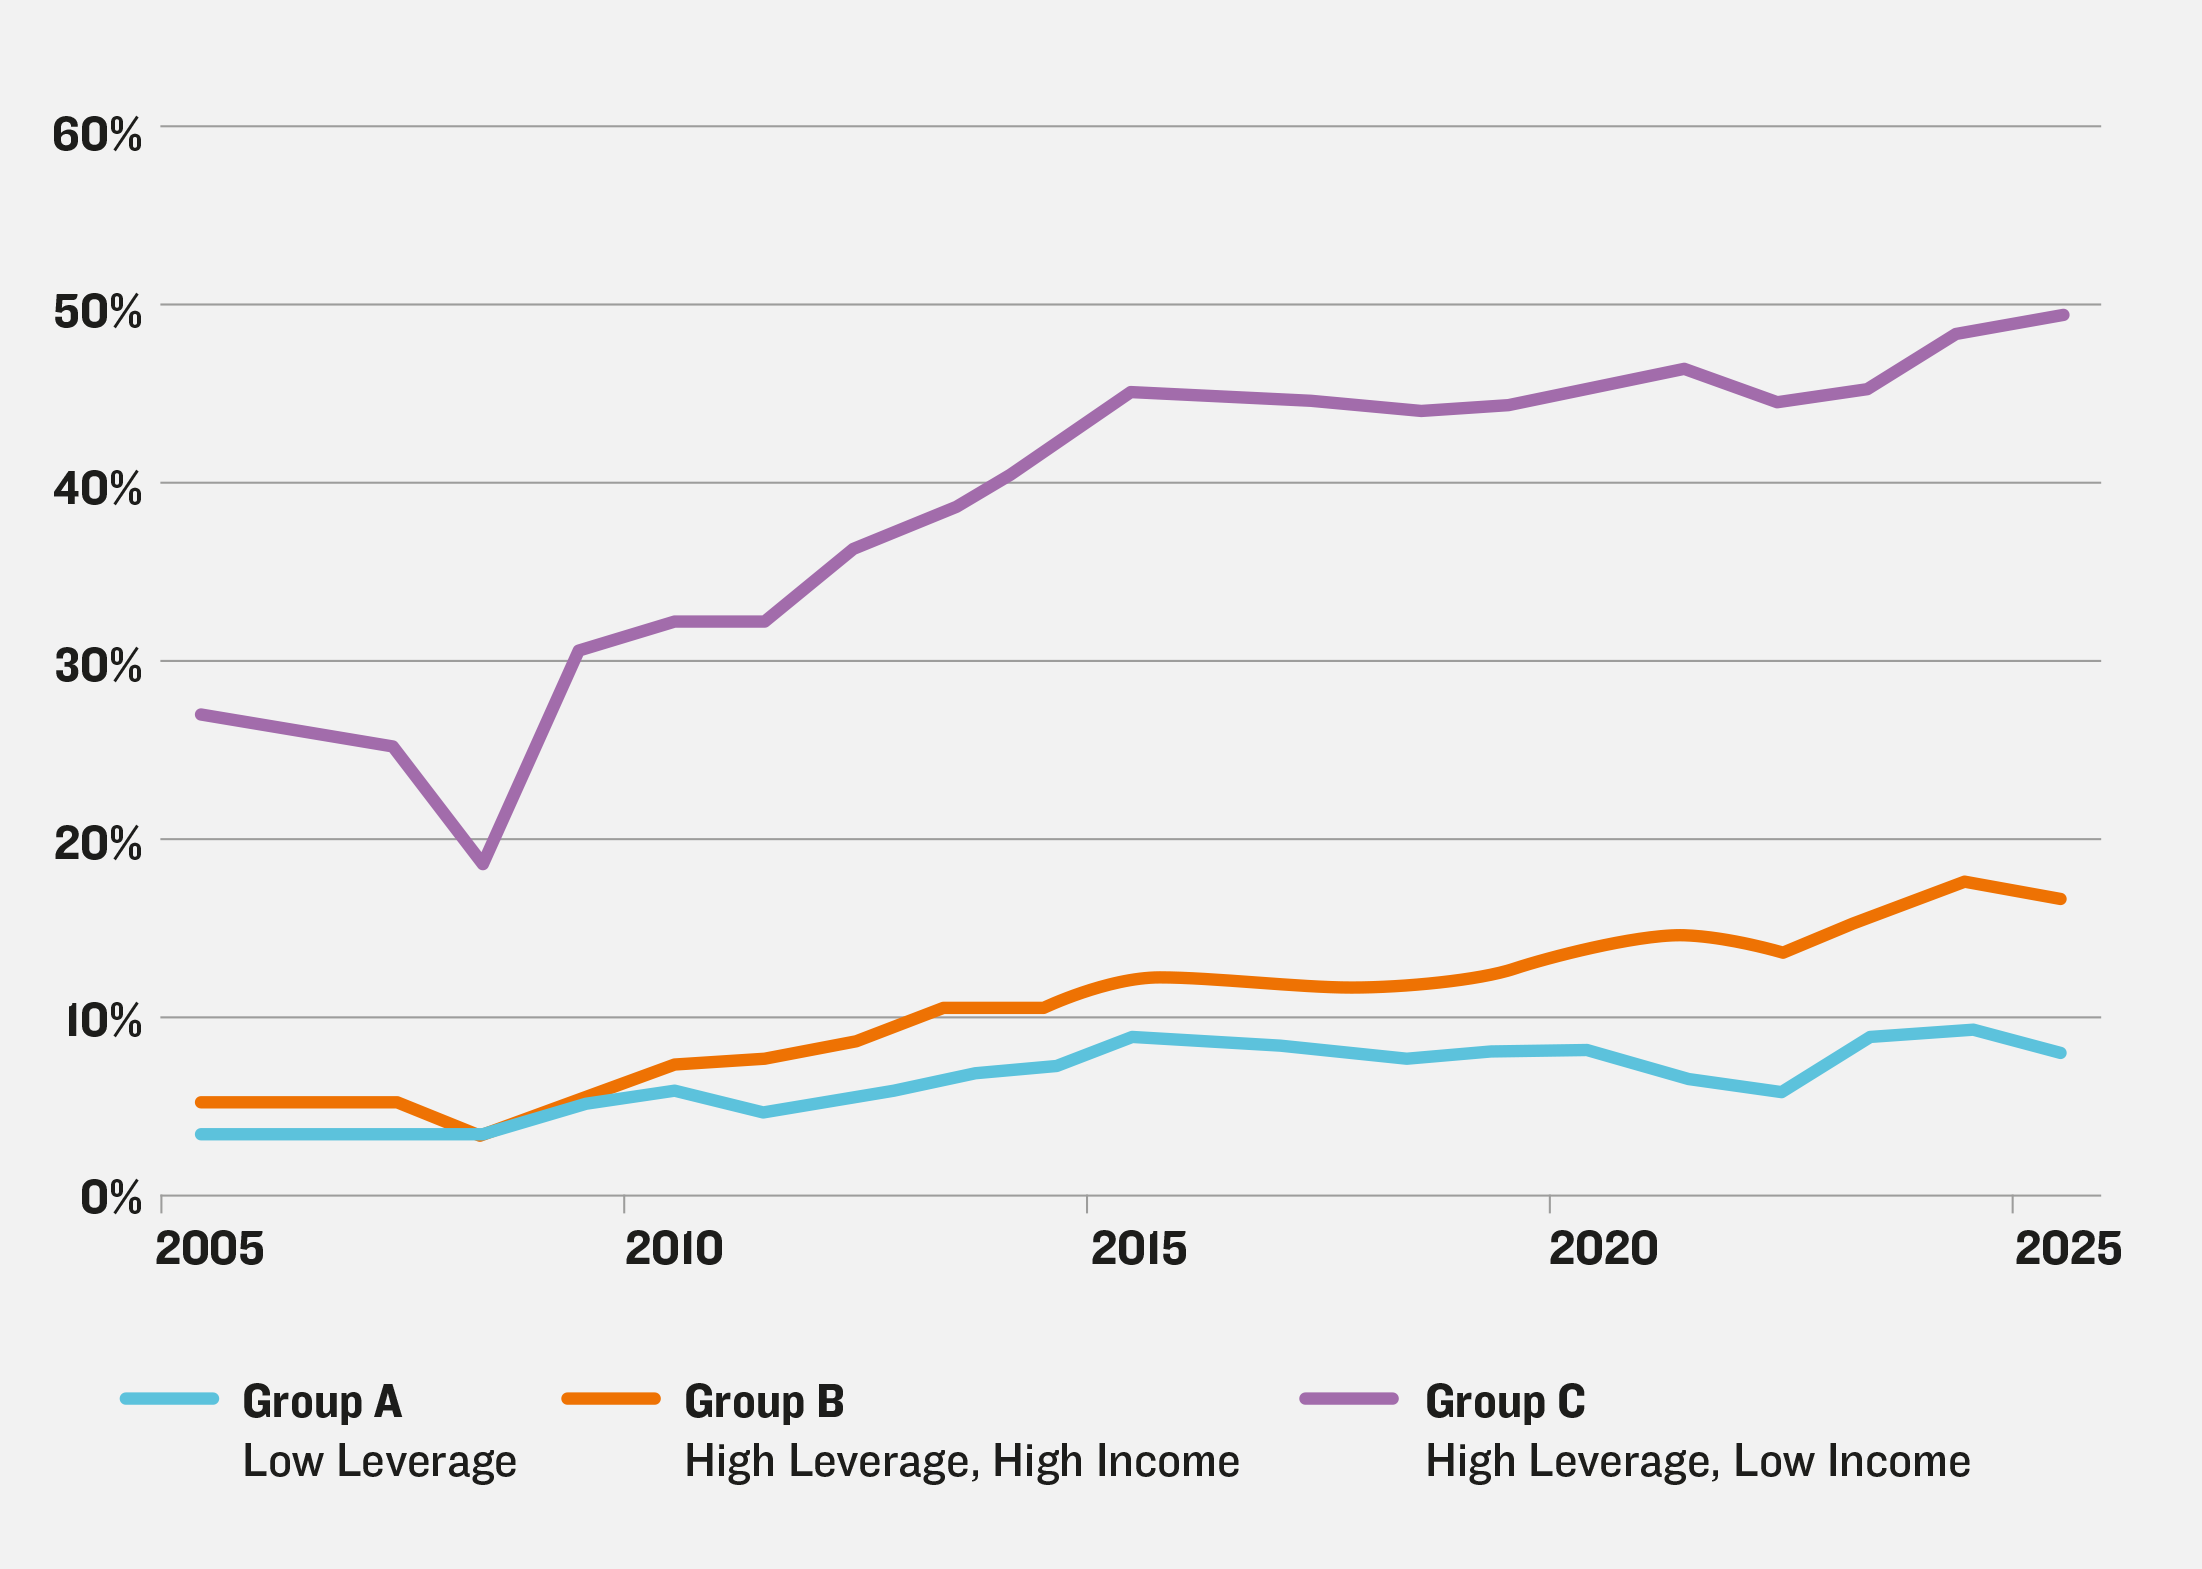
Analysis by Bank of England staff finds that equity loan schemes (such as Help to Buy) typically benefit potential buyers that could not access funds for a deposit (most typically from ‘the bank of mum and dad’
[15]). A similar analysis (Figure 4) of mortgage data finds that the cohort of home buyers that have increased most markedly over the last twenty years, has been those which are buying using “high leverage and low income”.
This group is described as “borrowers [that] are younger, with lower incomes and smaller deposits” and the group includes a “significant share of first-time buyers”. High leverage in the BoE analysis is a loan to value percentage of more than 75%.
Figure 4: First-time buyer share over time by BoE Typology groups
Source: Bank Underground
Under YFH, the shared equity element will reduce the mortgage leverage for those with lower deposits. Revealed preferences from further Bank of England analysis would suggest that house purchasers are relatively price insensitive: as house prices change, they continue to seek the same type of home, adjusting the value of loan rather than maximise the proportion of equity they own or minimise monthly payments per se
. The implication is that some of the support may be capitalised into higher new-build prices, as research on Help to Buy found in tighter markets such as London – it is this risk that the price caps are designed to contain.
Where might YFH lead to more homes being built?
Our
2025 blog on the case for demand-side support made the point that schemes such as Help to Buy have the greatest impact on supply – and are less likely to drive house price inflation – where planning allows for more land to come forward such that the build out of homes can increase in response to the increased demand. Our assessment is that, in today’s planning context, higher housing need figures via the Standard Method and the latest, pro-development NPPF policies mean that there are more opportunities for the housebuilding industry to respond to increases in demand than when Help to Buy was operational. For most of the period of its operation, the combined housing target of local plans in England was around 230,000 with a Housing Delivery Test (HDT) figure of 259,000; when combined with the number of areas where development was restricted by Green Belt, it can be no surprise housing development peaked at 248,590 in 2019-20.YFH will operate under the 2026 NPPF which has the ‘universal tilt’. This means the presumption in favour of sustainable development operates permanently within settlement boundaries, and operates outside settlements where, inter alia, there is unmet need for housing, including in Green Belt areas, based on there being no five-year land supply and/or an HDT failure. This means there is a generally permissive approach in principle across many parts of the country (see Figure 5).
Figure 5a: LPAs where presumption in favour of sustainable development applies under Policy S5(1)(j) or GB7 and 5b: Presumption status in areas where YFH is expected to make the greatest change to affordability
There is no correlation between the size of the impact of YFH and whether that authority is or is not subject to the presumption in favour of sustainable development, as independent variables this is to be expected. However it is notable that there are almost twice as many authorities (96) that are both subject to the presumption and have a 16% or higher change in number of homes that become affordable with YFH for median earners, than the 52 authorities that are impacted by YFH but do not have these looser restrictions on supply. It is these 96 authorities, that – on the policy’s own terms (to support more people into homeownership and boost housing supply) – represents an obvious ‘sweet spot’ for YFH: places where our analysis indicates a material improvement in purchasing capacity coincides with a more permissive planning position, albeit that does not automatically mean development will occur.
Conclusion
The Government's planning reforms – notably the Standard Method and the latest NPPF – represent what is probably the most positive supply side planning regime for decades. What this could achieve was clearly undermined by the absence – for the first time in decades – of meaningful demand side support. YFH helps to address that gap.
However, the reality is that
these policies must align with other conditions necessary for a functioning housing market and viable development; this includes other regulatory requirements, the macro-economic and geo-political environment that all affect the choices and ability for individuals to buy a home and developers to build them.YFH will be seen by many as a welcome return of demand-side support but – at well below Help to Buy’s scale and with a developer contribution attached – it will not on its own deliver a step change. Its greatest impact will be in the areas at the sweet spot where sufficient potential buyers are newly able to buy homes, and whereby the housebuilding market industry can respond by increasing supply. Our analysis suggests these are in mid-market areas outside the greater South East, many of which are now subject to the presumption in favour of sustainable development outside settlement boundaries.
The OBR may or may not be right about a modest national impact on the supply of new homes, but our analysis shows that the actual effect will be driven by the aggregated supply elasticity in particular local markets where YFH has most traction.
Footnotes
HMT, Budget 2026 Speech, 28th October 2026 MHCLG, New first-time buyer scheme to be confirmed at Budget, 26th September 2026 MHCLG, Guidance: Your First Home, 3rd November 2026 OBR, Economic and fiscal outlook – 28th October 2026 MHCLG, Guidance: Your First Home, 3rd November 2026 MHCLG, Your First Home press release, 26th September 2026 MHCLG, Evaluation of the Help to Buy scheme: evaluation findings report, 16th September 2026 Reuters, UK homebuilders slump as budget's first-time buyer scheme disappoints, 28th October 2026 “The homebuilders sector index fell more than 6% after the minister's budget speech, reversing a rally of about 9% since the government announced the scheme in September.” MHCLG, 2026, Your First Home: local authority property price caps It has been suggested that it is based on a three-year trend of values for new homes purchased by first time buyers in each local authority area; in a period of low supply and a poor market it is thus susceptible to localised and anomalous patterns of new build activity in those years, e.g. small apartments in the town centres rather than small houses. MHCLG, Your First Home Guidance, 3 November 2026 ONS, 2026 First time buyer mortgage sales; Table 3b, Median purchase price for first time mortgage sales ONS, 2026, Median Household Income levels by LSOA, we used population weighted modelling to derive median Household income levels at the Local Authority level. Land Registry, 2026, Price Paid Data for all transactions July 2021- July 2026 adjusted by inflation to April 2026 prices. For all homes built before 2020 but sold in this period, we add a premium of 5% to reflect the ‘new build premium’ whereby new homes sell for higher values than average sales, based on the Help to Buy evaluation, which found this premium to be 5% (MHCLG, 2026, Evaluation of the Help to Buy scheme: evaluation findings report). Bank of England, 2025 Credit constraints and the redistribution of housing wealth – Bank of England Staff Working Paper No. 1,147 Bank Underground, 2026 Demographics, deposits and data: using machine learning to segment UK mortgages – Bank Underground Bank Of England 2024, Staff Working Paper No 1,086, Housing-consumption channel of mortgage demand. MHCLG, Housing supply: net additional dwellings, England: 2024 to 2025, 20th November 2025 A term used by the Minister in this letter to PINS,