At Prime Minister’s Questions on Wednesday 9th September, Andy Burnham argued that a major council housebuilding programme could save billions in Housing Benefit, describing it as “the Labour way”.
The PM referred to research from the National Housing Federation (NHF), which is seemingly the 2024 report by CEBR for NHF and Shelter. It estimates that 90,000 Social Rent homes would generate £86.5bn of gross economic and social benefits over 30 years, including a net Exchequer benefit of £11.896 billion.
The report makes a strong strategic case for Social Rent. But its use in a debate about reducing welfare spending (to increase defence spending to 3.5% by 2035) raises three initial questions:
-
Do Housing Benefit savings pay for Social Rent homes?
-
How dependable are the other benefits? and
-
Where does the necessary funding come from?
There is also – as ever – a fundamental land and planning question about whether Section 106 can deliver the assumed cross subsidy the NHF/Shelter analysis requires of it.
What the report says
The analysis covers a single annual cohort of 90,000 homes.
Although the wider proposition is a ten-year programme of 900,000 homes, CEBR does not model successive cohorts and notes that their operating environment and assumptions may differ.
Table 1: The Report's Key Measures
|
Key Measure
|
Figure
|
| Social Rent homes |
90,000 |
| Total development cost |
£35.367bn |
| Government grant |
£11.825bn |
| Provider and other funding |
c.£23.5bn |
| Initial annual Housing Benefit saving |
£243.8m |
| Housing Benefit saving, 30-year PV |
£4.485bn |
| Gross Exchequer benefits |
£23.721bn |
| Net Exchequer benefit |
£11.896bn |
| Gross socioeconomics benefits |
£86.5bn |
| Net socioeconomic value |
£51.183bn |
Source: CEBR
The £11.825bn grant required for one cohort is about three times the current programme’s average annual investment of £3.9bn, under which the Government expects 18,000 Social Rent homes a year.
Do Housing Benefit savings pay for Social Rent homes?
No, and the NHF/Shelter report does not claim they would. The £4.485 billion saving is a discounted 30-year present value, compared with £11.825bn of government grant. The initial annual savings is £243.8 million.
That estimate is based on a series of linked assumptions, for example, that 75% of occupants receive housing support and that vacancy chains ultimately release 65,292 homes to households otherwise living in the private rented sector, generating an annual rent-support saving of £3,735.5. Yet l
ettings data shows tenants come from a varied set of previous tenures and circumstances. Actual savings would depend on the circumstances and previous tenures of those housed.
How dependable are the other benefits?
Of course, the potential savings for the Government are not limited to Housing Benefit (see Table 2), and the total (including housing benefit) is estimated at £23.8bn against a government grant for the programme of £11.8bn.
Table 2: Exchequer benefits from building 90,000 social rented homes
|
Exchequer benefit
|
30-year present value
|
| Housing benefit saving |
£4.485bn |
| Tax revenue from construction |
£2.473bn |
| Universal credit saving |
£3.289bn |
| Healthcare saving |
£5.170bn |
| Homelessness-services saving |
£4.512bn |
| Income Tax and NI from employment |
£3.793bn |
| Gross Exchequer benefit |
c.£23.7bn |
| Less government grant |
£11.825bn |
| Claimed net Exchequer benefit |
£11.896bn |
Source: CEBR, Table 12
This wider fiscal case is credible in principle: secure housing can reduce homelessness and healthcare pressures and support employment. But the estimates vary in robustness. Rent and temporary-accommodation savings follow relatively directly from lower housing costs. Healthcare, employment and tax benefits depend on longer causal chains, while construction taxes are net additional only to the extent that the programme does not displace other activity. The £23.7bn total should therefore be understood as a modelled estimate, not a guaranteed fiscal return.
Where does the necessary funding come from?
The NHF/Shelter report assumes £35.367bn of total development cost. Government provides £11.825bn of grant towards 60,000 homes; the remainder comes from provider resources, borrowing, rents and market activity, while 30,000 homes are assumed to be delivered without grant through cross-subsidy such as Section 106. The claimed fiscal return therefore depends not only on public grant but also on about £23.5bn from other sources.
The funding ask is demanding:
-
The £11.825bn Government grant would need to be funded through borrowing, taxation, or savings. Given the current state of the public finances, it is reasonable to assume any programme of this kind would rely on borrowing.
For all the long term benefits, it is not clear this uplift in funding would improve the Chancellor’s near-term fiscal headroom.
-
Registered Providers face higher borrowing costs and increased spending on existing homes, while councils face construction-cost inflation, retrofit and safety obligations, and wider financial pressures.
The model treats the availability of this funding as an input rather than testing whether the sectors can provide it. In 2024/25
, excluding s.106 homes, the sector itself delivered around 40,380 affordable homes, of which just 8,600 were Social Rent.[14] The Regulator of Social Housing reports on the 2025 Global Accounts of private Registered Providers says: “Providers continued to spend record amounts on improving the quality and safety of existing homes whilst also maintaining investment in new supply. When combined with higher rates of interest on new and refinanced debt, financial capacity remains constrained and some financial indicators have weakened at a sector level.”
-
Meanwhile, 2024 research by UCL found whilst Council housebuilding is a mainstream activity, local authorities face a combination of obstacles, including construction-cost inflation, higher borrowing costs, housing-safety and retrofit obligations, wider local-government financial pressures and uncertainty over future planning and funding arrangements.
Can the sector increase its total volume by 50% with a shift in its tenure towards a product with a lower revenue stream? Obviously, the NPPF reforms and more Government funding as suggested by NHF/Shelter might help unblock latent capacity and address some of these issues.
But the report’s modelling still assumes a significant boost in investment from two sectors operating with financial pressures. The report treats funding flows as an input and does not test the realism of it being achieved.
Further, the above numbers relate to a single year. Repeated over ten years, the proposition would imply 900,000 Social Rent homes, £353.7bn of development cost, £118.3bn of grant and about £235bn of other funding. Stable procurement could improve productivity, but sustained demand might also increase land, labour and construction costs. A programme on this scale would therefore require explicit modelling of delivery trajectories, debt capacity, inflation and delivery lags.
Delivering the 60,000 grant-supported homes would also require councils and Registered Providers to act more extensively as developers: promoting and acquiring land, partnering with developers and progressing schemes ahead of plan allocations under NPPF Policies S45 and S5. Increased affordable housing funding can strengthen demand for consented land, but it does not create that land. Supply will
take time to respond to the more permissive planning framework.
The big land and planning question
We come now to the third of Social Rent homes that the NHF/Shelter proposition says require no grant because they are funded through S.106.
Section 106 affordable housing is funded from development value after allowing for construction and finance costs, infrastructure, developer return and a competitive landowner return. The CEBR results assume this mechanism can deliver 30,000 Social Rent homes each year without grant, but do not test whether that assumption is viable.
Social Rent and Viability
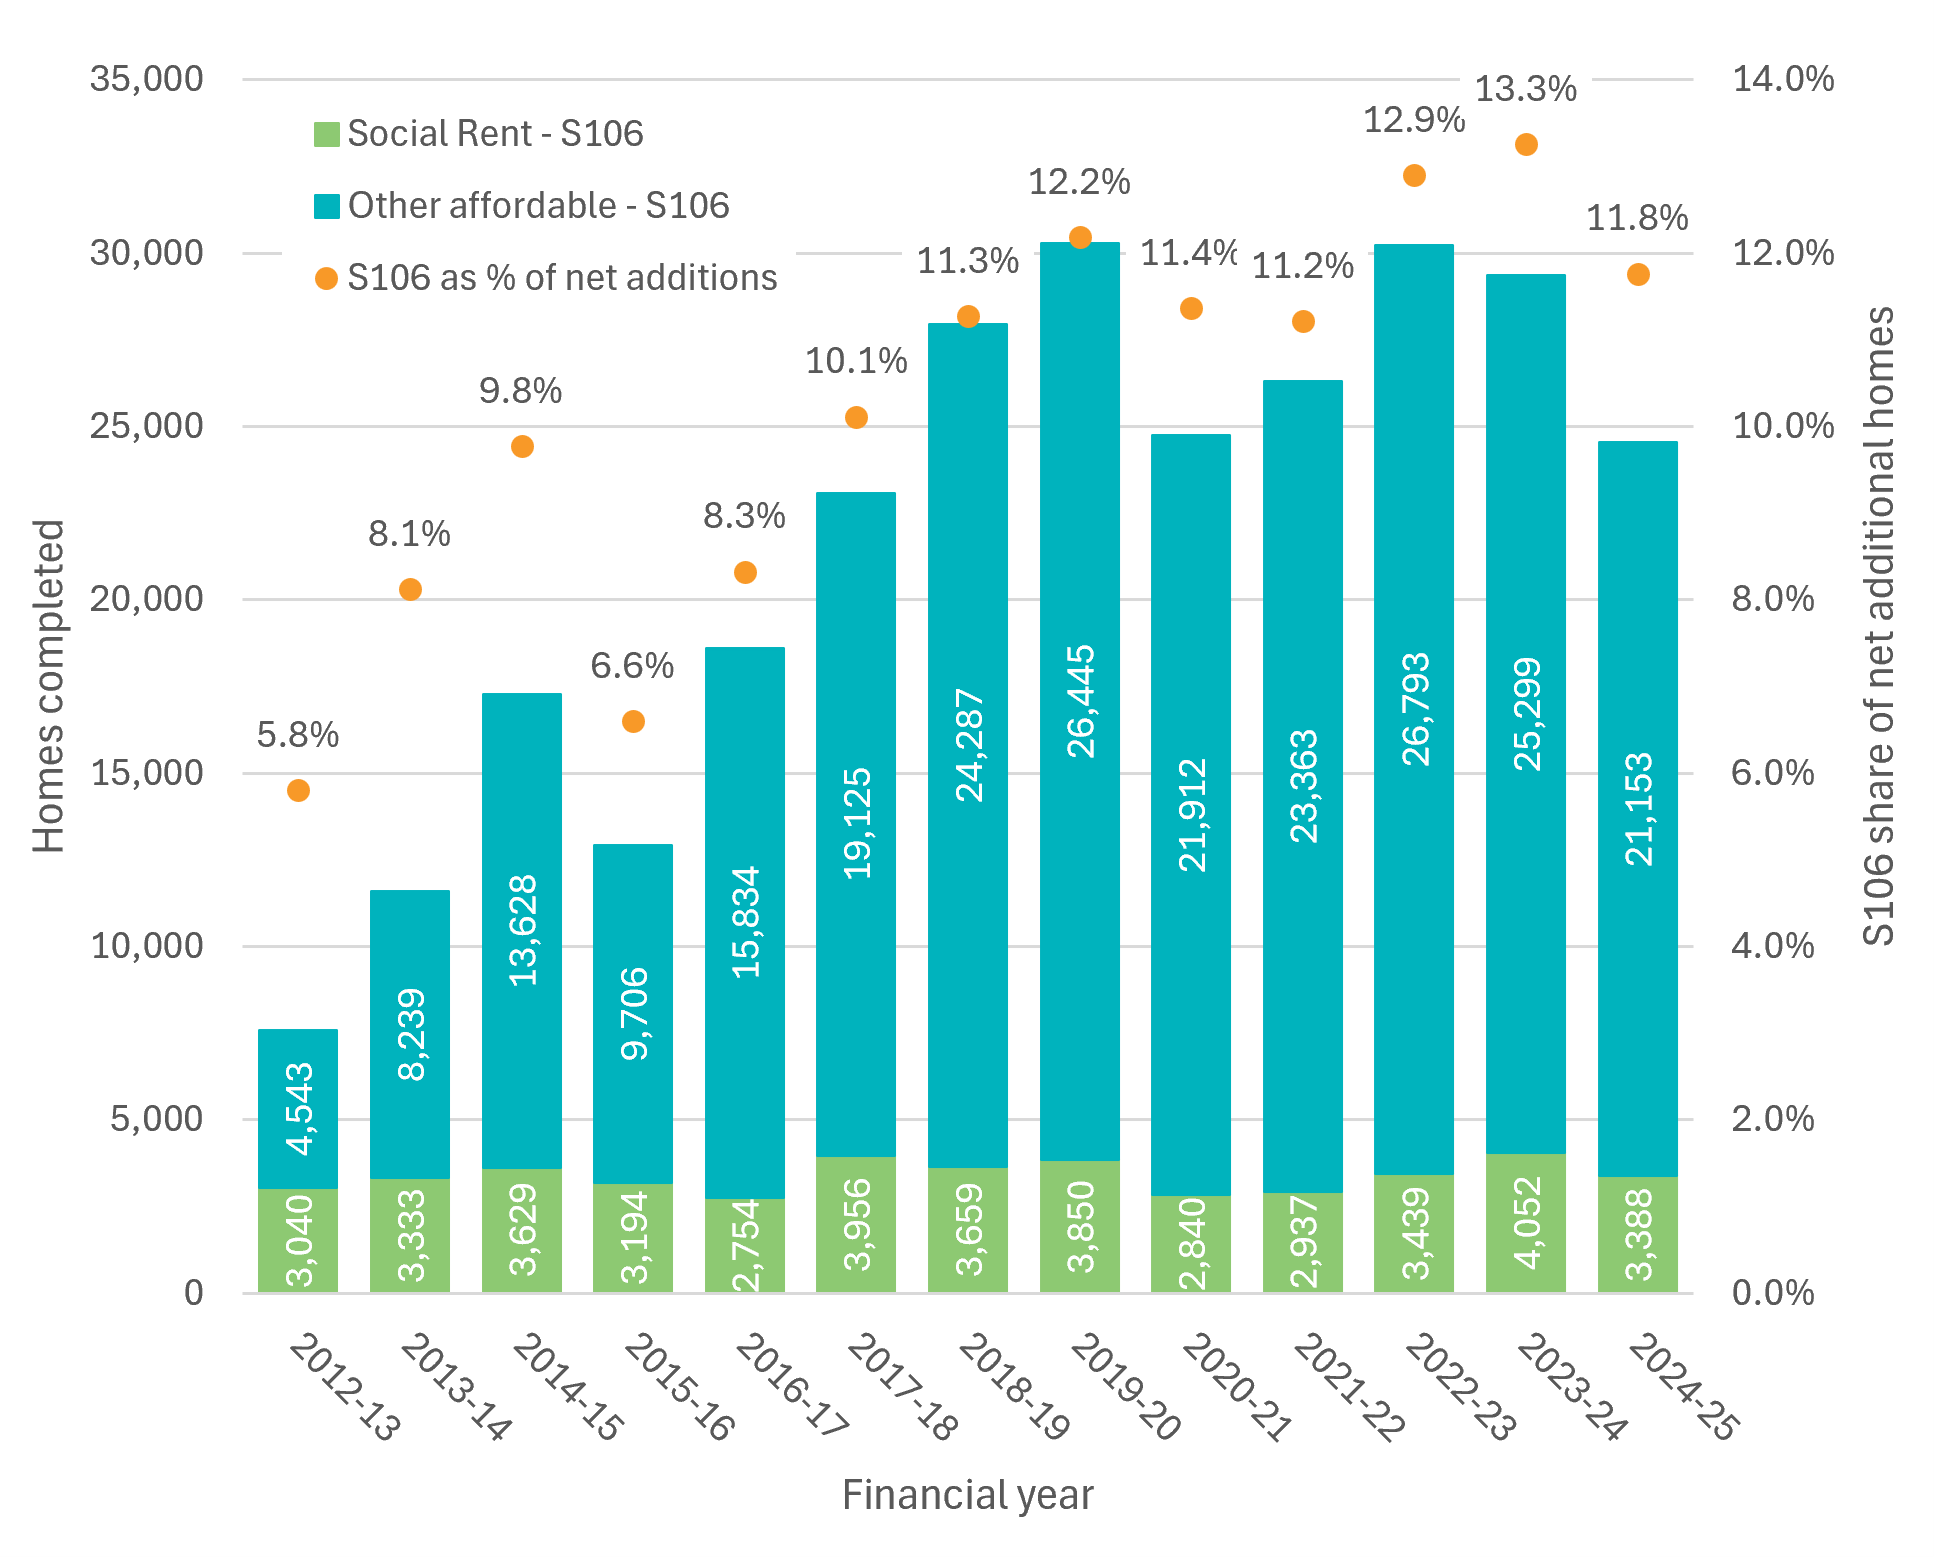
Recent Section 106 delivery of around 20,000 to 26,500 affordable homes a year might make the 30,000-home assumption appear achievable.
However, this ignores two critical factors, as shown by Figure 1.
Figure 1: Affordable Housing delivered through s.106
Source: MHCLG / Lichfields Analysis
Firstly, s.106 affordable housing delivery is cyclical: it dropped 19% last year to about 23,400 homes, with more units funded by grant. This reflects the widely recognised squeeze in the housing market and difficulties experienced finding Registered Providers who want to take on new stock.
Secondly, only 11–14% of s.106 homes are Social Rent, and annual delivery of those has never exceeded 4,000; the rest is Affordable Rent or intermediate products such as shared ownership.
This reflects the underlying economics. Social Rent generates the greatest benefits through lower rents, but those same rents reduce the value available to fund construction. Without grant, delivery requires lower land values, few competing obligations, a strong sales market, a lower affordable housing percentage, or some combination.
Overall housing delivery
The NHF/Shelter report does not calculate the total amount of market-led development needed to generate 30,000 cross-subsidised Social Rent homes. Our scenario testing below shows how quickly the denominator grows depending on the percentage of the total that is achievable reduces to respond to viability.
|
Effective affordable housing share
|
Total homes on market-led schemes
|
Other homes (i.e. market) within those schemes
|
| 20% |
150,000 |
120,000 |
| 15% |
200,000 |
170,000 |
| 10% |
300,000 |
270,000 |
| 5% |
600,000 |
570,000 |
Adding the 60,000 grant-supported homes produces total annual housing activity of 210,000 at a 20% Section 106 share, rising to 660,000 at 5%. Given the much lower value of Social Rent, achieving 30,000 units at 10% would be highly demanding; at 5%, it would require 570,000 associated market homes. The exercise underlines both the importance of meeting the Standard Method total of about 370,000 homes and the sensitivity of the proposition to viability.
Whatever the precise percentage, delivery depends on a planning system that releases sufficient land and a private market capable of generating the value needed for cross-subsidy. That requires buyer demand, mortgage availability, development finance and confidence that land pipelines can be replenished. Planning reform addresses only the supply side; some form of demand support may also be needed to increase build-out and Section 106 delivery.
Is the PM’s proposition sound?
The ‘housing theory of everything’ is a popular explanation for many societal ills. The Prime Minister is clearly a subscriber. More genuinely additional Social Rent housing can reduce Housing Benefit, temporary-accommodation expenditure and other public-service costs, particularly in expensive housing markets.
The Prime Minister cited the NHF/Shelter research as the basis for his ‘Labour way’ approach to rebalancing public spending away from welfare. Yet the Government’s current grant funding programme for affordable housing – while a significant increase on what it replaced - is just a third of the scale that the NHF/Shelter report advocates. It will deliver some Exchequer benefits, but relative to the total size of the state (£1.29 trillion), the scale will be modest.
What is the case for going further? Under the NHF/Shelter assumptions, one 90,000-home cohort initially saves £243.8 million a year in Housing Benefit and delivers a host of other benefits, including a net Exchequer saving of £11.896bn over 30 years.
The attractions to the PM of this argument are obvious. But there are nevertheless a series of challenges and unanswered questions:
-
The report does not show that Social Rent pays for itself through savings on Housing Benefit. The modelled 30-year saving is £4.485bn against £11.825bn of government grant
-
The claimed £11.896bn net Exchequer benefit depends on combining that saving with less direct and inherently less certain assumptions about health, employment, Universal Credit, homelessness and tax receipts. These benefits are plausible, but many are downstream of the direct intervention or subject to other assumptions.
-
Most importantly, the result depends on Government funding only one third of the £35.367bn development cost. Councils, Registered Providers, rental income and market activity must pick up the rest.
-
Councils and Registered Providers face financial pressures and their capacity to deliver at scale – at least in the short term - is uncertain.
-
30,000 Social Rent homes are assumed to be delivered without grant through cross-subsidy such as s.106. This is the report’s most demanding assumption:
a. Recent s.106 delivery has been below 25,000 affordable homes of all tenures, with only a small proportion provided as Social Rent;
b. Currently, around 10-13% of net additional homes each year are delivered through s.106, and this model is under viability pressure. If Social Rent represented 10% of homes on relevant market-led schemes, delivering 30,000 units would require 270,000 associated market homes. At 5%, it would require 570,000. The fiscal proposition therefore relies on land being released at least in line with the Government’s Standard Method target, schemes remaining viable and the private market absorbing homes at a sufficient rate, likely supported by some kind of demand-side assistance.
-
The significance of these points for the Government’s wider agenda for re-balancing spending is this:
a. The net Exchequer benefits depend on the Government achieving 90,000 Social Rent homes through directly funding only one third of the cost.
b. If cross-subsidised homes were not delivered, and the same £11.825bn grant produced only 60,000 Social Rent homes the modelled net Exchequer benefit would fall to about £4bn over 30 years; within the margin of error given the causal chain involved.
c. If Government instead had to double its grant investment to £23.65bn because of weaknesses in other funding from Local Authorities or Registered Providers, or viability of s.106, almost all the claimed Exchequer benefit would disappear.
The central point is that Social Rent does not sit apart from the wider housing market. Large-scale provision can create substantial public value, but the fiscal return is not axiomatic. In addition to huge questions over public spending, it depends on sufficient land supply, viable development, Section 106 delivery, council and Registered Provider capacity, and a functioning private sales market. Any attempt by Government to go further and faster on its affordable housing programme will need to address those dependencies if it wants to realise the benefits.
[1] He said: “We have set out plans for the biggest council house building programme this country has seen in a generation. If the right hon. Lady looks at research from the National Housing Federation, she will see that that is the route to save billions from housing benefit.” Hansard, 9th September, Column 1037
[2] See this BBC News Story National security can't come at expense of social security, Burnham says 9th September 2026, accessed 10th September 2026
[3] CEBR, The economic impact of building social housing report produced for NHF and Shelter, February 2024
[4] It wouldn’t be a Lichfields blog without one.
[5] Based on the need analysis in the Glen Bramley’s 2019 research on housing supply requirements
[6] See footnote 6 of the NHF/Shelter report.
[7] MHCLG Policy paper: Social and Affordable Homes Programme 2026-2036: MHCLG policy statement to accompany guidance to bidders from Homes England and the Greater London Authority, 7th November 2025. The 18,000 is out of a total of 30,000 Affordable Homes, with the balance made up by other tenures.
[8] See Sections 4.2 and 5, Tables 12–14, pp. 48–54. The discounted Housing Benefit saving recovers about 38% of the public contribution before financing or opportunity costs
[9] MHCLG, Social housing lettings in England, tenants: April 2024 to March 2025, 13th November 2025. The statistics show the variety of previous circumstances from which households enter social housing, including private renting, temporary accommodation, owner occupation, living with family and friends, and other routes, illustrating the uncertainty around assumptions concerning future vacancy chains and Housing Benefit savings
[10] See for example the analysis here (drawn from the Milburn Review on NEETS) and here (the Lichfields work for HBF on the impact of reducing housing supply)
[11] See the NHF/Shelter report - Section 2.1, pp. 16–17, and Section 4.5, p. 50.
[12] The Debt Management Office's own results show a Treasury Gilt maturing in 2054 priced at a yield of 4.5699% in January 2024, and as high as 5.8168% on 8th September 2026. See UK Debt Management Office Results of Syndicated Offerings
[13] See the NHF/Shelter report - Section 2.4, pp. 32–36.
[14] See MHCLG Table 1000 on affordable housing supply
[15] Regulator of Social Housing, 2025 Global Accounts of private registered providers, 15 January 2026
[16] UCL Local authority Direct Provision of Housing: Fourth Research Report January 2024
[17] Taking an illustrative example of a market rent of £1,500 per calendar month (ONS Private rent and house prices, UK: August 2026 shows average rents of £1,451 in England), affordable rent at 80% equates to £14,400 annually, whereas Social Rent at 50% would be £9,000. This would create a gross annual gap of up to £5,400 per home, which across 30,000 homes would amount to up to £162m before other costs. See this 2026 Policy Statement on rents for social housing
[18] Just as the Government’s boost in funding for affordable housing in 2025 has been welcomed by NHF for these reasons.
[19] My blogs on LVC (in the context of the debate on hope value) and the Green Belt Golden Rules explored this approach.
[20] See NHF/Shelter Report - Section 2.1, pp. 16–17, and Section 4.5, p. 50.
[21] See MHCLG Table 1000 on affordable housing supply
[22] Yielding this Government response Policy statement: a roadmap for Section 106 delivery in England, March 2026
[23] See MHCLG Table 1000 on affordable housing supply
[24] See the PPG on Viability. The number of affordable homes currently being delivered by s.106 are the product of Government viability guidance which requires plans to specify and test the amount and type of affordable housing, including minimum Social Rent requirements
[25] The housing theory of everything - Works in Progress Magazine
[26] HMT Public Spending Statistics, May 2026